
|
|
|
|
EXPERIMENTAL STUDY OF MEAN DROPLET SIZE FROM PRESSURE SWIRL ATOMIZERSherry Kwabla
Amedorme *1
|
|
|
|


Article Type: Research Article
Article Citation: Sherry Kwabla Amedorme. (2020). EXPERIMENTAL
STUDY OF MEAN DROPLET SIZE FROM PRESSURE SWIRL ATOMIZER. International Journal
of Engineering Science Technologies, 4(6), 49-59.
https://doi.org/10.29121/IJOEST.v4.i6.2020.124
Received Date: 14 October 2020
Accepted Date: 18 December 2020
Keywords:
Pressure-Swirl
Nozzle
Sauter Mean
Diameter (SMD)
Injection
Pressure
Axial Distance
Radial Distance
ABSTRACT
This experimental study undertakes the measurements of droplet Sauter Mean Diameter (SMD) at different axial distances for the hollow-cone nozzle and different radial distances from the spray centreline using a laser-diffraction-based drop size analyser in order to validate atomization model. The study also investigates the influence of injection pressure and the evaluation of two exit orifice diameters on the Sauter Mean Diameter (SMD). The drop size distributions along the nozzle centreline as well as the radial drop distributions from spray centreline are also evaluated. To enhance the physics of liquid sheet instability and liquid film breakup mechanisms, visualization of liquid film breakup as a function of injection pressure was carried out. The results show that mean droplet size (SMD) increases in the axial distance on the spray centreline but decreases with an increasing injection pressure on the spray centreline. It was observed that larger sized drops occupy the spray periphery compared to those occupying the spray core. For the nozzle exit orifice diameters of 3.5 mm and 1.5 mm, the results show that the small nozzle exhibits smaller SMDs than the bigger nozzle and the break-up lengths are different for the two nozzles. The drop size distributions at radial positions showed an increase in droplet formation through the spray downstream distances and become more uniform. The visualisation of the spray was carried out using high-speed camera and it was noted that a well-defined hollow-cone spray was captured and that the spray angle increases with the injection pressure but reduces with the liquid film length.
1. INTRODUCTION
The spray characteristics are usually measured using a Malvern Spraytec which is a non-intrusive, laser-diffraction-based drop analyser designed to continuously measure drop sizes and distribution information for continuous sprays. This instrument is one of the most convenient and reliable spray analysers used in examining the global characteristics of sprays and measures at a wide range of operating parameters of the nozzle [1], [2], [3]. The Malvern Spratec instrument is based on the Fraunhofer diffraction theory of a collimated laser beam (He-Ne) scattering by moving drops. Light from the laser is scattered by the spray droplets. The laser beam is expanded by the collimated optics to provide a wide range parallel beam. The scattered light is focussed by a focusing lens in a Fourier arrangement and picked up by the detector array. Unscattered light is focused by the focusing lens so that it passes through the pinhole at the centre of the detector array. This is measured by the beam power detector to give light transmission [4], [5]. To prevent particulate contamination of the optical apertures, there is a long base bridge with a 500 mm internal span between the transmitter and receiver optics, and a flow control panel provides clean and pressurized liquid to the centrally positioned nozzle between the transmitter and receiver optics. The electronics interface power the optical head acquires the raw scattering data process and transmits the signal information to the computer. The processed scattered data from the Spraytec is saved to the hard drive of a personal computer with Spraytec software installed. This software converts the raw data into useful mean drop sizes and distribution data [6]. The principles of laser diffraction drop size measurements have been discussed extensively (Lefebvre [3], [7]; Malvern Spraytec Manual [4]; Emekwuru, [8]). When a parallel beam of light interacts with a drop, a diffraction pattern is formed such that some of the light is diffracted by an amount depending on the drop size. In general, large drops scatter light at small forward angles and small drops scatter light at large forward angles [4]. A lens focuses the diffraction pattern onto a photo detector
Which measures the scattered light intensity. A curve-fitting program is used to convert the scattered light intensity into an empirical drop size distribution function, and this is displayed instantly. The need to avoid making drop size measurements close to the nozzle has been stressed by Wittig et al [1] and Lefebvre [9]. The rapid deceleration of the smallest drops in the spray in this region gives rise to readings of SMD appreciably lower than the true value. Chin et al [10] recommend a downstream distance of 25cm as being the ideal plane at which to make the drop size measurements. Lefebvre [9] indicated that their calculations take no account of evaporation and suggested that to minimize errors arising from this effect it is desirable to keep the distance as short as possible and estimated that 15cm was the best downstream distance. For the nozzle size and the liquid used in the experiments of Lefebvre [6], 50 mm was the best minimum axial position beyond which the results were consistent and below which no meaningful information was obtained for mean drop size and distribution. This also agrees with the downstream distance used by Emekwuru [6]. All measurements were taken with the laser beam passing through the centreline of the spray. The problems associated with such measurement have been discussed by various workers including Dodge [11] and Chin et al [10]. However, Lefebvre [9] indicated that centre measurements are generally preferred because they encompass both the smaller drops in the core of the spray as well as the larger drops at the spray periphery. Hirleman et al [12] and Dodge [11] exposed some of the limitations of the instrument while several researchers have indicated that the variation in mean drop size and size distribution can be influenced by the effects of drop acceleration and deceleration [9]. In the pressure swirl nozzle, liquid under pressure is formed into finely atomized droplets and work on the tangential flow principle. Inside the nozzle, there is an axial groove that injects the liquid tangentially into the vortex chamber where the strong centrifugal force produces a high rotational velocity and generates a finely atomized liquid hollow cone sprays. The relevant characteristics which determine the performance of these nozzles are the liquid flow delivered as a function of the feed pressure, the opening angle of the produced spray the nozzle efficiency as the ratio between the energy of the spray and the energy used by the nozzle as well as the evenness of the flow distribution over the target coupled with the droplet size distribution of the spray [3]. Dombrowski and Hasson [13], Wang and Lefebvre [9] indicated that the motion in the swirl chamber is complex and the mechanisms of flow within the chamber and the resultant spray outside are not fully understood and therefore further research needs to be conducted on this atomizer. This unsatisfactory situation is due to several causes such as the great complexity of the atomisation process, differences in the design, size, and operating conditions of the nozzles tested and the inaccuracies and limitations associated with drop-size measurement techniques [3].
2. EXPERIMENTAL SET-UP AND CONDITIONS
The experimental studies involved using a hollow cone nozzle to produce a spray to assess and validate an entirely Eulerian model involving mainly modelling of the liquid mass and surface density to predict the mean drop sizes. A laser-diffraction-based drop size analyser (Malvern Spraytec) was used to obtain drop size data from the free spray. The hydrodynamics structure was characterized by the spray drop size (Sauter Mean Diameter, SMD) and size distribution. This was measured at various axial distances from the tip of the nozzle and radial distances from the spray centreline. The influence of injection pressure, volume flow rate, and geometrical sizes on the mean drop sizes were also investigated. The liquid sheet break-up process was also visualised and analysed using a high-speed camera. Spraytec software (version3.30) was used to analyse the raw data obtained from the experiments and convert them to drop size (SMD) values and size distribution information.
The Malvern Spraytec apparatus was designed to produce a continuous spray and to examine the spray characteristics quantitatively and qualitatively. The experimental layout is shown in Fig.1. Water, which was the working fluid, was initially collected in a 0.4L container and fed into the mainline by a pump (A TCS Micro pumpR pump (S/N: 16062755 TCS) controlled by 24V power supply. A 300W triple power source by TTiR (EX354Tv) was used to control the pump speed by varying the supplied voltage. The resulting pressure drop across the apparatus was measured using a pressure transducer ifmR (PT5414) which has a range of 0.16-40 bar (16-4000kPa). The pressure sensor detected the pressure in the system and converted it to an analogue signal which was read by a digital multimeter and later converted to pressure. The set-up of the pressure measurement device was that of a typical 4-20mA circuit set up with a 500Ω resistor. To atomise the fluids, a stand was built whereby the fluid was atomised downwards into the laser beam as illustrated in Fig 1. The stand was built to allow for variation in the axial distance above the laser beam as well as in the other two perpendicular directions. A clamp was used to hold the nozzle to the stand allowing for the nozzle to be changed quickly. A plastic container was used to collect the fluid from the spray. The deflection of the sprayed liquid from the container back to the measurement region initially caused problems during atomisation which affected the drop size measurement. To solve this problem absorbent tissue papers at the base of the collection chamber prevented splashback.
|
|
|


Figure
1: Malvern Spraytec experimental set-up
The atomizer
used for this study was the modelled pressure swirl nozzle manufactured by PNR
Ltd which produces hollow cone sprays. This company manufactures various types
of quality nozzles to precision. It is made of AISI 303 stainless steel and
specifications are the nozzle exit diameter 3.5mm, the nominal spray angle 70
degrees, the inlet diameter 3.7mm and the nominal flow rate at 3.0 bar gauge
pressure is 3.90 litre per minute as shown in Table
1. Figure 2 shows schematic drawings of
the atomizers that will produce a conical spray pattern at 900 with
respect to feed pipe axis [14]. Figure .2 shows the different distances from the
nozzle tip for liquid sprays. The readings were taken only when the sprays were
fully developed. The vertical and horizontal intervals between the measurement
points were 20 and 5mm respectively.
The test liquid used for the spray experiment was soft tap water. The test liquid property parameters are presented in Table 2.
Table
1:
Physical parameters of the nozzle
|
Material |
Nozzle
length L (mm) |
Height
H (mm) |
Nozzle exit diameter (mm) |
Liquid
inlet diameter (mm) |
|
Stainless
steel |
34 |
24 |
3.5 |
3.7 |
Table 2: Test
liquid properties
|
Property |
Mass
density |
Viscosity |
Surface
tension |
|
Test
liquid (water) |
1000 |
0.001 |
0.072 |
|
Units |
kg/m3 |
kg/ms |
kg/s2 |
|
Symbol |
ρL |
µL |
σT |
|
Source |
Crowley
et al [15] |
Emekwuru et al [16] |
Emekwuru et al [16] |

Figure 2: Measurement points relative to the nozzle tip.
Table 3 Malvern analyzer system parameters [4]
|
Parameter |
Units |
Value |
|
Transmitting
optics setup |
||
|
Laser
power |
mW |
5 |
|
Beam
waist diameter |
Mm |
10 |
|
Laser
wavelength |
nm |
632.8 |
|
Path
length |
mm |
30 |
|
Receiving
optics setup |
||
|
Drop
size range mean diameter (D32) |
µm |
0.1-2500 |
|
Lens
focal length |
mm |
300 |
|
Particle
refractive index |
- |
1.334
(water) |
|
Medium
refractive index |
- |
1.000
(air) |
Measurements were conducted for only half portion of the sprays assuming that the sprays were almost symmetrical. In using the Spraytec, the liquid was sprayed at various flow rates and drop sizes measured. Since the flow rate supplied by the pump could not be directly controlled, the power supplied to the pump was controlled by varying the voltage instead. All samples were sprayed at voltages of (0.5, 1, 1.5, 2 and 2.5) V. The flow rate was measured by timing how much time 0.4ml takes to spray. The pressure drop measured by the transducer was also recorded in volts to be later converted to pressure units. Spraytec was operated at 2.5 kHz for 10s per measurement. The parameters used during the experiment for the Malvern Spraytec system are presented in Table 3.
Figs 3 and 4 show the uncorrected light
scattering data and alignment of the laser beam for corrections before
capturing the raw data. The Malvern Spraytec software
provides means for correction of the effects of multiple scattering during the
experiments. In cases where the particle concentration is high, the measurement
process is complicated by scattered light being re-scattered by other particles
before it reaches the detector. These multiple scattering errors are corrected
by a light scattering correction algorithm and the correction effects during
the experiments are seen in the smoother transmission signal curves in Fig 4 compared
to Fig. 3 [4]

Figure 3: Uncorrected light scattering data. On transmission signal scale 1000 represents 1mW

Figure
4:
Corrected light scattering data. On transmission signal scale 1000 represents
1mW
3. EXPERIMENTAL RESULTS AND DISCUSSION
This experimental study undertakes the measurements of the droplet Sauter Mean Diameter (SMD) at different axial distances for the hollow-cone nozzle and different radial distances from the spray centreline using a laser-diffraction-based drop size analyser (Malvern Spraytec) and also investigates the influence of injection pressure on the Sauter Mean Diameter (SMD). In addition, the geometrical exit orifice diameters of 3.5mm and 1.5mm of the nozzle on the Sauter Mean Diameter (SMD) are also analysed. The drop size distributions along the nozzle centreline 60, 80, 100 and 120mm as well as the radial drop distributions from spray centreline at 10, 15, 20, and 25mm are also discussed. The liquid film breakup as a function of the pressure differential is also presented. Figure 5 shows axial profiles of the arithmetic mean diameter d10, Sauter mean diameter, SMD d32, De Broukere diameter, d43 and mass median diameter (MMD) d50 evaluated at axial positions of y = 60, 80, 100, and 120 mm for injection pressure of 3.0 bars since measurements below 60 mm were liquid sheet. The diameters d10 and d50 correspond, respectively, to drop diameters that encompass 10% and 50% of the total volume of drops below the drop volume considered. It was observed that the characteristic drop sizes increase in the axial direction downstream of the nozzle. The arithmetic mean diameter d10 shows the least drop size and lower than the Sauter mean diameter d32 which is expected in most drop size distributions. De Broukere diameter, d43 records the highest drop size values. The Sauter mean diameter d32 which is described by Chin and Lefebvre [17] as the best measure of the fineness of sprays and mass median diameter d50 falls within this range with the Sauter mean diameter d32 far lower than the mass median diameter d50. The relative positions of the different diameters as shown in Figure 5 also conform to the observations made by Williams [18] where the Sauter mean diameter, d32 was measured to be 18 μm and the other diameters d10 and d50 were 5.5 μm and 24 μm respectively. In Figure 6 the influence of pressure on mean drop size d32 was analysed at the locations on the spray centreline. It is observed that an increase in the injection pressure of liquid leads to a decrease in SMDs on the spray centreline. This is due to the combined effect of stronger liquid sheet instability and the maximum growth of the surface wave as the pressure increases. This makes the liquid sheet breaks up more easily and produces smaller droplets. Figure 7 shows the results of Sauter Mean Diameter (SMD) at radial positions 10, 15, 20, and 25mm from the spray centreline for axial positions y = 60, 80, 100, and 120 mm from the nozzle exit at the injection pressure of 3.0 bars. It was found that the radial drop size profile from the spray centerline shows an increase in the drop sizes as the axial distance increases from the spray centreline. At 60 mm from the nozzle, however, the drop sizes are as high as 402µm. The radial variation of the drop sizes is found to be dependent on both the injection pressure conditions and the spray measurement positions. It is evident that the higher the injection pressures, the smaller the drop sizes. From this spray profile, it is also seen that larger sized drops occupy the spray periphery compared to those occupying the spray core. This is because they are less affected by the airflow entrained in the spray core that carries smaller drops.

Figure
5: Drop size
parameter profile along the spray centre line at
atomizing pressure of 3.0bars. The error bars indicate the standard
deviation of three measurements.

Figure 6: Sauter Mean Diameter (SMD) along the spray centre
line at two different injection pressures

Figure 7: Radial Sauter Mean diameter (SMD) at axial positions y=60, 80, 100 and
120 mm from the nozzle exit at injection pressure of 4.0 bars. The error bars
indicate the standard deviation of three measurements.

Figure 8: Effect of geometrical dimensions of the nozzle on the Sauter Mean Diameter (SMD)
The effect of nozzle exit orifices on the Sauter Mean Diameter (SMD) is shown in Figure 8 and it is noticed that the nozzle exit orifice diameters 3.5 mm and 1.5 mm for the big nozzle and small nozzle respectively have different SMD at the axial positions with small nozzle showing smaller SMDs than the big nozzle. Another significant observation is that break-up lengths are different for the two nozzles. It is also indicated that the 3.5 mm nozzle has droplet formation beyond 50mm and the 1.5mm orifice has droplet SMD measured above 30mm. Figures 9 and 10 present the results of the drop size distributions and size overlay at various axial distances of 60, 80, 100, and 120 mm from the nozzle exit with the injection pressure value of 3.5 bars. It is observed that an increase in droplet formation through the spray downstream distances causes an increase in the drag force on droplets, so the distribution curves of droplets’ size become more flat and its maximum value decreases and moves to bigger drop sizes. Hence, droplet size distributions become more homogenous. This could be explained by two primary processes. The first is the coalescence of the drops due to collisions. Small drops can merge to create larger droplets. The second reason is the ‘selection by drag’ process [6], [19]. Large droplets suffer less braking than the smaller drops and hence there is a tendency to have more of them downstream. There is also a possibility of smaller droplets positioned far away from the nozzle evaporating thus shifting the measured spectrum towards the larger droplets [20]. In Figure 11, it is seen that monomodal distributions have been observed and a lot of large-sized drops are present at the outer edges of the sprays. This happens because further downstream of the spray, larger drops experience less drag as the spray is more dilute and thus travels further outward.

Figure
9: Drop size distributions at axial distance
y= 60, 80, 100 and 120 mm


10 mm 15mm

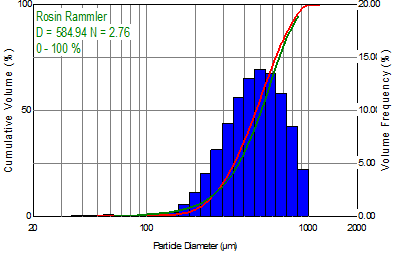
Figure 10: Drop size distributions for injection pressure of 3.5 bar at various
radial positions and 80 mm axial distance from exit orifice
The liquid film breakup as a function of the injection pressure was visualized in the short exposition time and results presented in Figure 11. It was observed that a smooth liquid film around a hollow core was formed immediately after the atomizer nozzle exit orifice, ending in a ragged edge, and after that, a well-defined hollow-cone spray was established. It could also be noticed from the Figures that the spray angle increases with the injection pressure and reduces the liquid film length.
|
2bar |
3bar |
|
4bar |
5bar |


4. CONCLUSION
Experimental measurements were conducted to obtain unique data for mean droplet size characteristics for atomization model validation. The findings showed some drop sizes were lower than the Sauter Mean Diameter d32 while others recorded the higher drop size values above SMDs measured in some axial distances consider in the spray centre line. The SMDs in the radial positions showed an increase in the drop sizes as the radial distance increases towards the periphery and the variation of injection pressure on the Sauter Mean Diameter (SMD) at the axial positions was found to have decreased with increasing pressure. The observations also showed that the nozzle with small orifice diameter exhibited smaller SMDs than the bigger nozzle and the liquid sheet lengths were different for the two nozzles with the length of the smaller one far below the big one.
SOURCES OF FUNDING
This research received no specific grant from any funding agency in the public, commercial, or not-for-profit sectors.
CONFLICT OF INTEREST
The author have declared that no competing interests exist.
ACKNOWLEDGMENT
None.
REFERENCES
[1] Wittig, S., et al., Optical measurements of droplet size distributions: Special considerations in the parameter definition for fuel atomizers. 1984, Karlsruhe Univ (Germany Fr) Inst Fuer Thermische Stroemungsmaschinen.
[2] Broniarz-Press, L., et al., The effect of orifice shape and the injection pressure on enhancement of the atomization process for pressure-swirl atomizers. Crop Protection, 2016. 82: p. 65-74.
[3] Lefebvre, A.H. and V.G. McDonell, Atomization and sprays. 2017: CRC press.
[4] Malvern-Instruments, Spraytec User Manual MAN0368. 2007, Issue.
[6] Emekwuru, N. and A.P. Watkins, Analysis of a two-fluid sprayer and its use to develop the number size distribution moments spray model, Part I: Experimental Analysis. Atomization and Sprays, 2010. 20(6).
[7] Lefebvre, A., Atomization and sprays. Vol. 1040. 1989: CRC press.
[8] Emekwuru, N.G. and P. Watkins, Statistical Experimental Analysis of a Two-Fluid Sprayer and Its Use to Develop the Number Size Distribution Moments Model of Sprays. 2007: University of Manchester.
[10] Chin, J.S., Nickolaus, D., and Lefebvre, A.H, Influence of Downstream Distance on the Spray Characteristics of Pressure-Swirl Atomizers. Journal of Engineering for Gas Turbines and Power, 1986. 108(1): p. 224-224.
[12] Hirleman, E.D., V. Oechsle, and N. Chigier, Response characteristics of laser diffraction particle size analyzers: optical sample volume extent and lens effects. Optical Engineering, 1984. 23(5): p. 235610-235610-.
[13] Dombrowski, N. and D. Hasson, The flow characteristics of swirl (centrifugal) spray pressure nozzles with low viscosity liquids. AIChE Journal, 1969. 15(4): p. 604-611.
[14] PNR UK, L., General Purpose Spray Nozzles, CTG UG20 BR. 6 July 2017.
[15] Crowley, J.M., G.S. Wright, and J.C. Chato, Selecting a working fluid to increase the efficiency and flow rate of an EHD pump. IEEE Transactions on Industry Applications, 1990. 26(1): p. 42-49.
[16] Emekwuru, N. and A.P. Watkins, Analysis of a two-fluid sprayer and its use to develop the number size distribution moments spray model, Part II: Computational Analysis. Atomization and Sprays, 2010. 20(8).
[20] Schürmann, P., Forsyth, J., Padrutt, R., and Heiniger, K. C., Spray characterization downstream of swirl pressure nozzle in gas turbine fogging and high fogging applications, in Power-Gen International, Power-Gen International Conf. and Exhibition. 2003, PennWell Corporation:Tulsa: Las Vegas, USA.
|
|
 This work is licensed under a: Creative Commons Attribution 4.0 International License
© IJOEST 2016-2020. All Rights Reserved.