BEARING CAPACITY ANALYSIS OF SUBSOILS, FOR SHALLOW AND DEEP FOUNDATION IN UYO TOWN, EASTERN NIGER DELTA, NIGERIA
Ehibor, Imo-Owo. U 1![]()
![]() ,
Tse, Akaha.C. 2
,
Tse, Akaha.C. 2![]()
1 Department of Geology, Faculty of Physical Sciences, Akwa Ibom State University, Ikot Akpaden, Mkpat Enin L.G.A, Akwa Ibom State, Nigeria
2 Department of Geology, Faculty of Sciences, University of Port Harcourt, Rivers State, Nigeria
|
|
|
ABSTRACT |
|
|
The
Geotechnical properties of soils in Uyo town were analyzed to determine the
bearing capacity and generate maps for shallow and deep foundation designs.
Eleven geotechnical boreholes were drilled to a maximum depth of 20 meters
each across Uyo town. Standard penetration tests and cone penetration tests
were also carried out on the field. Soil samples were retrieved during the
field investigation for various laboratory tests including liquid limits,
plastic limit, bulk density, shear strength and particle size distribution.
The general soil profile consists of silty clays, sandy clays, and sand from
top to bottom. The silty clays are firm, low compressibility clays with
liquid limit and plastic limit percentages between 32%-45% and 10%-45%
respectively, cohesion averages of 4˚ to 12˚ and angles of internal
friction between 48KN/m2-68KN/m2. Ultimate bearing capacities of this horizon
range from 354.6kN/m2 to 866.7kN/m2. The sandy clays are also firm, low to
intermediate plasticity clays with liquid limit and plasticity indexes of 29%
- 42% and 9%-15% respectively. Their cohesion averages range between
50KN/m2-65KN/m2 and angles of internal friction between 6˚-12˚. The
ultimate bearing capacities of this clay range from 482.5KN/m2 to 906.2KN/m2.
The sand is a poorly graded, medium dense sand with standard penetration test
N-values between 8 to 23. Pile bearing capacities of the sand gave ultimate
and allowable bearing capacities between 10262.9KN-11510.2KN and
4105.2KN-4604.1KN respectively. The sand substratum is a suitable termination
depth for piles. |
|||
|
Received 15 June 2022 Accepted 01 July 2022 Published 20 July 2022 Corresponding Author Ehibor,
Imo-Owo U., imohuyanga@gmail.com DOI 10.29121/IJOEST.v6.i4.2022.359 Funding: This research
received no specific grant from any funding agency in the public, commercial,
or not-for-profit sectors. Copyright: © 2022 The
Author(s). This work is licensed under a Creative Commons
Attribution 4.0 International License. With the
license CC-BY, authors retain the copyright, allowing anyone to download,
reuse, re-print, modify, distribute, and/or copy their contribution. The work
must be properly attributed to its author.
|
|||
|
Keywords: Bearing Capacity Analysis, Shallow Foundation,
Deep Foundation, Bearing Capacity Maps, Geotechnical Maps |
|||
1. INTRODUCTION
Engineering structures consist of a super-structure and substructure. The substructure (foundation) transmits the weight of the structure and the superimposed loads to the underlying foundation material which may be a soil or rock Krynine and Judd (2003) The type and quality of foundation material underlying a structure is very important because it determines to a large extent, the safety of the structure. The underlying earth material supporting the structure must not be over-stressed; this is the main concern in the design of foundations, in order to prevent the failure of the foundation Akpokodje (2001) Although, the exact cause of foundation failure which may vary from overloading of soils, poor construction practices and poor choice of construction materials still remains unknown, the ultimate goal in foundation analysis is the design of a safe and economic foundation for structures. Sub surface knowledge that assist in the proper design of structures are usually provided via foundation studies Warmate and Nwankwoala (2018). Thus, the geotechnical index and mechanical properties of earth materials, as well as the bearing capacity of the soil must be understood for an appropriate design of foundations. Several studies on foundation properties of soils in the Niger delta include among others, Teme (2002) Tse and Akpokodje (2010) Atat et al. (2013) Ngah and Nwankwoala (2013) Warmate and Nwankwoala (2018) Abija et al. (2018) Ehibor et al. (2019) and Abija et al. (2018) This study therefore determines the bearing capacity of sub soils in Uyo town and develops maps for shallow and deep foundations designs. The benefits derivable from this study include an understanding of the bearing capacity of subsoils in Ayo town and the design of bearing capacity maps and other geotechnical maps which may serve as field models for foundation purposes.
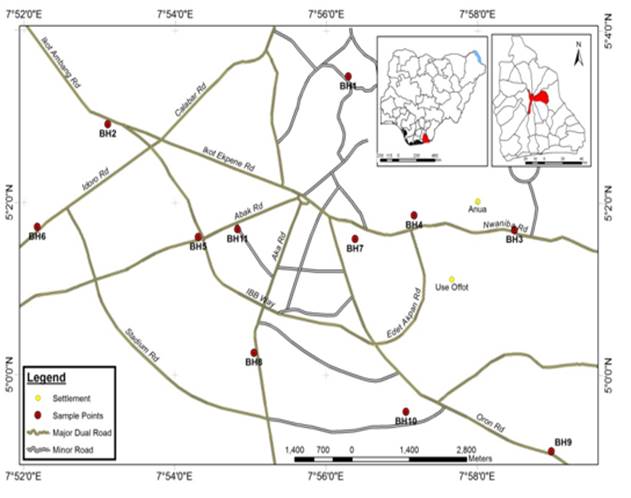
1.1. DESCRIPTION OF STUDY AREA
Uyo town is located in the central part of Akwa Ibom state, southeastern Niger Delta. (Figure 1). It lies on the flat to gently undulating sandy plains, stone hills, and ravines. This intensely dissected region contains gullies, ravines, and valleys. Geomorphologically, Akwa Ibom state is generally a flat, low-lying terrain and riverine the environment that is divided into two major geomorphic regions, these are the North and North-Easternly intensely dissected regions and the Southern plain coastal regions. The major relief can be further divided into six sub-geomorphic units as follows: the Atlantic Ocean shoreline and beach, Mangrove swamps and flood plains with recent alluvial sediments, Beach ridge sands, Flat to gently undulating sandy plains, Sandstone hills, ridges, steep sided valley, and ravines and finally, the Obotme upland areas. Usoro (2010) The land rises steadily upwards from the sea level at Eket in the south to 150m at Obotme in the north Beka and Udom (2014) Uyo town is drained by the Ikpa river that flows from the North to the Southern part of the town through many tributaries that emerge from ravines. Four main stratigraphic units ranging from Maastrichian to Pleistocene in age are recognised in Akwa Ibom state namely: the Shale-Limestone facies (late cretaceous and early Eocene) which is the oldest geological facie in Akwa Ibom state, the Sand-Gravel facies (Oligocene-Pleistocene), the younger Benin formation Coastal plain sand (Pliocene-Pleistocene) and the Beach ridge complex and Alluvial deposits (recent). The younger Benin coastal plain sand underlies the flat lying plains of Uyo, Ikot Ekpene, Etinan, Ikot Abasi and terminates in the coastal brackish water, swamp zone with fringing Beach ridge complexes lying southwards Peters (1989)
Figure 1
|
Figure 1 Borehole Locations, Uyo Town,
Akwa Ibom State |
2. METHOD
2.1. FIELD STUDY
A total of eleven boreholes were drilled in different locations across Uyo town to depths of 20 meters each, using the shell and auger percussion drilling rig. The percussion drilling method was used because of the lithology of the study area which consisted mainly of clay, sand and the presence of few gravels, the depth to which the soil samples were taken and the ease of the soil returning to its original state once the casings have been removed. Disturbed soil samples were collected at regular intervals of 1metres each, while Undisturbed soil samples were retrieved from the cohesive soil strata in the borehole. The soil samples collected were classified on the field before transporting them to the laboratory for further analysis.
2.1.1. Standard Penetration Test
Standard penetration tests were performed at 18 meters depth on the cohesionless soils to determine the penetration resistance (N-Value) of the soil. The field standard penetration test N-values were corrected to account for the overburden pressure and dilatancy in saturated fine sands and silts.
2.1.2. Cone Penetration Tests
The cone penetration test was performed using a 2.5-ton CPT machine, in order to ascertain the resistance of the soil, thus estimating its bearing capacity.
2.2. LABORATORY STUDY
Each of the soil samples taken from the field were subjected to various engineering geological tests in accordance with procedures specified by British Standard BS 1377 (1990). The tests include natural moisture content, atterberg limits, undrained Shear strength, particle Size distribution analysis (dry sieve method), bulk density and consolidation (oedometer) test.
3. DATA ANALYSIS
To calculate the bearing capacity of the subsoil, the results of the following properties of the soil were analysed:
1) The Standard Penetration Test N 1-value
2) The Bulk density
3) The unit cohesion
Bearing Capacity Analysis for deep foundation design (SPT method)
Field standard penetration test N-values were corrected using the formula
N1 = 15 + ½ (N – 15) (1)
N1 – corrected field standard penetration Test N-value
N – Field standard penetration test N-value from 300mm penetration.
The bulk density and standard penetration Test N1 –values were used to determine the bearing capacities for deep foundation designs.
3.1. Pile Capacity Analysis
The bearing capacity of piles for deep foundation was determined using the methods of Peck, Hanson and Thornburn (1974), Teezaghi (1960) and Berezantev (1961). The general equation for the total load on the pile Q can be expressed as:
Qult (KN) = Qb + Qs (2)
Where;
Qult (KN) = Ultimate bearing capacity of soil
Qb (KN) = Base resistance (offered by the soil)
Qs (KN) = Shaft resistance (offered by the shear stresses between the soil and the shaft)
For the ultimate base resistance in sand:
Qb (KN) = Abase + q0 Nq (3)
Where;
Abase (m2) = Base area of pile (πdl2/4)
d(mm) = Diameter of pile (306mm steel piles)
q0 (KN/m2) = Effective overburden pressure (g x h) (4)
h(m) = Thickness of strata
g (KN/m3) = Unit weight (pwet x g)/100 (5)
rwet (Kg/m3) =Bulk density
g(m/s2) = Acceleration due to gravity (9.81)
Nq = A bearing capacity coefficient which depends on the angle of internal friction (Ø)
For the ultimate shaft resistance in sand.
Qs (KN) = Ashaft. Ks. q0/2. tan δ (6)
Where;
Ashaft (m2) = Area of Shaft (πdl) (7)
π = 3.142
d(mm) = Diameter of pile (306 for steel piles)
L(m) = Length of pile
Ks (N/m2) = Earth pressure coefficient which depends on the type of pile used (0.75 for steel piles)
q0/2 (KN/m2) = Average effective overburden pressure over soil layer (g x h)/2 (8)
Tan δ = Angle of pile friction (200 for steel piles)
For the safe Axial pile capacity of the soil:
Qallow. (KN) = Qb +Qs/F. S (9)
Qallow. = Safe Axial pile capacity of soil
Qb = Base resistance
Qs = Shaft resistance
F.S = Factor of safety (2.5)
Terzaghi (1943) bearing capacity equation for shallow foundation (Strip footing)
qd= cNc + gDfNq + ½( gBNg) (10)
qd (kN/m2) = ultimate bearing capacity
c= unit cohesion
g (KN/m3) = effective unit weight of soil
B= width of footing (600mm for concrete strip foundation)
Df (m) = depth of foundation
Nc, Nq and Ng = bearing capacity factors which are a function of Ø
4. RESULTS AND DISCUSSIONS
4.1. SOIL STRATIFICATION
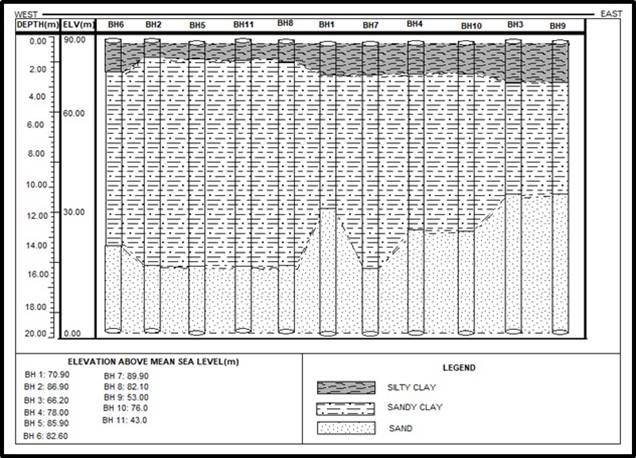
The general soil profile in Uyo town, may be categorized into three recognizable subsoil layers; the layers are composed of a dark brown, Silty-Clay, a light brown Sandy-Clay, and a light brown fine to medium to coarse Sand. These three layers of soil types occur in varying proportions, as shown in Figure 2 .
Figure 2
|
Figure 2 General Soil Profile in Uyo Town,
Akwa Ibom State |
4.2. ENGINEERING PROPERTIES
4.2.1 Clay horizon I
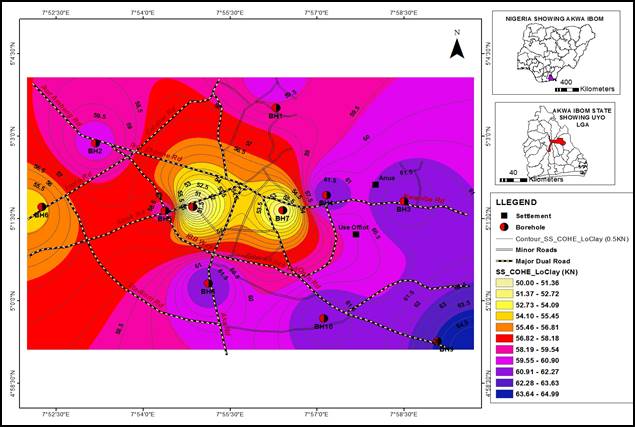
This upper clay horizon, which is made up of a dark brown, soft to firm silty clay, with an average thickness of 3m forms the topsoil in all the boreholes. Engineering properties of this horizon are presented in Table 1. All the clay are of low compressibility, firm and low to intermediate plasticity (CL - CI), (Figure 3) Ehibor et al. (2019). The mineralogical composition of the clay reveal, kaolinite constitutes an average of 13.25% of the whole rock mineral, quartz 86.6% and goethite 0.1% Ehibor et al. (2019) Bearing capacity analysis of this clay layer at a depth of 1.5meters using the method of Terzaghi (1943) for shallow foundation design (Strip footing) gave ultimate bearing capacity values ranging between 354.6 kN/m2 in borehole 11 to 866.7 kN/m2 in borehole 8 as shown on the bearing capacity map in Figure 7.
Figure 3
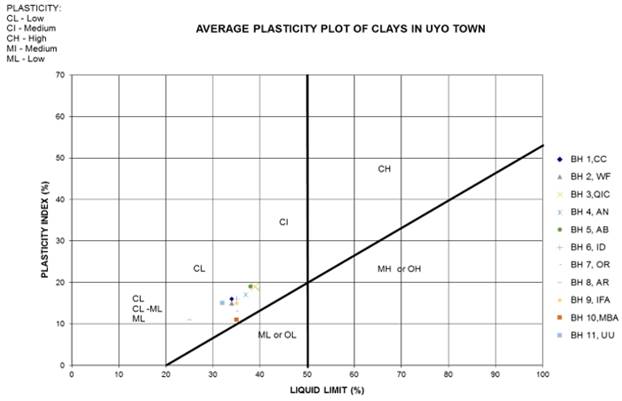
Figure 3 Typical Plasticity Plot of Clay in Uyo Town |
Figure 4

|
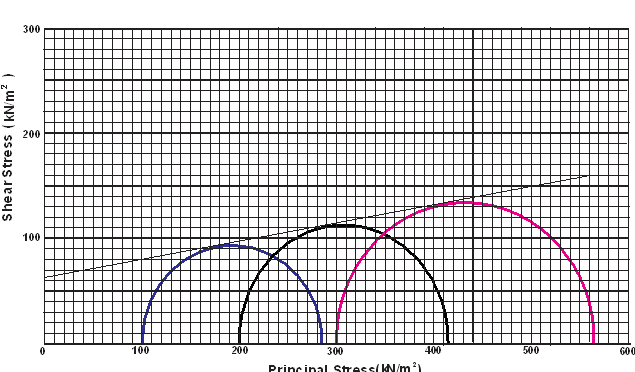
Figure
4 Mohr Circle and
Envelope, Upper Clays |
Table 1
|
Table 1 Engineering properties of the upper clay horizon Ehibor et al. (2019) |
|||||||||||
|
Borehole (BH) |
1 |
2 |
3 |
4 |
5 |
6 |
7 |
8 |
9 |
10 |
11 |
|
Location |
C.C.C |
West |
Q.I.C |
Anua |
Abak |
Idoro |
Oron |
Aka |
Ifa |
Mbab |
Udo |
|
Ikpa |
Itam |
Church |
Road |
Road |
Road |
Road |
Road |
Atai |
Anya |
Uman |
|
|
Longitude |
N050 311 |
N050 251 |
N050141 |
N050 241 |
N050 141 |
N050 141 |
N050 121 |
N050 021 |
N050 591 |
N050 591 |
N050 011 |
|
Latitude |
E0070
561 |
E0070
531 |
E0070
581 |
E0070
581 |
E0070
541 |
E0070
521 |
E0070
561 |
E0070
541 |
E0070
591 |
E0070
581 |
E0070
551 |
|
WT (m) |
12.8 |
16.7 |
13.6 |
13 |
15.4 |
16.6 |
16.9 |
16.6 |
15.8 |
15.5 |
15.3 |
|
Depth(m) |
0-2 |
0-1 |
0-3 |
0-2 |
0-1 |
0-2 |
0-2 |
0-1 |
0-3 |
0-2 |
0-1 |
|
Wn (%) |
24 |
25 |
25 |
25 |
24 |
26 |
23 |
26 |
26 |
22 |
26 |
|
LL
(%) |
35 |
34 |
45 |
39 |
36 |
35 |
38 |
32 |
35 |
34 |
34 |
|
PL (%) |
18 |
18 |
27 |
26 |
18 |
16 |
25 |
10 |
19 |
25 |
16 |
|
PI
(%) |
12 |
15 |
18 |
17 |
18 |
18 |
13 |
12 |
15 |
13 |
17 |
|
USCS |
CL |
CL |
CI |
CI |
CI |
CI |
CI |
CL |
CI |
CL |
CL |
|
Fines
(%) |
40 |
40 |
40 |
32 |
32 |
22 |
30 |
42 |
30 |
36 |
28 |
|
C(KN/m2) |
62 |
60 |
62 |
61 |
60 |
60 |
56 |
68 |
50 |
65 |
48 |
|
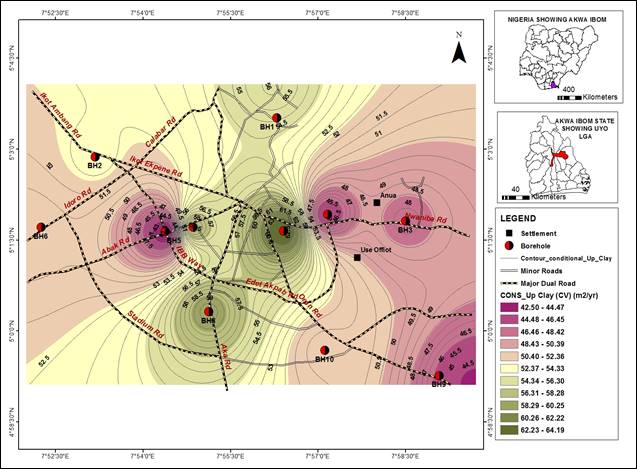
CV(m2/yr.) |
56.1 |
52.7 |
47.8 |
45 |
42.5 |
51 |
64.2 |
59.3 |
44.2 |
51.2 |
58.4 |
|
MV (m2/M |
0.21 |
0.15 |
0.22 |
0.2 |
0.17 |
0.12 |
0.23 |
0.19 |
0.16 |
0.19 |
0.18 |
|
g (KN/m2) |
20.8 |
20.9 |
21.6 |
21.4 |
20.9 |
20.6 |
20.1 |
21 |
19.7 |
21.2 |
19.7 |
|
Ø (˚) |
10 |
11 |
11 |
10 |
9 |
7 |
12 |
12 |
4 |
11 |
5 |
|
qd
(kN/m2) |
715 |
708.5 |
706.2 |
680 |
592.3 |
535.6 |
677.3 |
866.7 |
354.6 |
760 |
388.9 |
|
qa (KN/m2) |
286.0 |
283.4 |
282.5 |
272 |
236.9 |
214.2 |
271 |
346.7 |
141.8 |
304 |
154 |
|
Wn= Natural moisture content
LL= Liquid limit PL= Plastic limit C=Cohesion Ø=Frictional angle g (KN/m2) = Unit
weight qd (kN/m2)
Ultimate bearing capacity |
|||||||||||
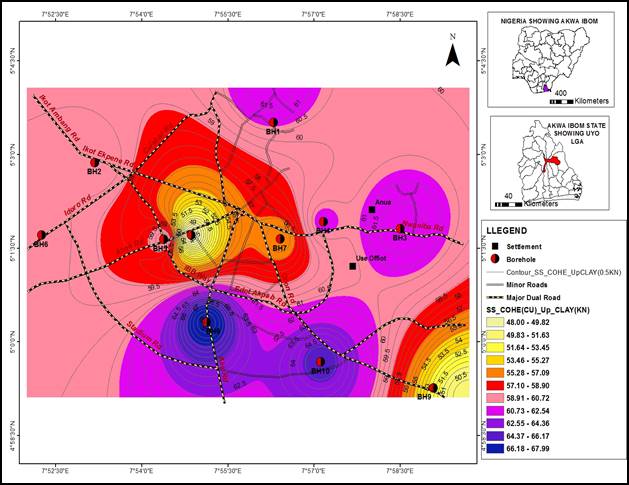
Figure 5
|
Figure
5 Shear Strength
Map for Upper Clay Layer |
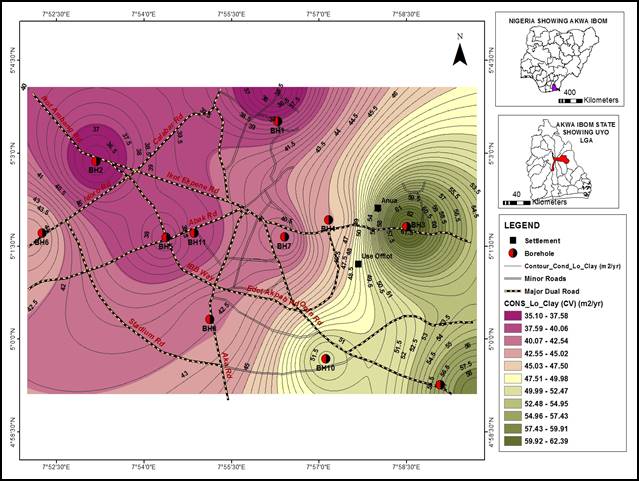
Figure 6
|
Figure
6 Consolidation
Map for Upper Clay Layer |
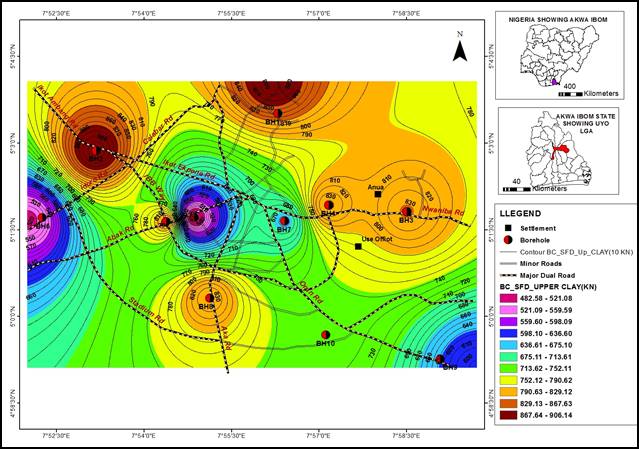
Figure 7
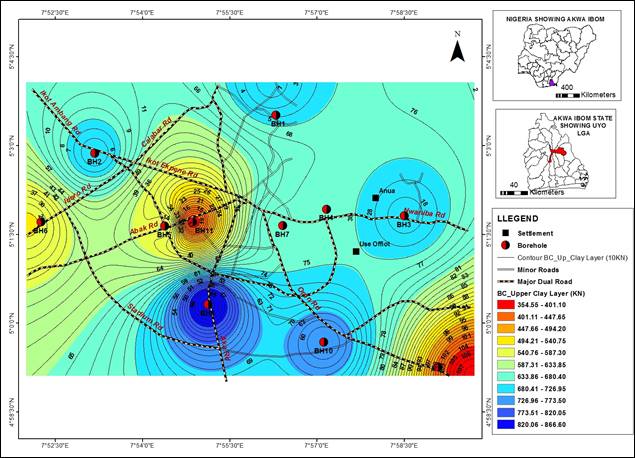
|
Figure 7 Bearing Capacity Map for Shallow
Foundation Design in Upper Clay Layer, Uyo Town |
4.2.2. Clay horizon II
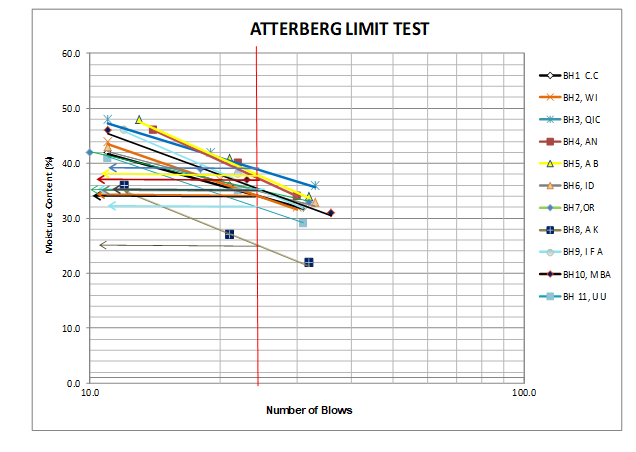
A light brown, firm sandy-clay with an average thickness of about 14m generally underlies the upper clay horizon in all the boreholes and is firmer in consistency The engineering properties in Table 2, reveal all the clay in this horizon are low to intermediate /plasticity clays (Figure 3) Ehibor and Akpokodje, 2019. Bearing capacity analysis of this clay layer at a depth of 6 meters using the method of Terzaghi (1943) for Strip footing gave ultimate bearing capacity values ranging between 482.5 kN/m2 in borehole 11 to 906.2 kN/m2 in borehole 2 as shown on the bearing capacity map in Figure 12
Figure 8
|
Figure
8 Typical Liquid
limit plot of Clay in Uyo Town |
Table 2
|
Table
2 Engineering properties of the Lower clay horizon Ehibor et al. (2019) |
|||||||||||
|
Borehole No |
1 |
2 |
3 |
4 |
5 |
6 |
7 |
8 |
9 |
10 |
11 |
|
Depth (m) |
10-Feb |
15-Jan |
11-Mar |
15-Feb |
15-Jan |
14-Feb |
15-Feb |
15-Jan |
11-Mar |
13-Feb |
15-Jan |
|
Wn
(%) |
22 |
23 |
24 |
23 |
24 |
23 |
18 |
24 |
23 |
23 |
20 |
|
LL (%) |
35 |
29 |
43 |
37 |
42 |
34 |
33 |
31 |
34 |
31 |
31 |
|
PL
(%) |
15 |
17 |
25 |
20 |
23 |
15 |
18 |
20 |
16 |
22 |
15 |
|
PI (%) |
15 |
12 |
19 |
17 |
19 |
16 |
12 |
9 |
13 |
9 |
15 |
|
USCS |
CL |
CL |
CI |
CI |
CI |
CL |
CL |
CL |
CL |
CL |
CL |
|
Fines (%) |
40 |
35 |
40 |
38 |
42 |
24 |
32 |
36 |
27 |
40 |
22 |
|
C(KN/m2) |
60 |
60 |
62 |
62 |
59 |
55 |
52 |
62 |
65 |
62 |
50 |
|
CV(m2/yr) |
35.1 |
36.1 |
62.4 |
46 |
37.5 |
77.4 |
40 |
42.5 |
58.4 |
51.6 |
39.1 |
|
MV
(m2/M |
0.23 |
0.21 |
0.18 |
0.21 |
0.19 |
0.09 |
0.17 |
0.17 |
0.18 |
0.55 |
0.11 |
|
g (KN/m2) |
20.2 |
20.7 |
21.1 |
21.2 |
20.4 |
20.3 |
19.4 |
21.1 |
20.6 |
20.6 |
19.9 |
|
Ø
(˚) |
11 |
11 |
10 |
10 |
12 |
6 |
11 |
10 |
6 |
9 |
6 |
|
qd (kN/m2) |
898.8 |
906.2 |
830.1 |
831.8 |
817.1 |
531.2 |
677.3 |
830.7 |
598.7 |
745.5 |
482.5 |
|
qa
(kN/m2) |
360.0 |
362.5 |
332 |
332.7 |
327 |
212.5 |
271 |
332.3 |
239.5 |
298.2 |
193 |
|
CV= Coefficient of
consolidation MV(m2/MN) =
Coefficient of volume compressibility qd (kN/m2)
Ultimate bearing capacity qa (kN/m2)
Allowable bearing capacity |
|||||||||||
Figure 9
|
Figure
9 Mohr Circles and Envelope, Lower Clays |
Figure 10
|
Figure
10 Shear Strength
Map for Lower Clay Layer |
Figure 11
|
Figure
11 Variation of
Coefficient of Consolidation Lower Clay Layer |
Figure 12
|
Figure 12 Bearing Capacity Map for Shallow Foundation Design in Lower Clay
Layer, Uyo Town |
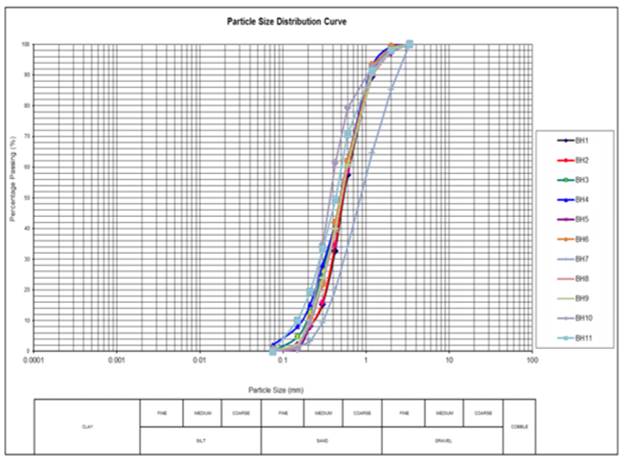
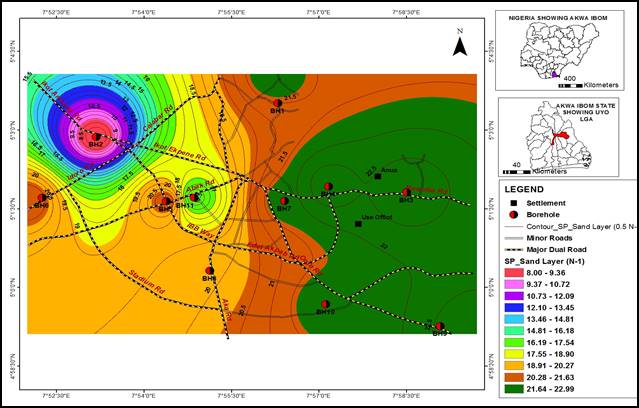
4.2.3. Sand horizon
This horizon consists of a fine to medium to coarse, light brown, sand fraction Figure 13 about 10m thick generally underlying the silty sandy, light brown, clay. This poorly graded sand with a predominance of the medium sand fraction, is of medium density Table 3.
Analysis of the bearing capacity of the sand for pile design, at a depth of 18 meters using the methods of Peck, Hanson and Thornburn (1974), Teezaghi (1960) gave ultimate bearing capacities between 10262.9 KN and 11510.2 KN Figure 15 and allowable bearing capacities between 4105.2KN and 4604.1KN Table 4
Figure 13
|
Figure 13 Typical Particle size distribution
plots of the sand |
Table 3
|
Table
3 Engineering properties of the sand horizon Ehibor et al. (2019) |
|||||||||||
|
Borehole No |
1 |
2 |
3 |
4 |
5 |
6 |
7 |
8 |
9 |
10 |
11 |
|
Depth(m) min |
10 |
15 |
11 |
13 |
14 |
14 |
15 |
15 |
11 |
14 |
15 |
|
Depth(m) max |
20 |
20 |
20 |
20 |
20 |
20 |
20 |
20 |
20 |
20 |
20 |
|
% Fine sand |
3.5 |
4.5 |
8.5 |
5.5 |
4.5 |
8.5 |
1.5 |
7.5 |
12 |
8 |
11 |
|
%Med sand |
54 |
52 |
52 |
53 |
30 |
61 |
17 |
72 |
44 |
72 |
51 |
|
% Coarse sand |
41 |
41 |
39 |
40 |
51 |
28 |
51 |
19 |
44 |
72 |
58 |
|
% Gravel |
2 |
2.5 |
1.5 |
2 |
0 |
1 |
0 |
2 |
2 |
2 |
2 |
|
D10 |
0.26 |
0.25 |
0.21 |
0.23 |
0.3 |
0.23 |
0.31 |
0.21 |
0.25 |
0.23 |
0.23 |
|
D50 |
0.51 |
0.52 |
0.49 |
0.51 |
0.89 |
0.39 |
0.85 |
0.36 |
0.6 |
0.37 |
0.52 |
|
D60 |
0.61 |
0.61 |
0.59 |
0.24 |
1.18 |
0.59 |
1.2 |
0.41 |
0.7 |
0.42 |
0.63 |
|
CU |
2.4 |
2.5 |
1 |
2.7 |
3.9 |
2.7 |
3.9 |
1.9 |
3.1 |
1.8 |
2.1 |
|
USCS |
SP |
SP |
SP |
SP |
SP |
SP |
SP |
SP |
SP |
SP |
SP |
|
SPT N-Value |
22 |
8 |
23 |
23 |
21 |
21 |
22 |
20 |
23 |
22 |
19 |
|
SPT NI-Value |
19 |
12 |
19 |
19 |
18 |
18 |
19 |
18 |
19 |
19 |
17 |
|
Unit Weight |
144.2 |
140.3 |
142.2 |
140.3 |
142.2 |
144.2 |
142.2 |
140.3 |
142.2 |
140.3 |
142.2 |
|
D10=
Effective particle size D50= Mean
particle size CU= Coefficient of
uniformity SPT
N-Value = Standard Penetration test N-Value
Unit Weight (KN/m3)
SPT
NI-Value = Standard Penetration test corrected N-Value |
|||||||||||
Table 4
|
Table 4 Pile Bearing Capacity of the sand horizon |
||||||
|
BoreHole (BH) No |
Depth (m) |
Qult (KN) |
Qallow (KN) |
|
Qult (KN) |
Qallow (KN) |
|
1 |
18 |
11510.2 |
4604.1 |
|
11510.2 |
4604.1 |
|
2 |
18 |
10262.9 |
4105.2 |
|
10262.9 |
4105.2 |
|
3 |
18 |
11353.9 |
4541.6 |
|
11353.9 |
4541.6 |
|
4 |
18 |
11197.2 |
4478.9 |
|
9494.4 |
3797.8 |
|
5 |
18 |
11353.9 |
4541.6 |
|
11353.9 |
4541.6 |
|
6 |
18 |
11510.2 |
4604.1 |
|
11510.2 |
4604.1 |
|
7 |
18 |
11428.1 |
4571.2 |
|
11428.1 |
4571.2 |
|
8 |
18 |
11197.2 |
4478.9 |
|
11197.2 |
4478.9 |
|
9 |
18 |
11353.5 |
4541.4 |
|
11353.5 |
4541.4 |
|
I0 |
18 |
11197.2 |
4478.9 |
|
11197.2 |
4478.9 |
|
11 |
18 |
11353.5 |
4541.4 |
|
11353.5 |
4541.4 |
Figure 14
|
Figure
14 Standard
Penetration Test Map for Sand Layers, Uyo Tow |
Figure 15
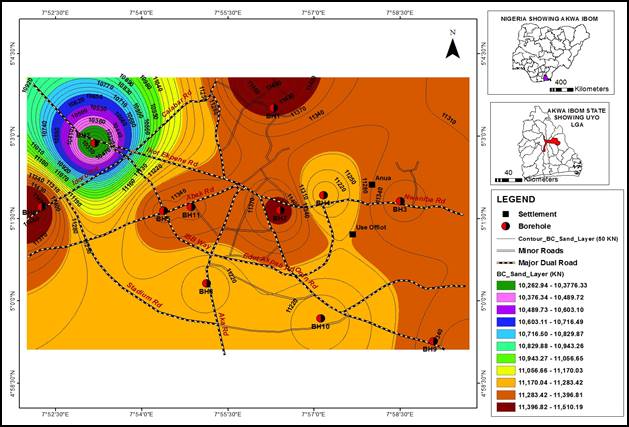
|
Figure 15 Bearing Capacity Map for Sand Layer in
Uyo Town |
5. Conclusion
The sub soils in Uyo town were analysed to determine their bearing capacity and generate maps for shallow and deep foundation designs. The general soil stratification of Uyo town is made up of silty clays, sandy clays, and sand. The ultimate bearing capacities of the silty clays are between 354.6 KN/m2 and 866.7KN/m2 and the sandy clays between 482.5 KN/m2 and 906.2KN/m2. The medium dense sands have ultimate and allowable pile bearing capacity averages of 10886.6KN and 4354.7kN respectively. The medium dense sand substratum is an adequate termination depth for piles and appropriate for engineering structures.
REFERENCES
Abija, F.A, Teme, S.C And Oborie, E. (2018). Geotechnical Considerations for the Design And Construction of Foundations in a Marshy Stream Channel of Iwochang- Ibeno, Eastern Niger Delta, Nigeria. Journal of Civil, Construction and Environmental Engineering. 3 (6), 154-170.
Akpokodje, E. G. (2001). Introduction to Engineering Geology. Pam Unique Publishing Co. Ltd. Port Harcourt. 150.
Atat, J.G, Akpabio, I.O And George, N. J. (2013). Allowable Bearing Capacity for Shallow Foundation in Eket Local Government Area, Akwa Ibom State, Southern Nigeria. International Journal of Geosciences. 4, 1491-1500. https://doi.org/10.4236/ijg.2013.410146.
Beka, J. E. And Udom, G. J (2014). Quality Status of Groundwater in Akwa Ibom State, Nigeria. International Journal of Science Inventions Today. 3 (5) 436-449.
Ehibor, I. U., Akpokodje, E. G And Tse, A. C. (2019). Geotechnical Properties Of Clay Soils In Uyo Town, Eastern Niger Delta, Nigeria. International Organization Of Scientific Research (IOSR), Journal Of Applied Geology And Geophysics. 7 (3)8-16.
Krynine, D. P. And Judd, W. R. (2003). Principles Of Engineering Geology And Geotechnics. CBS Publishers And Distributors, New Delhi. 3.
Ngah, S.A And Nwankwoala, H.O. (2013). E Valuation Of Sub-Soil Geotechnical Properties for Shallow Foundation Design in Onne, Rivers State, Nigeria. The International Journal of Engineering and Sciences (IJES) 2(11) 8-16
Peck, R. B., Hanson, H.E and Thornburn, T.H. (1974). Foundation Engineering John Wiley and Sons, Inc., New York.
Peters, S. W. (1989). Geology Of Akwa Ibom State in Akwa Ibom State- Physical Backgrounds, Soils, Land Use And Ecological Problems. 83-140.
Teezaghi, K (1960). Theoretical Soil Mechanics. John Wiley And Sons Inc. 280.
Teme, S.C. (2002). Geotechnical Consideration on Foundation Design in the Niger Delta, Paper Presented at Special Technical Session, 39th Annual International Conference of the NMGS, PH Nigeria. 51.
Terzaghi, K. (1943). Theoretical Soil Mechanics. John Wiley And Sons New York. https://doi.org/10.1002/9780470172766
Tse A.C and Akpokodje, E.G. (2010). Subsurface Soil Profiles in Site Investigation Profile in Site Investigation For Foundation Purposes in Parts of the Mangrove Swamps of the Eastern Niger Delta," Journal Of Minning And Geology, Vol. 46, 79-92.
Usoro, E. J. (2010). "Relief", Akwa Ibom State A Geographical Perspective. A Special Publication of The Department of Geography and Regional Planning, University of Uyo, Nigeria. 16-19.
Warmate, T and Nwankwoala, H.O. (2018). Geotechnical Indications and Shallow Bearing Capacity Analysis Within Lekki Pennisula, Lagos Using Direct Shear Analysis.Int.Arch.Env.Sci,IAEES-104 https://doi.org/10.33552/CTCSE.2019.01.000516
 This work is licensed under a: Creative Commons Attribution 4.0 International License
© Granthaalayah 2014-2022. All Rights Reserved.