STOCK PRICE PREDICTION USING SUPPORT VECTOR REGRESSION AND K-NEAREST NEIGHBORS: A COMPARISON
Ghosh Madhumita 1![]() , Ravi Gor 2
, Ravi Gor 2![]()
1 Research Scholar, Department of Mathematics, Gujarat University, Ahmedabad, India
2 Department of Mathematics, Gujarat University, Ahmedabad, India
|
|
|
ABSTRACT |
|
|
Supervised
Learning is an important type of Machine learning. It includes regression and
classification problems. In Supervised learning, Support Vector Machine (SVM)
and K-Nearest Neighbors (KNN) can be used for classification and regression.
Here, both algorithms are used for regression problem. The stock data is
trained by SVR and KNN respectively to predict the stock price of the next
day using python tool. Both algorithms are compared, and it is observed that
the price predicted by SVR is closer as compared to KNN. |
|||
|
Received 10 May 2022 Accepted 16 June 2022 Published 04 July 2022 Corresponding Author Ghosh
Madhumita, DOI 10.29121/IJOEST.v6.i4.2022.354 Funding: This research
received no specific grant from any funding agency in the public, commercial,
or not-for-profit sectors. Copyright: © 2022 The
Author(s). This work is licensed under a Creative Commons
Attribution 4.0 International License. With the
license CC-BY, authors retain the copyright, allowing anyone to download,
reuse, re-print, modify, distribute, and/or copy their contribution. The work
must be properly attributed to its author.
|
|||
|
Keywords: Supervised
Learning, Support Vector Regression (SVR), K-Nearest Neighbors (KNN), Stock
Market |
|||
1. INTRODUCTION
Financial market is a marketplace where people, traders, companies buy and sell assets like shares, bonds, derivatives, foreign exchange, commodities, and other products. These markets give opportunities to make money but also include risk. corporatefinanceinstitute (n.d.)
Stock price prediction is one of the most difficult acts in finance. Many factors affect the stock price prediction like physical, physiological behavioural factors etc. These things make share price volatile, so it is very difficult to predict with high degree of accuracy. Nowadays machine learning techniques are widely used to predict the future stock prices. Analyticsvidhya (n.d.)
Machine learning techniques can be applied in many fields like medicine, financial market, insurance sector etc. One of the most popular applications of these techniques is to forecast time series data Towardsdatascience (n.d.) Machine learning techniques reshape the financial services Algorithmxlab (n.d.) It makes the financial market better than ever.
With the help of machine learning algorithms, trader can take better trading decisions Datarevenue (n.d.) The mathematical model monitors news and trading results in a timely manner and detects whether the stock price will go up or down and predicts whether to sell, hold or buy the stock.
Different kinds of machine learning algorithm are used to predict future stock price in stock market data. In machine learning algorithms, regression algorithms like Logistic Regression, Linear Regression, Support Vector Regression, K-Nearest Neighbors etc. are used to predict the stock price.
2. LITERATURE REVIEW
Sahoo and Charlapally (2015) predicted stock prices applying auto regressive model. They used Moore and Penrose technique to estimate the coefficients of regression equation. They studied the effectiveness of auto regressive model and compared the accuracy of predicted values with actual values. Sahoo and Charlapally (2015)
Shakhla et al. (2018) analysed historical data to predict stock’s daily high price with the help of Multiple Linear Regression technique. They used the stock’s open and the market’s open price as a dependent variable. They applied Root Mean Squared Error technique to measure the differences between values predicted by model and the actual values. Shakhla et al. (2018)
Seethalakshmi (2018) applied Linear Regression model to predict the closing price of stock. First, he includes open, low, high, volume, adjclose attributes and obtained the closing price then includes open, low, high attributes and obtained the closing price. He calculated the r2 value for both cases. From this value he concluded that the close price was not affected by the adjclose. Only open, high, low and the volume itself were sufficient to find the approximate price forecast. Seethalakshmi (2018)
Gururaj et al. (2019) used Linear Regression (LR) and Support Vector Machine (SVM) algorithms to predict the stock price. They compared both the algorithms and concluded that SVM performs better than LR. They also explained advantages and disadvantages of SVM and LR. Gururaj et al. (2019)
Samruddhi and Kumar (2020) applied K-Nearest Neighbor (KNN) regression algorithm to predict the price of cars. The model was trained with data of used cars. They used 85% of data for training and 15% of data for testing. They concluded that the model gives 85% accuracy with K-values of 4. Samruddhi and Kumar (2020)
Bhavsar and Gor (2022) predicted restaurant ratings with the help of Machine Learning Model. Information such as Restaurant id, Country, categories for dining, cost, currency, online delivery option, aggregate rating, rating, votes were provided to the Artificial Neural Network model. The ratings were classified in 5 different categories form poor to Excellent. Results of three different optimizers Adam, Adamax and Nadam were compared, where Nadam shows best accuracy. Bhavsar and Gor (2022) Ghosh and Gor (2022)
Ghosh and Gor (2022) proposed Bidirectional Gated Recurrent Unit (BIGRU) and Genetic Deep Neural Network (GDNN) algorithm for customer churn prediction. The sparse dataset of telecom company was collected for churn prediction. The number of parameters was reduced to decrease computational cost. The results obtained by Bidirectional Gated Recurrent Unit and Genetic Deep Neural Network were compared with Artificial Neural Network. Both the model performed well but the F1 score and recall value is high for BIGRU as compared to GDNN which shows better performance of BIGRU algorithm. Ghosh and Gor (2022)
Ghosh and Gor (2022) used Gated Recurrent Unit (GRU) model for stock price prediction for different social media companies. Also, Grid search technique was used for different hyperparameter selection such as number of hidden layers, number of neurons, batch size and dropout. The obtained datasets were pre-processed, cleaned, and scaled. Adam optimizer was used for the backpropagation of the GRU model. The optimized hyperparameter values were applied on all dataset and result shows that model with hyperparameter tuning performed better. Ghosh and Gor (2022)
3. METHODOLOGY
The data has been collected from Yahoo Finance of Google stock for the period of 4 years from 1-09-2016 to 28-08-2019. The data is given in Table 1
Table 1
|
Table 1 Google stock price data |
|||||||
|
Date |
Open |
High |
Low |
Close |
Adj Close |
Volume |
|
|
0 |
2016-09-01 |
769.250000 |
771.020020 |
764.299988 |
768.780029 |
768.780029 |
925100 |
|
1 |
2016-09-02 |
773.010010 |
773.919983 |
768.409973 |
771.460022 |
771.460022 |
1072700 |
|
2 |
2016-09-06 |
773.450012 |
782.000000 |
771.000000 |
780.080017 |
780.080017 |
1442800 |
|
3 |
2016-09-07 |
780.000000 |
782.729980 |
776.200012 |
780.349976 |
780.349976 |
893700 |
|
4 |
2016-09-08 |
778.590027 |
780.349976 |
773.580017 |
775.320007 |
775320007 |
1270300 |
|
5 |
2016-09-09 |
770.099976 |
773.244995 |
759.659973 |
759.659973 |
759.659973 |
1885500 |
|
6 |
2016-09-12 |
755.130005 |
770.289978 |
754.000000 |
769.020020 |
769.020020 |
1311000 |
|
7 |
2016-09-13 |
764.479980 |
766.219971 |
755.799988 |
759.690002 |
759.690002 |
1395000 |
|
8 |
2016-09-14 |
759.609985 |
767.679993 |
759.109985 |
762.489990 |
762.489990 |
1087400 |
|
9 |
2016-09-15 |
762.890015 |
773.799988 |
759.960022 |
771.760010 |
771.760010 |
1305100 |
|
10 |
2016-09-16 |
769.750000 |
769.750000 |
764.659973 |
768.88005 |
768.880005 |
2049300 |
|
11 |
2016-09-19 |
772.419983 |
774.000000 |
764.440979 |
765.700012 |
765.700012 |
1172800 |
Two different algorithms Support Vector Regression (SVR) and K-Nearest Neighbors (KNN) as explained below are used to predict future closing price and results are compared.
SVR algorithm: Mohammadreza and Hamidreza (2019) Adaptive Motion Compensation in Radiotherapy, 2011)
Vapnik (1995) invented the support vector machine (SVM) as a machine learning algorithm for classification problems. SVM was then upgraded to support vector regression (SVR) by incorporating a new form of loss function known as the ϵ-insensitive loss function, which penalises data as long as they are greater than ϵ. In a high-dimensional feature space, SVR is a non-linear kernel-based regression method that gives the optimal regression hyperplane with the lowest structural risk. Mohammadreza and Hamidreza (2019)
In this method,
![]() is a training dataset, where
is a training dataset, where ![]() is input data,
is input data, ![]() is the output value of the i-th data point in
the dataset, d is the dimension of samples and n is the number of samples. The
SVR function is
is the output value of the i-th data point in
the dataset, d is the dimension of samples and n is the number of samples. The
SVR function is
![]() (1)
(1)
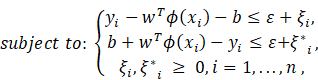
where ϕ denotes the non-linear mapping from the input space to the feature space, w is a vector of weight coefficients and b is a bias constant. The w and b are estimated by minimizing the following optimization problem: Mohammadreza and Hamidreza (2019)
![]() ,
,
![]() (2)
(2)
Here, ![]() and
and
![]() _i
are slack variables introduced to cope with training data possibly violating
the condition
_i
are slack variables introduced to cope with training data possibly violating
the condition ![]() .
.
![]()
 (3)
(3)
where C is a constant known as the penalty factor, ε
is the insensitive loss parameter and the slack variables ![]() ,〖
,〖![]() measure the amount of difference between the
estimated value and the target value beyond
measure the amount of difference between the
estimated value and the target value beyond ![]() .
.
Now, formulate the Lagrange function using the Lagrange
multipliers ![]() ,
,
![]()
![]() and
and ![]()
![]() (4)
(4)
Differentiating the Lagrangian with respect to the primal variables
![]() ,
,
![]() ,
, ![]() and
and
![]() have
to vanish at optimality.
have
to vanish at optimality.
By substituting the value of primal variables into (4) and we subsequently arrive at the dual optimization problem
![]()
Subject
to: ![]() and
and ![]() ,
, ![]() (5)
(5)
Now, introduce a kernel function ![]()
The kernelized SVR function
![]()
Where ![]() ,
,
![]() are
nonzero Lagrangian multipliers and
are
nonzero Lagrangian multipliers and ![]() is the kernel function.
is the kernel function.
Here, SVR algorithm with three kernels is used for prediction and three different values are obtained, respectively.
·
Linear kernel: ![]()
It is a special case of kernel function, with few parameters and fast speed.
·
Polynomial kernel: ![]() where
where ![]() = degree of kernel &
= degree of kernel & ![]() = constant term.
= constant term.
In the polynomial kernel, dot product by increasing the power of kernel is calculated.
·
Radial basis function kernel (RBF): ![]() ;
where
;
where ![]() = Euclidean distance between
= Euclidean distance between ![]() &
& ![]() and
and ![]() is the RBF width parameter.
is the RBF width parameter.
The dot product of ![]() &
& ![]() are
calculated by using distance in the original space.
are
calculated by using distance in the original space.
KNN algorithm: Sadegh and Mohammad (2013) Julius and Seng (2019)
Here, KNN can be used for regression because the dataset is given with continuous target value,
· The distance between new data points and each training point is calculated by Euclidean distance formula.
Euclidean Distance: Euclidean distance is calculated as the square root of the sum of the squared differences between a new point and an existing point.
![]()
Where, ![]() is existing point (predictor variables) and
is existing point (predictor variables) and ![]() is new point
is new point
· The nearest data points from the training dataset are selected.
· The average of these data points is calculated.

![]() =
ith case of the sample
=
ith case of the sample
![]() = prediction (outcome)
= prediction (outcome)
![]() = number of neighbors
= number of neighbors
These models predict stock price on day-to-day basis. 80% of data from 1-09-2016 to 24-01-2019 is used for training and 20% of data from 25-01-2019 to 28-08-2019 is used for testing purpose. Thus, the future closing price 30-08-2019 is predicted with the help of training and testing data.
Consequently, the error between actual price and predicted price for both the model is calculated by Root Mean Square Error (RMSE) method. Also, accuracy of models has been calculated. Prices predicted by SVR and KNN are given in Table 3, Table 2
Table 2
|
Table 2 Testing data prices obtained by SVR |
||
|
Date |
Actual Close Price |
Predicted Close Price |
|
28-12-2018 |
1033.09 |
1037.05 |
|
9/1/2019 |
1066.4 |
1067.65 |
|
8/8/2018 |
1238 |
1236.48 |
|
12/12/2016 |
787.09 |
788.75 |
|
7/7/2017 |
908.84 |
908.17 |
Table 3
|
Table 3 Testing data prices obtained by KNN |
||
|
Date |
Actual Close Price |
Predicted Close Price |
|
28-12-2018 |
1033.09 |
1037.05 |
|
9/1/2019 |
1066.4 |
1067.65 |
|
8/8/2018 |
1238 |
1236.48 |
|
12/12/2016 |
787.09 |
788.75 |
|
7/7/2017 |
908.84 |
908.17 |
Error and accuracy of SVR model are as follow:
· Root Mean Square Error: 12.458238688132804
· Accuracy on Testing Data: 99.5707802870455
Error and accuracy of KNN model are as follow:
· Root Mean Square Error: 12.458238688132804
· Accuracy on Testing Data: 99.3749834768394
After training and testing the data, future price of 30-08-2019 is predicted. It is given in Table 4
Table 4
|
Table 4 Actual price and Predicted price of 30-08-2019 |
||||
|
Actual price |
Predicted price |
|||
|
SVR Linear kernel |
SVR Polynomial kernel |
SVR RBF kernel |
KNN |
|
|
1188.1 |
1035.41 |
1048.08 |
1048.77 |
1047.02 |
The result shows that predicted price of 30-08-2019 and actual price of 30-08-2019 are nearly close.
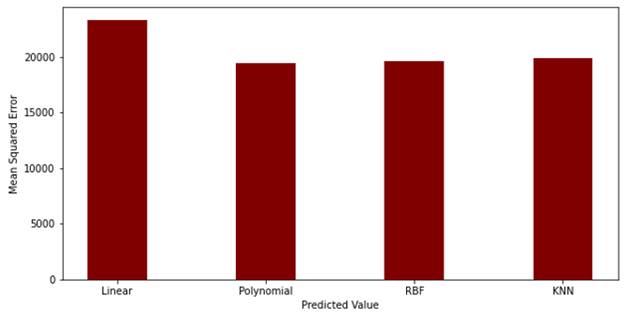
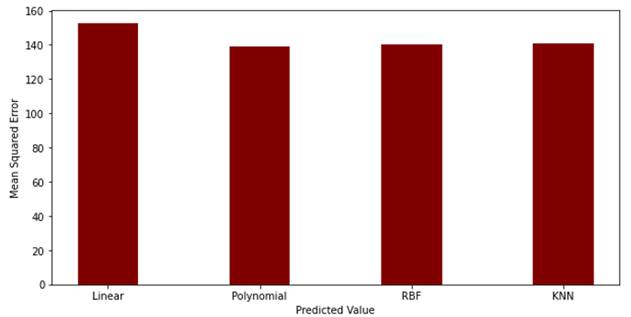
Moreover, the comparison between the above two models has been done through Mean Squared Error and Mean Absolute Error which is given in Table 5
Table 5
|
Table 5 Mean Squared Error and Mean Absolute Error |
||
|
Model |
Mean Squared Error |
Mean Absolute Error |
|
SVR (Linear kernel) |
23314.236 |
152.68 |
|
SVR (polynomial kernel) |
19412.849 |
139.32 |
|
SVR (RBF kernel) |
19605.6 |
140.01 |
|
KNN |
19903.566 |
141.07 |
Also, comparison of SVR and KNN is shown in Figure 1, Figure 2
Figure 1
|
Figure 1 Mean Squared Error graph |
Figure 2
|
Figure 2 Mean Absolute Error graph |
4. CONCLUSION
The future price of 30-08-2019 is obtained by SVR algorithm using three kernels. Out of these the future price predicted by RBF kernel is much closer to the actual price for the chosen data. Thus, RBF kernel proves to be the best kernel in comparison of the other two. Hence, among the two different algorithms SVR and KNN, SVR gives permissive result.
In future, this type of time series problems can be solved with other supervised learning technique.
CONFLICT OF INTERESTS
None.
ACKNOWLEDGMENTS
None.
REFERENCES
Bhavsar, S. & Gor, R. (2022). Stock Price Prediction using Grid Hyper parameter Tuning in Gated Recurrent Unit (In Press). International Journal of Engineering Science Technologies (IJOEST).
Corporatefinanceinstitute. (n.d.).
Ghosh, M. & Gor, R. (2022). Short Message Service Classifier Application using Naïve Bayes algorithm. International Organization of Scientific Research Journal of Computer Engineering (IOSR-JCE).
Gururaj, V. Shriya, V. & Ashwini, K. (2019). Stock Market Prediction using Linear Regression and Support Vector Machines. International Journal of Applied Engineering Research, 14(8), 1931-1934.
Julius, T. & Seng, H. (2019). LQ45 Stock Index Prediction using k-Nearest Neighbors Regression. International Journal of Recent Technology and Engineering (IJRTE), 8(3).
Martin, J. M. (2012). Adaptive Motion Compensation in Radiotherapy. CRC Press.
Mohammadreza, G. & Hamidreza, A. (2019). Forecasting Stock Market with Support Vector Regression and Butterfly Optimization Algorithm. Elsevier, 1-11.
Sadegh, B. I. & Mohammad, B. (2013). Application of K-Nearest Neighbor (KNN) Approach for Predicting Economic Events : Theoretical Background. International Journal of Engineering Research and Applications, 3(5), 605-610.
Sahoo, P. & Charlapally, K. (2015). Stock Price Prediction Using Regression Analysis. International Journal of Scientific & Engineering Research, 6(3), 1855-1859.
Samruddhi, K. & Kumar, R. (2020). Used Car Price Prediction using K-Nearest Neighbor Based Model. International Journal of Innovative Research in Applied Sciences and Engineering, 4(3), 686-689.
Seethalakshmi, R. (2018). Analysis of stock market predictor variables using Linear Regression. International Journal of Pure and Applied Mathematics, 199(15), 369-378.
Shakhla, S. Shah, B. Unadkat, V. Kanani, P. & Shah, N. (2018). Stock Price Trend Prediction Using Multiple Linear Regression. International Journal of Engineering Science Invention, 7(10), 29-33.
Singh, A. (2018). A Practical Introduction to K-Nearest Neighbors Algorithm for Regression (with Python code).
 This work is licensed under a: Creative Commons Attribution 4.0 International License
© Granthaalayah 2014-2022. All Rights Reserved.