PREDICTION OF DIABETES SCREENING BY USING DATA MINING ALGORITHMS1 Faculty of Engineering & Technology,Rift valley
university, Department of Computer science, P.O.Box 80734, Addis Ababa,
Ethiopia.
|
|
||
|
|
|||
|
Received 10 November 2021 Accepted 05 December 2021 Published 24 December 2021 Corresponding Author Aberham
Tadesse Zemedkun, abrehamt373@gmail.com DOI 10.29121/IJOEST.v5. i6.2021.253 Funding:
This
research received no specific grant from any funding agency in the public,
commercial, or not-for-profit sectors. Copyright:
© 2021
The Author(s). This is an open access article distributed under the terms of
the Creative Commons Attribution License, which permits unrestricted use, distribution,
and reproduction in any medium, provided the original author and source are
credited.
|
ABSTRACT |
|
|
|
Diabetes
is one of the most common non-communicable diseases in the world. Diabetes
affects the ability to produce the hormone insulin. Thus, complications may
occur if diabetes remains untreated and unidentified. That features a
significant contribution to increased morbidity, mortality, and admission
rates of patients in both developed and developing countries. When disease is
not detected early, it leads to complications. Medical records of the cases
were retrospective. Anthropometric and biochemical information was collected.
From this data, four ML classification algorithms, including Decision Tree
(J48), Naive-Bayes, PART rule induction, and JRIP, were used to prognosticate
diabetes. Precision, recall, F-Measure, Receiver Operating Characteristics (ROC)
scores, and the confusion matrix were calculated to determine the performance
of the various algorithms. The performance was also measured by sensitivity
and specificity. They have high classification accuracy and are generally
comparable in predicting diabetes and free diabetes patients. Among the
selected algorithms tested, the Decision Tree Classifier (J48) algorithm
scored the highest accuracy and was the best predictor, with a classification
accuracy of 92.74%. |
|
||
|
Keywords: Diabetes, Data Mining, ML, J48, PART, JRIP, Naïve Bayes 1. INTRODUCTION Diabetes mellitus (DM)
is a syndrome characterized by chronic hyperglycaemia, due to an absolute or
relative deficiency of circulating insulin Ahmed et al. (2012). There are three
main types of diabetes: Type 1, Type 2 & Gestational diabetes. People
with type 1 diabetes produce very little or no insulin at all and it is
called insulin- dependent. Type 2 diabetes used to be called
non-insulin-dependent diabetes or adult-onset diabetes, and accounts for at
least 90% of all cases of diabetes. Gestational diabetes mellitus (GDM) is a
type of diabetes characterized by high blood glucose levels during pregnancy Williams (2020) . As a result, the figure
is expected to rise to 366 million by 2030.DM is the commonest of all
metabolic diseases everywhere on the planet Gao and Qiao (2012). The burden of
diabetes is increasing worldwide, including in developing countries like
Ethiopia. The International Diabetes Federation Association reported Ethiopia
to be ranked 3rd in Africa with 1.4 million DM and a prevalence of 3.32 by
the year 2012 Kumar and D. G. R (2016). Diabetes
affects all segments of the population, regardless of age and sex Eapen (2004) Diabetes of all
kinds can cause complications that will increase the general risk of dying
prematurely. Possible complications include attacks, strokes, renal failure,
leg amputations, vision loss, and nerve damage. Poorly |
|
||
controlled diabetes in pregnancy
increases the danger of fetal death and other complications Dowling and Yap
(2014).
Early-stage
diagnosis Diabetes mellitus may present with characteristic symptoms such as
thirst, polyuria, blurring of vision, and weight loss in the absence of
effective treatment; in the most severe forms, ketoacidosis or a non-kenotic
hyperosmolar state may develop and cause stupor, and, in the absence of
effective treatment, death Hauner and
Scherbaum (2002).
2. STATEMENT OF THE PROBLEM
Diabetes
mellitus is a global public health issue that contributes significantly to
heart disease, stroke, chronic kidney failure, leg amputation, foot ulcer,
nerve damage, and eye damage. Ethiopia ranks first among the top four African
countries, with 2.6 million people. This is due to number of factors, such as
lack of awareness, limitation in screening protocols, less propaganda for
intervention programs, globalization, rapid adaptation to western lifestyle,
unhealthy eating habits like skipping the breakfast (or) eating junk foods
because of financial hardships, and poor accessibility to health care services
(scarcity of specialists, practitioners, health facilities, less expenditure)
on diabetes or free diabetes in Ethiopia.
Diabetes
prevalence is rising at an alarming rate. According to WHO fact shit, 77% of
individuals with diabetes sleep in low- and middle-income countries, making
socially disadvantaged countries the most vulnerable to diabetes
disease-related complications. Developing countries, the human and financial
costs of diabetes management are high and escalating from time to time.
According
to the literature, detecting diabetes's 80% disease progression is based on
clinical suspicion and is confirmed by performing a laboratory assessment of
the patient's blood sample's oral glucose or sugar level. These methods aren't
feasible for screening, because they require skilled manpower and are time
consuming, making them not accessible to all segments of the population.
According to CSA data from 1997, 84% of people in the country live in the
country, and health institutions are heavily concentrated in the city's core.
On the other hand, the current health care setup is a busy outpatient setting.
The shortage of highly trained health care providers is an acute problem in
Ethiopia. Today, this ultimately raises the cost of patient health care service
for treating non-communicable diseases like diabetic patients and improves the
standard of care Dagnew (2021).
3. RELATED WORK AND
LITERATE REVIEW
In an
investigation directed by Y, Hongmei, three strategies for data mining were the
examination portrayed the advancement of a clinical choice organization to
anticipate the presence of myocardial infraction during an associate of 4,770
patients giving intense agony at two college emergency clinics and four local
area hospitals. The clinical choice organization had comparative affectability
(88.0% versus 87.8%) yet a significantly higher specificity (74% versus 71%) in
foreseeing the shortfall of myocardial infarction in contrast with physicians'
choices if the patients needed to be conceded to the coronary consideration
unit. In the event that the choice to concede depended entirely on the choice
organization, the affirmation of patients without dead tissue to the coronary
consideration unit would be diminished by 11.5% without antagonistically
influencing patient results or the nature of care Yan et al. (2006) .
Beck,
Huain, and Y. huajo concentrated on diabetes-related difficulty avoidance.
Around 30 to 80 % of type 2 diabetic cases stay undiscovered. It is proposed
that information be prepared, utilizing decision trees, type 2, with various
levels of pervasiveness within the limelight. It has been perceived by an
asymptomatic stage between the beginning of diabetic hyperglycemia and clinical
conclusion within 4–7 years. During the information collection period from 2009
to 2011, techniques for gathering information from guests were regarded as a
risk factor. The attribute selected individual and epidemiological linkage when
patient status in light of the hour of visit facility. of choice quality are
heftiness or overweight, history of diabetes in first-degree relationships,
hypertension in pregnancy, privies history of gestational diabetes, history of
early termination, stillbirth, and birth of a baby under 4 kg, and foundation
of patient and epidemiological information. Features include age, sex, history
of diabetes, and weight loss plan (BMI). The examiner utilized the procedure of
J48 Algorithm to build up the decision tree in WEKA (3.9.5 version). The degree
of model checked accuracy and precision of the model was 71.7 and 97.6 %,
separately. The specialist reasoned that the created model utilizing the
decision tree for the screening of T2DM does not need lab tests for analysis Habibi et al. (2015).
Razak
and Bakar have led investigations that have some expertise in mining
affiliation rules from asthma patients' profile datasets. The purpose of the
examination is to identify ascribed factors that influence asthma patients. The
asthma patient profile dataset during this investigation comprises of 16,384
records and 118 factors in several organizations. These attributions are
assembled into segment attribute and asthma-related attribute. The mining
strategy utilized includes an information readiness stage and an affiliation
rules mining stage. Understanding the personality of the dataset,
distinguishing information types and configurations, recognizing deficient
information, breaking down information conveyance, and discretizing information
are the many stages required to efficiently preprocess the information. Due to
information preprocessing and purging, just 31 attributes are left to urge
affiliation rules. The affiliation rules mining stage utilizes deduced
algorithms. Deciding, preparing, and testing datasets, deciding limit esteems,
mining affiliation rules, and affiliation rules examination are included during
the execution of quality mining Region (2017).
Zerihun (2017)
conducted a research study to develop a
predictive model for pre-diabetes screening by using processing technology from
Adare General Hospital 4529 diabetic instances with sixteen attributes at
Hawassa City in Ethiopia for the diagnosis of prediabetes yes or no. He focused
on the implementation of the J48 decision tree and PART to affect the problem.
The experiment results show that PART rules outperformed decision tree
classifiers with 96.9% accuracy.
Selam,
A led a task force on the measles outbreak in Ethiopia's various districts. The
philosophy for building a prescient model utilizing information handling
methods for this exploration was a cross-bred six-venture Cios KDP. It had six
fundamental advances. Model form by 13 selected attributes for creating a
foresight model. Examiner tests are directed by two arrangement algorithms, the
decision tree and the naive Bayes Models, which differ in the order of a few
flare-ups. The classifier has an affectability of 86.8%, indicating that the
model is capable of perceiving truth, and an explicitness of 99.7%. The next
analysis utilized 9 attribute and scored the simplest exactness of 93.31% with
a 70% split test alternative from the contrary trials. Examination number three
scored the principal precision with both test alternatives. The Chosen
algorithm suggests a district-based measles episode forecast SELAM (2012) .
The
Shegaw-led study Anagaw (2002) has some expertise within the
research on the expected appropriateness of data mining innovation to predict
child mortality based on side-by side comparison of local area-based
epidemiological datasets. The analyst utilized neural organization and
selection tree strategies. Assembling and testing the models utilizing the
neural organization approach, the least difficult model was distinguished for
the preparation it made by utilizing the default boundaries of 9 attributes.
This model had a precision pace of 93%. This classifier happened with an exactness
of 95% in preparing cases, and it accomplished 95% exactness in experiments.
Iyer and Sumbaly
(2015) have utilized two methods, to be
specific, the Decision Tree and Naive Bayes algorithms for the conclusion of
diabetes utilizing arrangement mining strategies from the University of
California, Irvine (UCI) Pima Indians diabetes data set of public establishments
of diabetes and stomach-related and kidney sicknesses, with 768 examples and
eight traits with class mark tried positive and tried negative. The trial
results show that the Naive Bayes calculation with 79.5652% precision
outperformed the Decision Tree (J48) exactness of 76.9565% by a rate split of
70:30.
4. METHODOLOGY
1)
Research Design
This
study follows an experimental research approach. This is because experiments
that will occur to extract results from real-world implementations will be, and
it is important to reiterate that all the experiments and results should be
reproducible. The CRISP-DM technique is followed to explore the utility of
knowledge mining in diabetes screening across all eligible groups. This model
was chosen since it exhibits all the benefits of the well-known and widely used
methodology called CRISP-DM and provides a more general, research-oriented
description James and
Sarvanakumar (2017).
2)
Data Collection Methods
The
first data was gathered by using interviews with domain experts, and therefore
the second data was gathered from different written documents, conference
articles, and journal publications. A dataset was collected from baseline
diabetic patients’ medical history using a secondary data collection method,
also referred to as the retrospective method Tella (2015)
.
3)
Evaluation
Evaluate
the performance and accuracy of the model created by the J48 decision tree,
Naive Bayes, JRIP, and PART rule induction. The methods' relevance was checked
using a confusion matrix, ROC curve, 10 folds cross validation, and a ready
dataset spited with 70% split for training and 30% for testing.
5. DATA
UNDERSTANDING AND PREPARATION
5.1. Handling Missing Value
There
were some missing values in the data collected for this research project, such
as the type of food typically consumed and the age of the patient. This is
often corrected by the time of the next visit, and a few of them, with the
assistance of the domain expert’s special sorts of diabetes support
characterization risk factor of the patient, in order that all the missing
values are crammed with the acceptable value.
|
Table 1 Attributes with missing values |
||
|
No |
Attribute |
Missed Values |
|
1 |
Pregnancies |
108 |
|
2 |
Glucose |
5 |
|
3 |
Blood
Pressure |
35 |
|
4 |
Skin Thickness |
216 |
|
5 |
Insulin |
354 |
|
6 |
BMI |
11 |
|
7 |
Cholesterol |
1 |
|
8 |
DBP |
18 |
5.2. Data Discretization
Interval
labels are often used to replace actual data values. For instance, smoothing
techniques, including binning and dividing value by hierarchal derived new
attribute construction, are the most commonly used ones. From the dataset, the
"AGE" and "BMI" attributes are continuous value changes to
discrete value thoughts in a discretized (binned) process Marzuki and Ahmad (2007). After completing the
discretization process, the distinct values of the age attribute were reduced
to 6 from 46 distinct values.
|
Table 2 Summary of Derived Attributed with Their Values |
||
|
No |
Original
Attributes |
New
value |
|
1 |
Age of participant |
0-34,35-43,
44-52,53-61,62-70, >71 |
|
2 |
Body mass index (BMI) |
BMI <=11.8 underweight,
BMI =11.8-22.36kg/m2 = Normal, BMI =23-33.6 g/m2= overweight,
BMI =34-44.7 kg/m2 = obese Class1, BMI =45-55.9 kg/m2= obese Class2, BMI >= 56 kg/m2 =
very obese. |
6. EXPERIMENTATION
AND RESULTS ANALYSIS
6.1. J48 Algorithm
Experiment
I
This
experiment was conducted under the 10-fold cross-validation test option with
default parameters of Weka and the algorithm generates a model as a decision
tree with 91 leaves and a size of 176. The correctly classified instances were
467, which means 63.88%, and the incorrectly classified instances were 264,
which means 36.11% of the total number of instances of 731, taking 0.01 seconds
to build the model.
|
Table 3 10-fold
test for J48 algorithm |
|||||
|
Algorithm |
Test
Option |
Precision |
Recall |
ROC
Area |
Class |
|
J48 |
10-fold |
52.20% |
51.40% |
59.40% |
Diabetes |
|
70.08% |
71.40% |
59.40% |
Free Diabetes |
||
Experiment
II
This
experiment was conducted using the percentage split test option to train and
test the classification model Eyasu et al.
(2020). Out of the 731 total records, 219
(70%) of the instances were used as a training dataset and the remaining 512
(30%) of the instances were used as a testing dataset. The J48 learning
algorithm scored an accuracy of 138 out of 219 total testing instances. 138
(63.01%) of them were classified correctly, and the remaining 81 (36.98%)
testing instances were incorrectly classified. The algorithm generates a model
as a discussion tree with 91 types of leaves and 176 sizes of the tree and
takes 0.06 seconds to build the model.
|
Table 4 70%
split test for J48 Classification algorithm |
|||||
|
Algorithm |
Test Option |
Precision |
Recall |
ROC Area |
Class |
|
Naïve Bayes |
70 % split |
51.20% |
50.60% |
59% |
Diabetes |
|
70.10% |
70.60% |
59% |
Free Diabetes |
||
To
conclude, the above two experiments, namely experiments I and II, were
performed in order to build the classification model using the J48
classification algorithm by applying k-fold cross validation and percentage
split methods, respectively, to the experiments Yu et al. (2004).
|
Table 5 Detailed Accuracy by Class for J48 classification
algorithm |
||||
|
Detailed
Accuracy by Class |
||||
|
J48 |
Precision |
Recall |
ROC Area |
Class |
|
92.40% |
88% |
96.80% |
Diabetes |
|
|
92.90% |
95.60% |
96.80% |
Free diabetes |
|
Confusion
matrix for J48 Algorithm
The
confusion matrix may be useful for analyzing how well the classifier can
recognize tuples of various classes. The two-way table's sensitivity (true
positive rate) is (243/ (243+33)) *100 = 88.04%, and the specificity (true
negative rate) of support vector machine experiments is (435/ (435+20)) *100 =
95.60%. The overall accuracy of this training algorithm was 91.82%, which is
significantly lower than the other two algorithms used in this study.
|
Table 6 Confusion Matrix for J48 Decision Tree algorithm |
||
|
Confusion
Matrix |
||
|
Diabetes |
Free diabetes |
Class |
|
243 |
33 |
Diabetes |
|
20 |
435 |
Free diabetes |
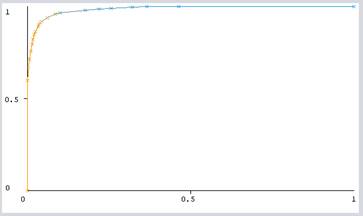
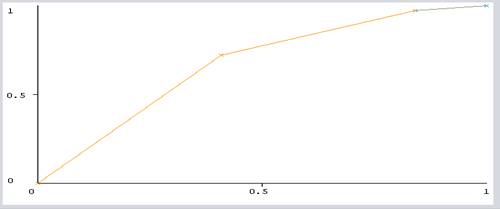
ROC
Analysis for J48 Algorithm
ROC
analysis provides tools to pick the simplest models and discard suboptimal
ones. Because of the cost-benefit analysis of diagnostic decision, ROC analysis
is said during a street. Figure 1 depicts the world under ROC for
diabetes screening cases. Out came that yes, gives the ROC accuracy of 98.45%
of algorithms selected from all 18 attributes
|
|
|
Figure 1 ROC curve of the J48
classification algorithm |
6.2. PART Algorithm
Experiment
I
This
experiment was conducted under the 10-fold cross-validation test option with
default parameters of WEKA and the algorithm generates a model as PART and
correctly classified instances are 458, which means 62.65 % and incorrectly
classified instances are 273, which means 37.34% of the total number of 731
instances and it takes 0.03 seconds to build the model.
|
Table 7 10-fold test for PART Classification algorithm |
|||||
|
Algorithm |
Test
Option |
Precision |
Recall |
ROC
Area |
Class |
|
PART |
10-fold |
50.60% |
49.30% |
63.30% |
Diabetes |
|
69.70% |
70.80% |
63.30% |
Free Diabetes |
||
Experiment
II
To
train and test the classification model, use the percentage split test option.
Out of the 731 total records, 219 (70%) of the instances were used as a
training dataset and the remaining 512 instances (30%) were used as a testing
dataset. The PART algorithm scored an accuracy of 133 out of a total of 219 testing
instances. 133 (60.73%) of them were classified correctly, and the remaining 86
(39.26%) testing instances were misclassified or incorrectly classified.
|
Table 8 70% split test for PART Classification algorithm |
|||||
|
Algorithm |
Test
Option |
Precision |
Recall |
ROC
Area |
Class |
|
Part |
70% split |
48.10% |
47.00% |
55.90% |
Diabetes |
|
70.04% |
69.10% |
55.90% |
Free Diabetes |
||
Experiment
I and Experiment II show the classification accuracy of the models based on the
above two methods, respectively. The first experiment was performed based on
the 10-fold cross validation method and classified with a 62.65% accuracy rate,
and the second experiment, performed based on a 70%:30% percentage split,
classified with a 60.83% accuracy rate.
|
Table 9 Detailed Accuracy by Class for PART algorithm |
||||
|
Detailed
Accuracy by Class |
||||
|
Part |
Precision |
Recall |
ROC Area |
Class |
|
97.00% |
81.50% |
97.20% |
Diabetes |
|
|
89.80% |
98.50% |
97.20% |
Free diabetes |
|
Confusion
matrix for PART algorithm
The
confusion matrix may be useful for analysing how well the classifier can
recognize tuples of various classes Kabakchieva (2016). The two-way table's sensitivity
(true positive rate) is (255/ (255+51)) *100 = 83.3%, and its specificity (true
negative rate) is (448/ (448+7)) *100 = 98.46%. The overall accuracy of this
training algorithm was 92.06%, which is significantly lower than the other two
algorithms used in this study.
|
Table 10 Confusion Matrix for PART algorithm |
||
|
Confusion
Matrix |
||
|
Diabetes |
Free diabetes |
Class |
|
255 |
51 |
Diabetes |
|
7 |
448 |
Free diabetes |
|
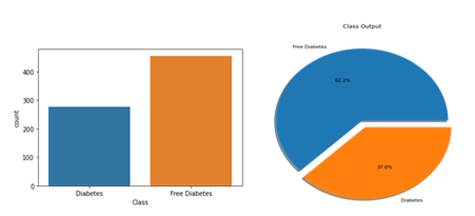
|
|
Figure 2 specifying
the number of people suffering by diabetes |
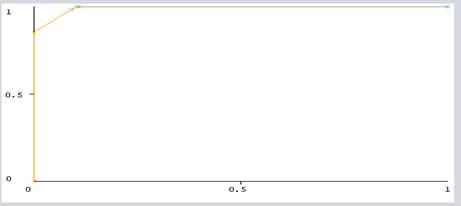
ROC
Analysis for PART Algorithm
ROC
analysis is directly related to measuring the cost-benefit analysis of
diagnostic PART Rule induction. Figure 3 shows the area under ROC for the prediabetes
screening instances. The ROC accuracy of algorithms selected from all
attributes is 99.22% when class value is yes.
|
|
|
Figure 3 ROC curve of the PART algorithm |
6.3. Naive Bayes Algorithm
Experiment
I
This
experiment was conducted under the 10-fold cross-validation test option with
default parameters of WEKA and the algorithm generates a model as Naive Bayes
and Correctly Classified Instances are 487, which means 66.21 % and Incorrectly
Classified Instances are 247, which means 37.78% of the total number of 731
instances.
|
Table 11 10-fold test for Naive Bayes classification
algorithm |
|||||
|
Algorithm |
Test
Option |
Precision |
Recall |
ROC
Area |
Class |
|
Naive Bayes |
10-fold |
56.60% |
45.30% |
66.20% |
Diabetes |
|
70.40% |
78.90% |
66.20% |
Free Diabetes |
||
Experiment
II
To
train and test the classification model, use the percentage split test option.
Out of the 731 total records, 219 (70%) of the instances were used as a
training dataset and the remaining 512 instances (30%) were used as a testing
dataset. The Naive Bayes learning algorithm scored an accuracy of out of a
total of 512 testing instances, 291 (56.83%) of them were classified correctly
and the remaining 221 (43.16%) testing instances were misclassified or
incorrectly classified.
|
Table 12 70% split for Naïve Bayes classification algorithm |
|||||
|
Algorithm |
Test
Option |
Precision |
Recall |
ROC
Area |
Class |
|
Naïve Bayes |
70% split |
49.30% |
43.40% |
64.80% |
Diabetes |
|
67.80% |
72.80% |
64.80% |
Free Diabetes |
||
Experiment
I and Experiment II show the classification accuracy of the models based on the
above two methods, respectively. The first experiment was performed based on
the 10-fold cross validation method and classified with a 62.21% accuracy rate,
and the second experiment, performed based on a 70%:30% percentage split,
classified with a 61.64% accuracy rate.
|
Table 13 Detailed Accuracy by Class for Naïve Bayes
algorithm |
||||
|
Detailed
Accuracy by Class |
||||
|
Naïve Bayes |
Precision |
Recall |
ROC Area |
Class |
|
59.70% |
47.80% |
70.30% |
Diabetes |
|
|
71.80% |
80.40% |
70.30% |
Free diabetes |
|
Confusion
matrix Naive Bayes Algorithm
The
two-way table's sensitivity (true positive rate) is (132/ (132+144)) *100 =
47.8%, and the specificity (true negative rate) of support vector machine
experiments is (336/ (336+89)) *100 = 79.05%. The overall accuracy of this
training algorithm was 68.12%.
|
Table 14 Confusion Matrix for Naïve Bayes Algorithm |
||
|
Confusion
Matrix |
||
|
Diabetes |
Free diabetes |
Class |
|
132 |
144 |
Diabetes |
|
89 |
336 |
Free diabetes |
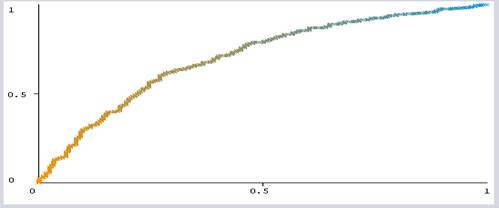
ROC
Analysis for Navies Bayes Algorithm
ROC
analysis is performed during a cost-benefit analysis of diagnostic decisions. Figure 4 shows the world under ROC for
diabetes screening instances. Class value of yes, gives the ROC accuracy of
70.31% of algorithms selected attributes.
|
|
|
Figure 4 ROC curve of the Navies Bayer’s
Algorithm |
6.4. JRIP Algorithm
Experiment
I
This
experiment was performed using the JRIP Rule induction algorithm with 10-fold
cross validation, and the outcome of this experiment is presented in Table 15 below.
|
Table 15 10-fold Cross Validation for JRIP algorithm |
|||||
|
Precision |
Recall |
ROC Area |
Class |
||
|
JRIP |
10-fold |
56.30% |
52.20% |
64.60% |
Diabetes |
|
72.40% |
75.40% |
64.60% |
Free Diabetes |
||
Experiment
II
The JRIP
algorithm scored an accuracy of out of a total of 219 testing instances, 147
(67.12%) of them were classified correctly and the remaining 72 (32.87%) were
incorrectly classified.
|
Table 16 70% split for JRIP classification algorithm |
|||||
|
Algorithm |
Test
Option |
Precision |
Recall |
ROC
Area |
Class |
|
JRIP |
70% split |
56.30% |
59.30% |
66.90% |
Diabetes |
|
74.20% |
72.10% |
66.90% |
Free Diabetes |
||
To
conclude, the above two experiments, namely experiments I and II, were performed
so as to build the classification model using the JRIP classification algorithm
by applying k-fold cross validation and percentage split methods, respectively,
to the experiments.
|
Table 17 Detailed Accuracy by Class for JRIP algorithm |
||||
|
Detailed
Accuracy by Class |
||||
|
JRIP |
Precision |
Recall |
ROC Area |
Class |
|
64.50% |
49.30% |
66.40% |
Diabetes |
|
|
73.10% |
83.50% |
66.40% |
Free diabetes |
|
Confusion Matrix for JRIP Algorithm
The
two-way table's sensitivity (true positive rate) is (136/ (136+140)) *100 =
49.27%, and the specificity (true negative rate) of support vector machine
experiments is (380/ (380+75)) *100 = 83.51%. The overall accuracy of this
training algorithm was 70.58%, which is significantly lower than the other two
algorithms used in this study.
|
Table 18 Confusion Matrix for JRIP Algorithm |
||
|
Confusion
Matrix |
||
|
Diabetes |
Free diabetes |
Class |
|
136 |
140 |
Diabetes |
|
75 |
380 |
Free diabetes |
ROC
Analysis for JRIP Algorithm
ROC
analysis is performed during a cost-benefit analysis of diagnostic decisions. Figure 5 depicts the world under ROC for
diabetes screening cases. Class value: yes, gives the ROC accuracy of 66.87% of
the selected attribute.
|
|
|
Figure 5 ROC curve of the JRIP Algorithm |
Comparison
among Classification Algorithms
One of
the aims of this research is to select a better classification Algorithm for
building a model that performs best in classification. Therefore, the below
table compares the output of all the four models supported by the accuracy of
the model, the time it took to build the model, the sensitivity classified
instances (Yes), and the insensitivity classified instances (No), supported by
the 10-fold cross-validation and 70% split test option.
|
Table 19 Comparison of 10-fold test and 70% split
test option |
||||
|
|
10-fold test option |
70% split test option |
||
|
Algorithm |
Correctly
classified |
Incorrectly
Classified |
Correctly
classified |
Incorrectly
Classified |
|
J48 |
62.51% |
37.48% |
61.64% |
38.35% |
|
Navies Bayer’s |
66.21% |
33.79% |
61.64% |
38.35% |
|
PART |
62.38% |
37.61% |
59.36% |
40.63% |
|
JRIP |
66.62% |
33.37% |
67.12% |
32.87% |
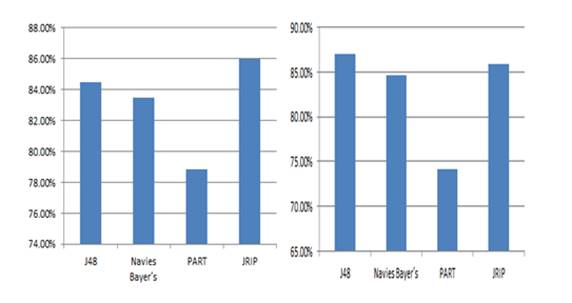
Among
the tested classification algorithms, the JRIP algorithm had the highest
accuracy of 67.12%. Accordingly, this algorithm was chosen for classifications
of diabetes risk.
|
|
|
Figure 6 Predicted
Accuracy of each 10-fold test and 70% split Algorithm |
7. DISCUSSION
RESULT ON THE MAJOR FINDINGS
For
this study, the algorithms were selected to test on the diabetic datasets in
order to generate rules, i.e., J48, PART, Navies Bayer’s and JRIP algorithms.
Therefore, analysing one by one and seeing the result that they performed
during the previous experiment has been tabularized accordingly.
The
J48 algorithm is the most accurate model among the others due to the results
that this algorithm demonstrated in terms of performance, time, labelling,
specificity, and confusion matrix. From the previous situation, the J48
algorithm had scored a time of 0.02 seconds to classify the 678 records
according to the class they belong to. Besides this, the model also showed good
performance more often than others. The ROC that this model displays is almost
identical to one that is 96.8 and the results of precision and recall (92.9%
and 95.6%) are also pretty much the same as the left model.
The second most performing model is the PART
Classier, or model which is the second one according to the above criteria for
performance. This model scored the highest accuracy (92.06%) on the general
data to classify the status of diabetic patient datasets. The time taken to
perform the general data by this algorithm is 0 seconds, as is the time taken
to classify the 673 instances of the records. The precision was 89.8%. and
recall (98.5%). This result is the most promising result next to the J48
algorithm by understanding the experiment result of the model.
The
third most performing model is the JRIP Algorithm model, which is the third one
according to the above criteria performance, which is almost very close to the
JRIP classifier. This model scored the highest accuracy (70.58%) on the general
data to classify the status of diabetic patient datasets. The time taken to
perform the general data by this algorithm is 0 seconds, as is the time taken
to classify the 516 instances of the records. The precision was 73.1%, and the
recall was 83.5%. This result is the most promising result next to the JRIP
algorithm by understanding the experiment result of the model.
The
fourth most performing model is the Naive Bayes Algorithm model, which is the
third one according to the above criteria performance, which is almost very
close to the Naive Bayes classifier. This model scored 68.12% accuracy on the
general data to classify the status of diabetic patient datasets. The time
taken to perform the general data by this algorithm is 0.1 seconds, as is the
time taken to classify the 498 instances of the records. The precision (71.8%)
and recall (80.4%). This result is the most promising result next to Naïve
Bayes algorithm by understanding the experiment result of the model.
Generally,
the J48 model is the most performing model with good accuracy of results. The
PART rule induction is the second most performing model next to the J48 model,
whereas the JRIP and Naive Bayes algorithms are the last performing
classifiers. Among these algorithms, the J48 algorithm is the best performing
model by classifying diabetic patient datasets and generating rules.
8. CONCLUSION AND
RECOMMENDATIONS
Conclusion
This experimental
research, which engaged a CRISP methodological approach, made use of predictive
modeling techniques to address the problem. The experiment result shows the
selected algorithms tested, the decision tree classifier (J48) algorithm scored
the highest accuracy and best predictor with (92.74%), followed by PART
(92.06%), JRIP (70.58%), and Naive Bayes algorithms (68.12%).
Recommendation
and Future Work
This
study showed the potential applicability of data mining algorithms to diabetes
screening datasets in Classification algorithm. Based on the findings of the
study, we recommend the following as future research directions:
·
We
used the J48 decision tree, the PART, the JRIP, and the Naive Bayes classifier.
Further research using ANN, KNN, SVM, and others
·
It
is difficult to get well-organized, correct, and quality data for the mining
algorithms. We suggest health centres analyse their data symmetrically for data
analyses.
·
More
research and development efforts need to be conducted to enable and explore the
variety of data mining techniques that can be applied to diabetes and free
diabetic datasets.
·
Integration
of data mining techniques into existing systems and computerizing manual
recording systems in databases is a priority issue.
· To develop web-based software for performance evaluation of various classifiers where the users can just submit their data set and evaluate the results on the patient.
REFERENCES
A. G. Eapen, (2004)
"Application of Data mining in Medical Applications by," Univ.
Waterloo, Retrieved from https://uwspace.uwaterloo.ca/handle/10012/772
A. Iyer, J. S, and R.
Sumbaly, (2015) "Diagnosis of Diabetes Using
Classification Mining Techniques," Int. J. Data Min. Knowl. Manag.
Process, vol. 5, no. 1, pp. 01-14, Retrieved from https://doi.org/10.5121/ijdkp.2015.5101
A. SELAM, (2012) "PREDICTING THE OCCURRENCE OF MEASLES OUTBREAK IN ETHIOPIA USING DATA MINING TECHNOLOGY." Addis Ababa University,
A. Tella, (2015) "Electronic and paper based data collection methods in library and information science research: A comparative analyses," New Libr. World, vol. 116, no. 9-10, pp. 588-609, Retrieved from https://doi.org/10.1108/NLW-12-2014-0138
B. Dagnew et al., (2021) "Hypertriglyceridemia and Other Plasma Lipid Profile Abnormalities
among People Living with Diabetes Mellitus in Ethiopia: A Systematic Review and
Meta-Analysis," Biomed Res. Int., vol. 2021, Retrieved from https://doi.org/10.1155/2021/7389076
B. S. Kumar and D. G. R., (2016) "A Survey on Data Mining Approaches to Diabetes Disease Diagnosis and Prognosis," Ijarcce, vol. 5, no. 12, pp. 463-467, Retrieved from https://doi.org/10.17148/IJARCCE.2016.512105
B. Zerihun, (2017) "Developing a Predictive Model for Pre-Diabetes Screening by Using Data Mining Technology." Addis Ababa University,
D. Kabakchieva, (2016) "Predicting Student Performance by Using Data Mining Methods for
Classification Predicting Student Performance by Using Data Mining Methods for
Classification Dorina Kabakchieva," no. March 2013, Retrieved from https://doi.org/10.2478/cait-2013-0006
H. Hauner and W. A.
Scherbaum, (2002) "Type 2 diabetes," DMW -
Dtsch. Medizinische Wochenschrift, vol. 127, no. 19, pp. 1003-1005, Retrieved
from https://doi.org/10.1055/s-2002-28326
H. Yan, Y. Jiang, J. Zheng, C.
Peng, and Q. Li, (2006) "A multilayer
perceptron-based medical decision support system for heart disease
diagnosis," Expert Syst. Appl., vol. 30, no. 2, pp. 272-281, Retrieved
from https://doi.org/10.1016/j.eswa.2005.07.022
I. M. Ahmed, A. M. Mahmoud, M. Aref, and A.-B. M. Salem, (2012) "A study on expert systems for diabetic diagnosis and treatment," Recent Adv. Inf. Sci., pp. 363-367,
J. James and K.
Sarvanakumar, (2017) "Empirical Study on Data
Mining Algorithms related to Breast Cancer," Indusedu.Org, vol. 07, no.
03, pp. 14-18,, [Online]. Available Retrieved from : http://www.indusedu.org/pdfs/IJRIME/IJRIME_1088_90543.pdf
J. M. Dowling and C.-F. Yap,
(2014) "Communicable Diseases in Developing
Countries," Commun. Dis. Dev. Ctries., 2014. Retrieved from https://doi.org/10.1057/9781137354785
J. Yu, H. Huang, and S. Tian, (2004) "Cluster validity and stability of clustering algorithms," Lect. Notes Comput. Sci. (including Subser. Lect. Notes Artif. Intell. Lect. Notes Bioinformatics), vol. 3138, no. 3, pp. 957-965, Retrieved from https://doi.org/10.1007/978-3-540-27868-9_105
K. Eyasu, W. Jimma, and T.
Tadesse, (2020) "Developing a Prototype
Knowledge-Based System for Diagnosis and Treatment of Diabetes Using Data
Mining Techniques," Ethiop. J. Health Sci., vol. 30, no. 1, pp. 115-124,
Retrieved from https://doi.org/10.4314/ejhs.v30i1.15
O. Region, (2017) "Research in Molecular Medicine Prevalence of Prediabetes and its
Risk Factors among the Employees of Ambo," vol. 5, no. 3, pp. 11-20,
Retrieved from https://doi.org/10.29252/rmm.5.3.11
R. Williams et al.,
(2020) "Global and regional estimates and
projections of diabetes-related health expenditure: Results from the
International Diabetes Federation Diabetes Atlas, 9th edition," Diabetes
Res. Clin. Pract., vol. 162, Retrieved from https://doi.org/10.1016/j.diabres.2020.108072
S. Anagaw, (2002) "Application of data mining technology to predict child mortality patterns : the case of butajira rural health project (brhp)," Unpubl. Masters thesis Addiss Ababa Univ.,.
S. Habibi, M. Ahmadi, and
S. Alizadeh, (2015) "Type 2 Diabetes Mellitus
Screening and Risk Factors Using Decision Tree: Results of Data Mining,"
Glob. J. Health Sci., vol. 7, no. 5, pp. 304-310, Retrieved from https://doi.org/10.5539/gjhs.v7n5p304
W. Gao and Q. Qiao, (2012) "Screening for type 2 diabetes," Epidemiol. Type 2 Diabetes, pp. 29-38, Retrieved from https://doi.org/10.2174/978160805361211201010029
Z. Marzuki and F. Ahmad, (2007) "Data Mining Discretization Methods and Performances," Mach. Learn., no. 1, pp. 978-980, Retrieved from https://d1wqtxts1xzle7.cloudfront.net/50217711/Data_Mining_Discretization_Methods_and_P20161109-21049-ukdace-with-cover-page-v2.pdf?Expires=1640247769&Signature=aBcWHXg6eVqFLq6aaQIxKpqA4KuDOdOhq7Nifd2cwm9wtkdzUHvlfkD6eiW4pllyKw0cPci26sAMcHgSU57tGBn9HeS4nqR6WsQCKUN-8w4OoreY-1Pjq1ecaCSZrh-1HLt0V0lapzSmtmWGZzP9gYJqfejBAvchirFY-3FH1F4TPbbgT7xyCA5HNSbUJFiOyAtUvjV-fzf~VhFAK3yREd9nwbhqc0-tHLL9aPQ2MIV-btIn6jYi0BIOlgGLT~b7XWM0NlotydSBaDP~l7CfKGJFl3UWZhUCp96wFIS5gla~kudQL12Rz0n2poR0XuaeLFVZ-hS4kQz5dwr1ODffOw__&Key-Pair-Id=APKAJLOHF5GGSLRBV4ZA
 This work is licensed under a: Creative Commons Attribution 4.0 International License
© Granthaalayah 2014-2021. All Rights Reserved.