Comparative study between geothermal and solar HVAC systemsFnyees Alajmi 1 1 Public Authority for Applied Education and Training, Kuwait2 Department of Mechanical and Manufacturing Engineering, Universiti Putra Malaysia, Serdang, Selangor, Malaysia. |
|
||
|
|
|||
|
Received 25 September 2021 Accepted 08 October 2021 Published 23 October 2021 Corresponding Author Amer
Alajmi, amerq880@gmail.com DOI 10.29121/IJOEST.v5.i5.2021.234 Funding:
This
research received no specific grant from any funding agency in the public,
commercial, or not-for-profit sectors. Copyright:
© 2021
The Author(s). This is an open access article distributed under the terms of
the Creative Commons Attribution License, which permits unrestricted use, distribution,
and reproduction in any medium, provided the original author and source are
credited.
|
ABSTRACT |
|
|
|
Many
applications depend mainly on heat energy, such as solar and geothermal heat
pumps. There is a high increase in the use of applications
that depend on renewable energy. The main
objective of this project is to study the heating systems and geothermal heat
pumps. This study also investigated solar heat pumps and
the geothermal efficiency to optimize its strategic
plan. A performance factor (COP) was used to assess the efficiency of both geothermal
and solar systems. To apply the methodology, a case study was used. The results
in the thermal energy system are that solar energy is better and more
cost-effective in terms of capital. The
revenues for the solar system after 25 years were higher than the revenues
for the geothermal system. Furthermore, solar power has a shorter payback
time making it superior for a similar life span, so it
was clear that the expenditure on solar power was
safer than the expenditure on geothermal power. |
|
||
|
Keywords: Heat Energy, Renewable Energy, Geothermal Heat Pumps, Performance Factor, Geothermal Power, Thermal Energy 1. INTRODUTION In 2017, a significant
increase in energy demand of 2.2%—the Organization for Economic Cooperation
and Development (OECD) driven the growth. Economic growth has been linked to
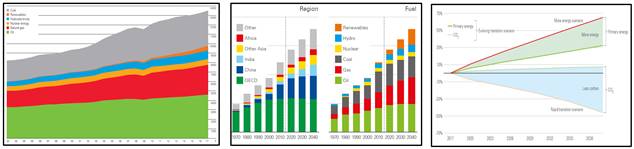
this strength. The consumption of global energy is shown in Figure 1, BP statistical (2018). The production
of a low amount of carbon in addition to the increase in the use of energy is
one of the challenges of the global energy system. When energy is used, it
produces carbon dioxide emissions, which grow continuously by 10% until 2040.
A 40% carbon reduction is one of the plans that have been put in place to
reduce carbon emissions BP Energy Outlook (2019). |
|
||
|
|
|
Figure 1 The consumption of global
energy and carbon emissions and primary energy demand BP
statistical (2018); BP
Energy Outlook (2019) |
The formation of the earth leads to the formation of heat energy of 40-50 terawatts. But it is difficult to extract this energy and benefit from it because this energy spreads in an orderly manner through the layers of the earth. Heat collects energy at the edges of tectonic plates. Tidal energy is renewable energy, but it is limited. Beach and tidal elevation are constraints of this energy. Based on the studies, the energy produced by the tides was less than 1 TW Seger (2016). Geothermal energy may play an important role, as it is a clean and safe facility. Solar energy and geothermal resources get a significant capability for long-term low GHG energy production while also providing safe baseload situations. Climate change will have little impact on the generation and usage of solar energy and geothermal. Research field to enhance the power generation capacity of solar energy and geothermal resources and their global distribution could play an essential role in mitigating climate change.
The aim of the project to investigate the performance of geothermal HVAC as well as solar devices that are already being used in buildings throughout the United Kingdom to improve the efficiency of solar systems and COP of geothermal HVAC. This is accomplished by:
1) To determine which technologies are used in residential buildings.
2) To determine the tools to be used to assess the efficiency in HVAC systems, among others.
3) For a case study for the design of the ventilation and heating system.
4) To compare the regulars and make recommendations.
2. LITERATURE REVIEW
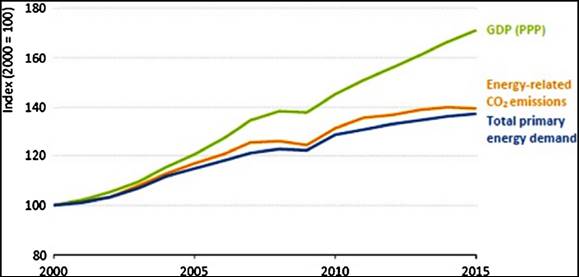
Nowadays, the growing use of fossil fuels has led to environmental concerns around the world. If the usage of fossil fuel stays at this significant level, the world's climate conditions would therefore influence the global environmental concerns and the energy usage pattern and life quality. The consequent air pollution caused by the usage of fossil fuels remains a major ecological challenge at national and regional levels. On the basis of the 2016 world energy outlook IEA (2016), the regulations as well as warnings on environmental protection have been expanded (Figure 2). One-third of the "Green House Gasses (GHG)" global emissions are generated by buildings, according to (Robert & Kummert, 2012). Fossil fuel seems to have an important influence on the rise of GHG emissions, resulting in climate change, environmental impacts as well as global warming. They were intended to examine the efficiency of the geothermal HVAC systems that, in addition to different urban countries, are now being used in the United Kingdom for the objective of improving COP and performance within Geothermal HVAC systems.
|
|
|
Figure 2 Explains the fluctuations in
demand for energy, global economic production in addition to the energy co2
emissions IEA
(2016) |
1) Geothermal
HVAC Systems Efficiency Determination
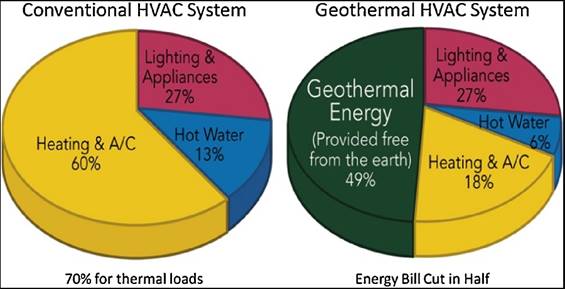
According to Rosen and Koohi-Fayegh (2017), "Ground Hot Exchanger (GHE)" is fixed underground, air distribution, heat pump. Are geothermal energy-dependent cooling and heating systems, GHE, which should measure following demand expectations, apart from auxiliary systems, is heavily impacted by the direct cost (like the component of natural gas for very cold temperatures). In actual fact, GHEs are in addition to soil heat characteristics, heat change coefficients, and ground temperature responsive to spongy surface-type flow rates. But it may be optimally tailored for a range of conditions Rosen and Koohi-Fayegh (2017). Figure 3 shows a comparison.
|
|
|
Figure 3 Clarifies the geothermal and the conventional
HVAC system Anonymous
(2018) |
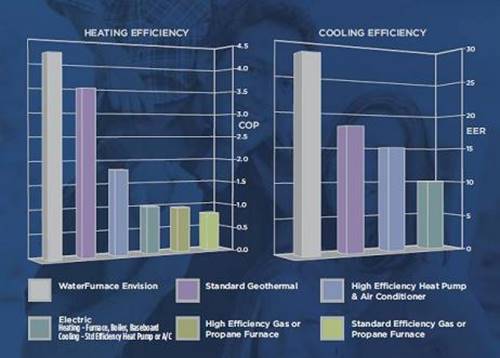
In addition to numerous forms of heat pumps, geothermal pumps describe the efficiency by their COP or coefficient of performance. The specific way of quantifying how much energy is generated relative to the energy utilized is explored. The COPs' value for the majority of the geothermal heat pump system is (3- 4.5). This results in the supply of (3-4.5) units to each power unit in a heat form. Fossil fuel furnaces are approximately 78-90% more efficient, while the geothermal type heat pump technology is 400% more effective. Some electrical utilities and heat pump companies use computers to specify precisely the operational efficiency of the equipment in the building or the residence. Figure 4 demonstrates geothermal heat pumps with conventional systems cooling and heating efficiency.
|
|
|
Figure 4 demonstrates the heating and cooling
efficiencies regarding the geothermal heat pumps in conventional systems (Energy Environmental, 2019) |
2) Configuration
of Solar Heat Pumps
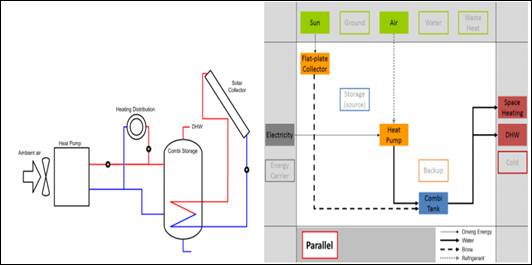
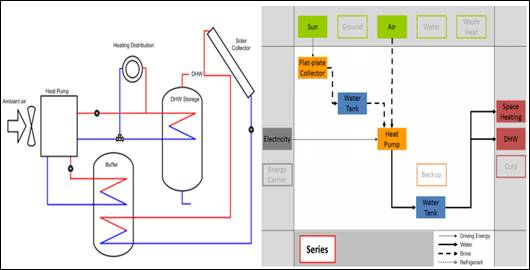
Solar heat pump systems (SHPs) are handled as hybrid systems, where solar thermal or even solar photovoltaic heat pumps are coupled to the heating system. Solar thermal collectors transform solar energy into thermal energy solar energy. The solar thermal collectors have two primary configurations: parallel and series. The heat pump as well as the solar collector provide heat for cargo in parallel systems as illustrated in Figure 5, either through the store or even directly, while the solar collector heat produced is used indirectly as the heat source for the thermal pump evaporator, as shown in Figure 6. (Poppi, 2017). In numerous areas such as design, installation, and control, the parallel arrangement is believed to be easier than series. It is also stronger when the radiation is significantly high Haller and Frank (2011).
|
|
|
Figure 5 Configuration of parallel
(Poppi, 2017) |
|
|
|
Figure 6 Series configuration (Poppi,
2017) |
3) Applications
of geothermal HVAC systems in houses
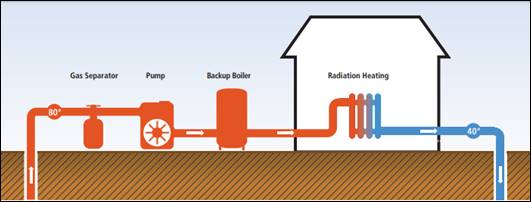
Direct use of the facility includes refreshments and heating in greenhouses, pools, fish ponds, spa, bathing, district heating, desalination/cleansing of water, as well as industrial heating and treatment utilized for the desiccation ore mining and agricultural goods. There have been two basic types of employed systems, open and closed-loop systems, to heat the room. The open-loop network also refers to single pipe systems using geothermal water recovered straight from the well for radiation mixing purposes, as seen in Figure 7. (Bertani et al.,2015). Energy mining will, in turn, chill the neighbouring earth during the whole hot period. The deepness and quantity of samples might be limited in order to minimize damaging impacts on the ground. However, during summer cooling periods, these impacts might be decreased by heat storage under the earth.
|
|
|
Figure 7 illustrates the various heating systems of
open-loop type (single Pipe) (Bertani et al., 2015) |
4) Solar
Heat Pump Systems Performance
Heat pumps and solar thermal systems for a space heater and hot water for domestic heating applications have been explored by MacSheep (2012- 2015). MacSheep's objective was to develop new and innovative goods and sophisticated testing techniques using technological, ICT, and material system enhancement. MacSheep aimed to achieve a 25 percent reduction in energy, with still competitive costs on the market compared with state-of-the-art technologies at the start of the project.
3. METHODOLOGY
This section describes the methodology which can be followed to evaluate the possibilities and limitations of using geothermal and solar energy in HVAC (heating) system in the UK. A case study for a house in Bradford – United Kingdom, was selected to apply the design criteria. The layout of the house was distributed into several zones. The standards outside and inside temperatures in Bradford were investigated to create an HVAC system for this building, taking into account heating loads. The estimated heating loads are used to study the design of a sustainable energy model to increase the energy efficiency of the house. Finally, the solar and geothermal energy systems will be evaluated to make decisions for the best alternative in terms of efficiency, cost, and sustainability.
3.1. Case study
1) Layout
of the studied house
The home is built on a 13-meter-wide land with an area of 15 meters in length (12, 7 m diameter to 9 m) as seen in Figure 8. There is also a lobby space with two stories; on the ground floor, there are two bathrooms and two bedrooms; on the second story, there are a multifunctional room and a rooftop terrace. The exterior design of the house is seen in Figure 9.
|
|
|
Figure 8 the model of a house |
2) Zones
This house was built on land with an area of 196.3 m², and the construction area is 114.3 m² consisted of two floors. The ground floor consists of 2 bedrooms, two bathrooms, and receiving area, and an open dining room (without partitions). Table 1 shows the zones of the ground floor with the dimensions of each zone. The second floor consisted of a multi-purpose room and a roof deck.
|
Table 1 The zones of ground and second floor |
|
|
Zones |
Dimensions |
|
Ground
floor |
|
|
Zone
-1: bedroom 1 |
4 m × 4
m |
|
Zone
– 2: Bedroom 2 |
2.5
m × 3 m |
|
Zone –
3: Kitchen |
4 m × 3
m |
|
Zone
– 4: Dining |
4
m × 2 m |
|
Zone –
3: Reserving area |
4 m × 3
m |
|
Zone
– 4: Bathroom 1 |
7
m × 2.5 m |
|
Zone –
3: Bathroom for master room |
2 m × 1
m |
|
Second
floor |
|
|
Zone -1: multi-purpose room |
12 m × 4 m |
|
Zone – 2: roof deck |
8
m × 4 m |
3.2. HVAC calculations
Heating and cooling loads are the factors of energy needed to be deleted or improved from space by way of an HVAC system to extend the expected level of pleasure within deep space. The scheme of HVAC with its right-sizing starts with precise consideration of the cooling and heating amount of loads on a space. The right size means that HVAC designs and appliances are chosen.
4. Load Calculation
1) Transfer
of heat over opaque surfaces
This is an adequate heat transfer method. The rate of heat transmission through the opaque surface, including walls, roof, and doors, etc. is determined by:
![]()
U: Is the entire coefficient of heat transfer.
A is the area where the surface is heat transferred on the custom space side.
CLTD: is the cooling_load_temperature_modification.
2) Heat transferring by fenestration
![]()
A is a sun radiation-exposed region.
SHGF, SC: The peak factor of solar heat gain and Shading Coefficient.
CLF: is the factor of cooling load factor.
3) Infiltration
heat transfer
The sensitive heat transfer due to penetrating is determined by:
![]()
![]()
4) The
rate of infiltration by a method air change is specified by
![]()
ACH: The number of changes in the air per hour.
V: is the gross volume of the conditioned space in m3
The inner cooling load caused by the occupants includes heat elements, both sensitive and latent.
![]()
![]()
5) Load due to lighting
Lighting improves sensitivity to heat in the conditioned room. Since both convection and radiation are used to transport heat from the lighting system, the cooling charge factor is used to take into account the time lag. Thus, the lighting system produces a burden of cooling;
![]()
· A value of 1.25 is taken for the fluorescent lights.
· A value of 1 for the incandescent lamps.
CLF: a function that depends on the number of hours after turning on the lights.
6) Internal
loads due to equipment and appliances
The internal loads based on appliances and equipment are given by.
![]()
![]()
The wattage installed and utilization factor depend on the type of equipment or devices.
5. SIMULATIONAL RESULTS
5.1. HVAC design
1) Transmitting heat across opaque materials
The rate of heat transfer is calculated using the following equation:
![]()
![]()
Where:
CLTDè Temperature difference of cooling load.
Tiè inside temperature.
Toè outside average temperature.
Kè correction factor varies with building color.
LMè Monthly latitude correction
The ground floor zones calculation for zoon 1 as follow:
· E-wall:
![]()
![]()
![]()
![]()
· N-wall
· S-wall
![]()
![]()
![]()
· Total
![]()
The ground floor zones calculation for zoon 2 as follow:
· E-wall
![]()
![]()
![]()
![]()
· N-wall
![]()
![]()
![]()
![]()
· S-wall
![]()
![]()
![]()
![]()
Total:
![]()
The ground floor zones calculation for zoon 3, 4, and 5 as follow:
· W-wall
![]()
![]()
![]()
![]()
· N-wall
![]()
![]()
![]()
![]()
· S-wall
![]()
![]()
![]()
![]()
· Total
![]()
The second-floor zones calculation for zoon 1 as follow:
· S-wall
![]()
![]()
![]()
![]()
· W-wall
![]()
![]()
![]()
![]()
· Total
![]()
Roof deck calculation as follow:
![]()
![]()
2) Transmitting heat cross fenestration
Heat transfer calculated using the following equation:
![]()
Aè Solar radiation-exposed area
SC and SHGF è Coefficient of Shading and highest possible Solar Heat Gain Factor
CLFè Factor of Cooling Load
The calculations of heat transfer cross glass as follow:
· S-wall
![]()
· W-wall
![]()
· N-wall
![]()
· E-wall
![]()
· Total
![]()
The total heating load equal:
![]()
5.2. Geothermal and Solar HVAC System Design
1) Geothermal
HVAC heat pump
·
Pipe’s temperature
To determine the minimum pipe temperature of the surface in the system to meet the house heating load, you can apply the following formula Lund (1996):
![]()
Where:
T0: Indoor air temperature (18.3°C)
AUST: Average_temperature_of_unheated_surfaces_in_the_house_ (15°C) Lund (1996)
Tp: Geothermal pipes temperature of surface (°C)
q: Heating_load_of_the_house (855.43 kW)
A: Floor of the area (196.3 m2)
·
Internal surface temperature
The internal surface temperature (IST) can be estimated based on the following Equation Björnsson (1980):
![]()
Where:
IST: Temperature of the internal surface
IDT: Inside design temperature [60°C].
U: Coefficient of heat-transfer losses [4.26 W/m2. °C]
∆T: Variation in temperature outside and inside [10°C] based on Björnsson (1980)
![]()
This equation could calculate the pump pressure, head, and flow rate and add up the details in Table 2:
|
Table 2 Pump characteristics at
different geothermal usage percentages |
||||||
|
Pump |
Geothermal % |
|
|
|
Pump head (m) |
Pump flow (m3/hr) |
|
1 |
10% |
54 |
810 |
134.07 |
13.67 |
23.4 |
|
2 |
20% |
108 |
1619 |
268.14 |
27.33 |
23.4 |
|
3 |
30% |
162 |
2429 |
402.20 |
41.00 |
23.4 |
|
4 |
40% |
216 |
3238 |
536.27 |
54.67 |
23.4 |
|
5 |
50% |
270 |
4048 |
670.34 |
68.33 |
23.4 |
In each tube arrangement, the pump head is the pressure drop and displayed in Table 3. In the Darcy - Weisbach formula, the pressure difference is exactly proportional to pipe length if the pump-diagram diameter of these pipes is fixed in each case. Thus, the pump-head is raised to overcome the difference in pressure and supply the required amount of hot water.
2) Solar
HVAC system design
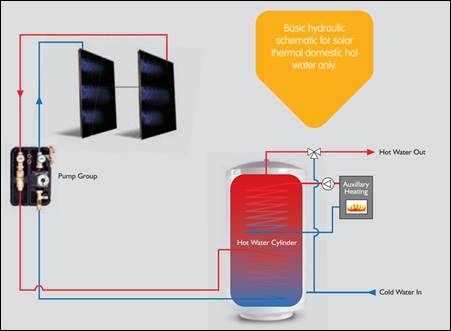
Figure 9 depicts the geothermal HVAC system regarding the design parameters. Figure 9 also shows the settings of the solar system:
|
|
|
Figure 9 Solar heating system's typical
setup Solfex®
(2010) |
·
Rate flow of water by the system
The quantity of workable fluid (water) may be approximated inside the system as follows:
![]()
Where:
m ̇: Rate flow of mass of water (kg/s)
CP: Specific heat of water (4.182 kJ/kg.K)
Q: System heat duty (855.43 kW)
∆T: Temperature variations between the outlet and inlet water (30K)
![]()
A volumetric rate flow of water could be found as:
![]()
![]()
The rate flow of water for days could be expected as:
![]()
·
Bradford solar intensity
The average sun intensity (Q ̇_solar) in 2019 February was reported on NASA's webpage for worldwide renewable energy as 6.3 kWh/m2. Day NASA website (2019).
The solar (ƞ_solar) and the heat (ƞ_thermal) efficiency in Bradford-UK should be evaluated as follows in order to calculate current solar flux (Q __net) in Bradford-UK:
![]()
The performance of the system collector is 55% to 65% (Weiss W., 2017). Effectiveness might be measured as 55% in the winter season. Eighty-five percent of hydrothermal effectiveness may be achieved with an isolated solar heating system Weiss (2017). The solar flow rate arises based on such assumptions:
![]()
·
Area of solar collectors
The area of the solar collector (A) may be computed accordingly:
![]()
Q ̇_net: Net solar heat flux (kW/m2)
Q ̇_heating: The necessary part of the solar heating power (kW),
![]()
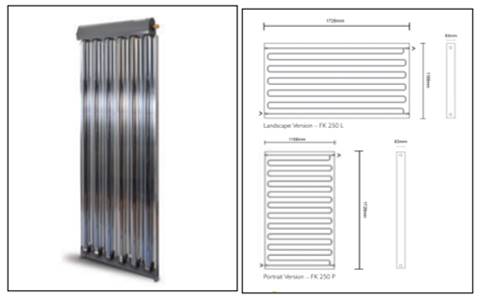
Due to this area, it is possible to determine the maximum number of solar collectors on the home roof. The unit parameters should be specified before calculating the number of solar units. The following figure shows the specified solar collector: Figure 10 displays the size of the solar collector determined by the available sun-exposed roof zone. With about six tubes per unit, the area of the single collector is 2 m2. Every tube is 1.7 m in length. The following drawing (not to scale) would be used to estimate the overall area of a roof.
|
|
|
Figure 10 Solar heating collector chosen
dimension Solfex®
CO. (2010) |
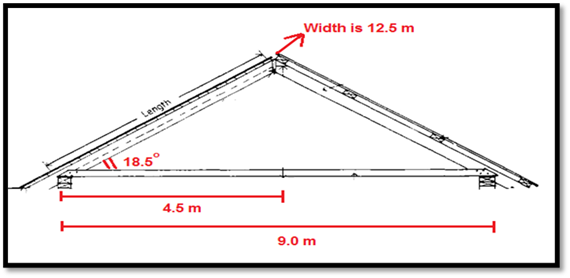
The path of solar collectors, as indicated in Figure 11, is obvious, due to its hard roof construction, as a limitation. The angle of the Azimuth may give it a greater slope, but the structure is rugged. The sloping roof length may be calculated by the following sine rule:
![]()
The net surface of the roof is:
![]() (Larger than the required area of solar panel)
(Larger than the required area of solar panel)
The solar collector has ample room. The units are numbered 42. The number of pipes, therefore, amounts to 252 pipes. The length of the tube is around 430 m.
|
|
|
Figure 11 Estimation of the net roof area
of the studied house |
5.3. HVAC System Comparison: Geothermal vs. Solar
The comparison has been intended to assess the economic benefit of using both systems, like hybrid systems using systems of the gasoline heat pump. The below requirements and parameters were used to calculate the revenue and the expense of systems. As stated in Table 3, the expense index for utilizing gas to heat water approximately 45 pence per 230 liters:
|
Table 3 In the United Kingdom, the
expense of using a gasoline heating system to heat the water for a unit area
of the home. Greenage website (2015) |
|||
|
|
Degree-days |
Annual space heat demand |
Cost for heating |
|
Newcastle |
2,400 |
10,368 kWh |
£363 |
|
London |
2,100 |
9,072 kWh |
£318 |
|
Plymouth |
1,900 |
8,208 kWh |
£287 |
Note: According to the same source, the estimated price of heating systems was £32.3/year/m2.
· The solar system was expected to have a 10-percentage cost of maintenance, while the geothermal heat pump system has a 5-percentage cost of maintenance.
· Both systems have a 25-year lifetime.
· According to the UK Gas Price Inflation Report, the price of gas in the UK has risen by 9.3 percent Meakin and Atkinson (2019).
1) Geothermal
system financial analysis
The geothermal system capital cost may be calculated through calculating the cost of pipes as well as heating systems at current pricing. The quantities bill for the geothermal system is shown in Table 4.
|
Table 4 The quantities bill for
the geothermal system |
|||
|
Element |
Price of Unit |
Quantity |
Overall cost |
|
Copper pipes with a
2-inch diameter |
£8.33/m 1 |
1619 m |
£13,486.3 |
|
Heat pump (Neptuno® - VTP30)1 |
|
Q = 6.51 L/s |
£5,607.3 |
|
Sub Overall |
£19,093.6 |
||
|
Cost of installation (10%) |
10% of capital cost |
£1,909.4 |
|
|
Overall cost |
£21,003 |
||
The BOQ for the geothermal system is shown in Table 18, but it results in yearly cost savings equal to £7376.3. For 20-percentage reductions, yearly cost savings (M save) during the first year may be estimated as follows:
![]()
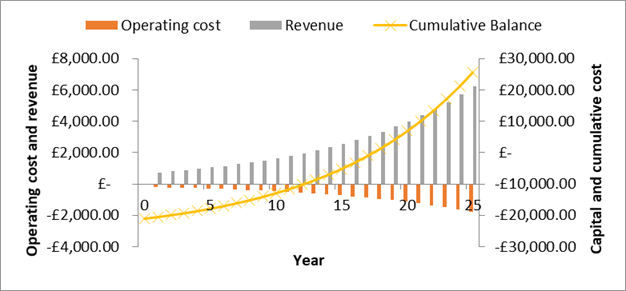
Table 5 and Figure 12 show the cash flow according to these values for geothermal energy consumption.
|
Table 5 Calculating the cash flow
of a geothermal system |
||||
|
Year |
Capital cost (£) |
Operating cost (£/yr) |
Revenue (£/yr) |
Cumulative Balance (£) |
|
0 |
-21003.00 |
0.00 |
0.00 |
-21,003.00 |
|
1 |
0.00 |
-210.03 |
737.69 |
-20,475.34 |
|
2 |
0.00 |
-229.56 |
806.30 |
-19,898.61 |
|
5 |
0.00 |
-299.75 |
1052.82 |
-17,826.18 |
|
10 |
0.00 |
-467.59 |
1642.31 |
-12,870.61 |
|
15 |
0.00 |
-729.40 |
2561.86 |
-5,140.34 |
|
16 |
0.00 |
-797.23 |
2800.12 |
-3,137.45 |
|
17 |
0.00 |
-871.37 |
3060.53 |
-9,48.29 |
|
18 |
0.00 |
-952.41 |
3345.16 |
1,444.46 |
|
19 |
0.00 |
-1040.98 |
3656.26 |
4,059.73 |
|
20 |
0.00 |
-1137.80 |
3996.29 |
6,918.22 |
|
25 |
0.00 |
-1774.86 |
6233.87 |
25,728.54 |
Using geothermal energy into HVAC was possible after a 16-year payback time, as shown in Table 5 and Figure 12. After 25 years, the total revenue was Euro's 25,728.5. Figure 15 illustrates that cash flow was geometrical since the inflation rate for both operational costs as well as income was taken into consideration. It should be noted that the operational cost associated with maintenance could be red from the left y-axis, with a minus sign showing the expenditure. Furthermore, revenue might be red out of the same y-axis but also with a positive sign, signifying systems revenue. From the right y-axis, the capital cost, as well as total cash flow, may be shown in red.
|
|
|
Figure 12 The cash flow of employing
geothermal energy into HVAC for a property in Bradford, UK, both discontinuous
as well as cumulative. |
The cash flow for geothermal HVAC utilization is shown separately and cumulatively in Table 5 and Figure 12. Figure 12 shows that running costs rise with time, which can be ascribed to system aging and lower efficiency. On the other side, as income grows over time, money was conserved. This rise makes up for the reduction in operational costs. As a result, the cumulative equilibrium grows over time, indicating a strong system. In addition, the payback time of 16 years was indicated, as is the year of beginning to receive money. The 16-year payback time was reasonable, and it may be lowered by using lower-cost elements. However, quality was not taken into account.
2) Bradford
solar intensity
The average sun intensity (Q ̇_solar) in 2019 February was reported on NASA's webpage for worldwide renewable energy as 6.3 kWh/m2. Day NASA website. (2019). The solar (ƞ_solar) and the heat (ƞ_thermal) efficiency in Bradford-UK should be evaluated as follows in order to calculate current solar flux (Q __net) in Bradford-UK:
![]()
The performance of the system collector is 55% to 65% Weiss (2017). Effectiveness might be measured as 55% in the winter season. Eighty-five percent of hydrothermal effectiveness may be achieved with an isolated solar heating system Weiss (2017). The solar flow rate arises based on such assumptions:
![]()
6. CONCLUSION
Solar heating systems and geothermal heat pumps, in addition to the efficiency of these systems, have been studied in order to develop operational plans. The performance factor was used to evaluate the efficiency of both geothermal energy and the solar system. A house located in UK / Bradford was taken as a case study. The house's design is divided into various sections. The exterior and internal temperature characteristics of Bradford were then investigated in order to design the HVAC system for this structure while accounting for heating loads. The projected thermal loads have been used to research the development of a comprehensive energy model to improve household energy consumption. This research investigated geothermal and solar systems to create better alternative selections in terms of cost, efficiency, and sustainability.
According to the analysis findings, available space would be treated as a limit in determining the maximum proportion of geothermal power for overall HVAC power depending on geothermal heating systems with varied vertical layers. Because of the solar system position, which gravity forces the water to go below, the water pump throughout the solar system was lower than the pump throughout the geothermal energy model. Another cause was its lower total system. The geothermal and solar systems were compared to evaluate the financial benefit from employing both hybrid systems with a gasoline heat pump, as well as the revenue and expense of the geothermal and solar systems.
The comparison result had shown the total combined equilibrium changes over time, indicating a good structure, as well as a period of payback, was 16 years had been noticed, that will be the year of beginning to achieve revenues, as well as the period of payback was 16 years which is satisfactory, it could be decreased by using cheaper elements, but this is not taken into consideration, in terms of quality. It could be observed that the solar system has a shorter period of payback than the geothermal system. This is due to the geothermal system has bigger elements as well as a bigger pump. Furthermore, solar energy seems more practicable than geothermal energy since the solar system's capital cost was cheaper than the geothermal system's capital cost. Additionally, the net income for the solar systems for 25 years is more than the geothermal systems making it stronger for similar service life. The commitment to solar power was safer than the commitment to geothermal power. To summarize the comparison, the solar system had already demonstrated an advantage over the geothermal system; from both perspectives, it may be preferable to pick it, but only if the solar tubes are cleansed of dust regularly. Several recommendations were reached, including:
1) Develop a geo-solar-wind hybrid system and evaluate this system in terms of efficiency and cost.
2) Comparison of renewable systems to reach the most effective system.
3) Determine the factors that help increase the adoption and implementation of renewable energy systems.
REFERENCES
Adams Air Conditioning. (2019). The Coefficient of Performance ? [Online], Retrieved from https://www.adams-air.com/houston/what-is-COP.php Accessed on 24 Jun. 2021
Anonymous. (2018). Residential Installations, [Online], Retrieved from http://geocube.in/residential.html. Accessed at 16/July/2019
BP Energy Outlook 2019 edition report. (2019). Retrieved from: https://www.bp.com/content/dam/bp/business-sites/en/global/corporate/pdfs/energy-economics/energy-outlook/bp-energy-outlook-2019.pdf
BP statistical review of world energy report. (2018). Retrieved from https://www.industry.gov.au/sites/default/files/foi-18-011.pdf
Bertani, R.(2012). Geothermal power generation in the world 2005-2010 update report. Geothermics 41, 1-29 (2012). Retrieved from https://doi.org/10.1016/j.geothermics.2011.10.001
Björnsson, O. (1980) Cooling of water in district heating pipes. Orkustofnun, Reykjavik, Report OS80008/JHD04 (in Icelandic), 40 pp.
Fedrizzi, R., Dipasquale, C., Bellini, A., Gustafsson, M., Bales, C., Ochs, F. (2015). Performance of the Studied Systemic Renovation Packages - Methods, iNSPiRe project' report. Retrieved from https://www.diva-portal.org/smash/record.jsf?pid=diva2%3A1314381&dswid=7902
Goldstein, B., Hiriart, G., Bertani, R., Bromley, C. , Gutiérrez-Negrín, L., Huenges, E., Muraoka, H., Ragnarsson, A., Tester, J.and Zui, V. (2011). Geothermal Energy. In IPCC Special Report on Renewable Energy Sources and Climate Change Mitigation. Retrieved from http://www.ipcc-wg3.de/report/IPCC_SRREN_Ch04.pdf
Greenage website (2015). How much energy does my home use? (Accessed on 24 Jun. 2021). Retrieved from: https://www.thegreenage.co.uk/how-much-energy-does-my-home-use/
Hadorn, J. C. (2015). Solar and Heat Pump Systems for Residential Buildings. John Wiley & Sons. Retrieved from https://doi.org/10.1002/9783433604830
Haller, M., Frank, E. (2011). On the potential of using heat from solar thermal collectors for heat pump evaporators. In ISES Solar World Congress. Retrieved from https://doi.org/10.18086/swc.2011.26.06
IEA. (2016). World energy outlook 2016. Executive summary. The International Energy Agency (IEA).
Kirloskar® Brothers website (2019). Domestic Products: Pumps Catalogue. (Accessed on 24 Jun. 2021) Retrieved from http://www.kirloskarpumps.com/download/prod_catalogue/Pdf_630201613432PMKBL_Domestic_Pump_Range.pdf
Krockenberger, K. Degrove, J. Hutzel, W., and Foreman, C. (2014), Design of a heat pump assisted solar thermal system, Proceedings of the 3rd International High-Performance Buildings Conference at Purdue. Retrieved from https://docs.lib.purdue.edu/ihpbc/146/
Lund, J, Freeston, D. and Boyd, T. (2010). Direct utilization of geothermal energy 2010 worldwide review. Geothermics 40(3), 159-240 (2010). Retrieved from https://doi.org/10.1016/j.geothermics.2011.07.004
Lund, J.W. (1996). Lectures on direct utilization of geothermal energy. UNU GTP, Iceland, report 1, 123 pp. Retrieved from https://orkustofnun.is/gogn/flytja/JHS-Skjol/UNU%20Visiting%20Lecturers/John%20W%20Lund%201996%201a.pdf
MacSheep. (2012- 2015). New Materials and Control for a next generation of compact combined Solar and heat pump systems with boosted energetic and exergetic performance - European Union's Seventh Framework Programme project.
Meakin L. and Atkinson A. (2019). UK Inflation Climbs Above Target on Energy Costs, Air Fares. (Accessed on 24 Jun. 2021). Retrieved from https://www.bloomberg.com/news/articles/2019-05-22/u-k-inflation-climbs-above-target-on-energy-costs-air-fares
NASA website. (2019). NASA Prediction of Worldwide Energy Resource (POWER). Climatology Resource for SSE-Renewable Energy. (Accessed on 24 Jun. 2021). Retrieved from https://power.larc.nasa.gov/data-access-viewer/
Pieprzyk ,B., Kortlüke ,N. and Rojas, P.(2009). The impact of fossil fuels Greenhouse gas emissions, environmental consequences and socio-economic effects. Retrieved from http://www.ebbeu.org/EBBpressreleases/ERA%20Study%20Impact%20of%20fossil%20fuels%20final%20report.pdf
Robert, A. and Kummert, M. (2012). Designing net-zero energy buildings for the future climate, not for the past, Building and Environment. Retrieved from https://doi.org/10.1016/j.buildenv.2011.12.014
Rosen, M.A. Koohi-Fayegh, S. (2017). Geothermal energy: Sustainable heating and cooling using the ground, John Wiley & Sons. Retrieved from https://doi.org/10.1002/9781119181002
Saibi, H. Finsterle, S. Bertani, R. and Nishijima, J. (2013). Geothermal Energy, United Arab Emirates University. Retrieved from https://doi.org/10.1007/978-1-4020-8939-8_120
Saibi, H., Finsterle, S., o Bertani, R. and Nishijima ,J.(2013). Geothermal Energy. Research gate DOI: 10.1007/978-1-4020-8939-8_120. Retrieved from https://www.researchgate.net/profile/Hakim_Saibi/publication/236737240_Geothermal_Energy/links/562589b308aeabddac91cfa4/Geothermal-Energy.pdf?origin=publication_detail
Seger, B. (2016). Global Energy Consumption: The Numbers for Now and in the future. Retrieved from https://orbit.dtu.dk/files/128048208/Global_Energy_Consumption_The_Numbers_for_Now_and_in_the_Future.pdf
Shahzad, ,U.(2017). Global Warming: Causes, Effects and Solutions. Retrieved from https://www.researchgate.net/profile/Umair_Shahzad/publication/316691239_Global_Warming_Causes_Effects_and_Solutions/links/590ca678aca2722d185bff31/Global-Warming-Causes-Effects-and-Solutions.pdf?origin=publication_detail
SolAbility,R.(2014). The Cost of Fossil Energy Vs. Renewable Energy Cost 2014-2040. report based on data by the International Energy Agency (IEA), the World Bank, the International Monetary Fund (IMF). Retrieved from http://solability.com/wp-content/uploads/2015/11/Fossil_vs_Renewable_Energy_Cost_042014.pdf
Solfex® CO. (2010). Solar Thermal Product Guide. (Accessed 24 Aug. 2019). Retrieved from http://www.solfex.co.uk/uploads/downloads/Solar_Thermal_Brochure_small.pdf
Soltani, A. (2019). A comprehensive study of geothermal heating and cooling systems, Sustainable Cities and Society, Vol. 44. Retrieved from https://doi.org/10.1016/j.scs.2018.09.036
Weiss W. (2017). Design of Solar Thermal Systems - Calculation Methods, AEE - Institute for Sustainable Technologies A-8200.
Williams, K. Et al. (2018). Greenhouse Effect: Greenhouse Gases and Their Impact on Global Warming. Journal of Scientific Research and Reports · DOI: 10.9734/JSRR/2017/39630. Retrieved from https://www.researchgate.net/publication/323223192_Greenhouse_Effect_Greenhouse_Gases_and_Their_Impact_on_Global_Warming
Zacchei ,M.(2016). GEOthermal Technology for economic Cooling and Heating. Ref. Ares (2016)6241911. Retrieved from http://www.geotech-project.eu/wp-content/uploads/2016/12/D7.1_Market_Assessment.pdf
Zacchei, M. (2016). GEOthermal Technology for economic Cooling and Heating, Ref. Ares. Retrieved from https://www.worldweatheronline.com/bradford-weather-averages/west-yorkshire/gb.aspx
iNSPiRe. (2017). Retrofit Solutions Database - Target Building Simulations, [Online], Retrieved from http:// http://inspirefp7.eu/retrofit-solutions-database
 This work is licensed under a: Creative Commons Attribution 4.0 International License
© Granthaalayah 2014-2021. All Rights Reserved.