Finding a logical data-driven process for quantification of operation phase CO2 emission from urban residential buildings
Sumit Bose 1![]() , Madhumita Roy 2
, Madhumita Roy 2
1 PHD
Scholar, Department of Architecture, Jadavpur
University, India
2 Professor, Department of Architecture,
Jadavpur University, India
|
|
|
ABSTRACT |
|
|
The building
sector is found to be one of the biggest consumers of energy and emitter of
GHG gases. Considering the whole life-cycle of the building, the ‘operation
phase’ constitutes most of the emission. With a goal to investigate the
quantitative and qualitative parameters of Household Carbon Footprint, this
paper sets research boundaries as study of CO2 emission from the operation
phase of a multi-storied and multi-tenement residential building in the urban
area of Newtown, beside Kolkata, in India. The aims of the study are - 1)
identification of causes or sources of emission in a residential building and
2) finding a logical and scientific strategy and method for quantification of
CO2 emitted. The sources of emission from residential buildings are
identified as – electricity usage, fuel (LPG) usage for cooking, fuel
(Petrol) usage for vehicle idling time inside the building premises,
respiration by residents and potable water consumption. Study of existing
literature shows that there are gaps in research methods and end results due
to wide variations in selection of sources of emission, application of
different methods for quantification and choice of different coefficients of
CO2 emission and related factors by different agencies and research papers.
This paper searches for coefficients, factors and standards which are more
local, recent and apt and tries to find exact application of such energy by
end-users. The quantification results show that approximately 59.88% of the
total CO2 emission from a multi-storied multi-tenement urban residential
building is from consumption of electricity, 20.49% from respiration, 10.27%
from consumption of LPG for cooking, 5.36% from water consumption and lastly
3.99% from petrol consumption by automobiles owned by the residents. |
|||
|
Received 25 March 2025 Accepted 28 April 2025 Published 04 June 2025 Corresponding Author Sumit
Bose, sumit.sba@gmail.com DOI 10.29121/IJOEST.v9.i3.2025.704 Funding: This research
received no specific grant from any funding agency in the public, commercial,
or not-for-profit sectors. Copyright: © 2025 The
Author(s). This work is licensed under a Creative Commons
Attribution 4.0 International License. With the
license CC-BY, authors retain the copyright, allowing anyone to download,
reuse, re-print, modify, distribute, and/or copy their contribution. The work
must be properly attributed to its author.
|
|||
|
Keywords: CO2 Emission,
CO2 Emission Coefficients, Household Carbon Footprint, Urban Residential
Buildings, Climate Change |
|||
1. INTRODUCTION
Greenhouse Gas (GHG) emission is adding to the earth’s increasing temperature and has consequently become a thing of major concern. With GHG emission inventory becoming a tool for Climate Management, there arises the need to develop a methodology to calculate and quantify emission. GHG Protocol establishes comprehensive global standardized frameworks or accounting standards to measure greenhouse gas (GHG) emissions from private and public sector operations, value chains and mitigation actions. All researchers and agencies have accepted without any debate, that to start the process of mitigation the first thing to be done is finding out the source of GHG emission and its quantification. The process of preparing GHG inventory becomes inherently necessary to understand the emission scenario and work on any policy matters.
1.1. Research aim
This research paper intends to investigate emission from operation phase of urban residential buildings. The research had set the boundaries as study of only CO2 emission and exclude other GHGs, from only residential buildings and in urban areas. The study of previous research papers, primary and secondary, have shown that most of them have followed Life Cycle Analysis (LCA) method to identify sources of CO2 emission to quantify CO2 emission from residential buildings. This process involves the division of the whole life cycle of the building into generally six life phases of the building – extraction and production, transportation, construction, operation, demolition and recycling Yan and Chen (2018). This research paper studies only ‘operation phase’ of the urban residential building and aims to find - 1) the probable causes or sources of emission from the building, 2) the parameters governing the emission from these sources and 3) a logical quantification method of the CO2 emission.
1.2. Research gap and scope
The first step towards goal of CO2 mitigation is to find the Quantitative and Qualitative parameters of Household carbon Footprint (HCF). A good volume of research has been done in the field of emission from the ‘pre-operation’ phase of the building. Research on emission associated with materials being used for construction of the building i.e. the extraction production phase & the transportation phase and the emission factors associated with these phases are well studied till now. However, considering research on identification of sources of emission and it’s quantification, particularly from the operation phase of the residential building, is few and not exhaustive. Research on emission factors associated with the operation phase, like electricity generation, respiration, potable water production, LPG, etc. are few. Information needed for quantification are difficult to retrieve from existing papers, varying considerably from paper to paper. Information and data on these same emission sources and their emission factors at micro level, considering local level influencing factors, are also rare. There is immense scope of research on activities that are associated with the operation phase of the building, consumption factors of energy by household activities and associated emission factors. There is a need to understand and investigate the problem of household emission to implement policy intervention successfully in the field of emission control.
1.3. Research Limitations
Information regarding emission factors and energy consumption by household activities or sources of CO2 emission are few in existing literature. There is hardly any information regarding electricity generation emission factors at local or state level. The CO2 emission factor for electricity generation at the national level in India is provided by CEA. But the same information at the state or local level is difficult to missing. Considering emission factor of LPG is different in different countries due to variation in production process, there is very few data on this field. Regarding consumption of petrol by vehicles during idling time there is only one or two existing papers. There are very few studies done on CO2 emission during respiration or from production of potable water in India. So, with all these constraints, retrieving information regarding consumption of energy, consumption factors associated with end users and coefficients of emission associated with these energies are difficult to gather. This research paper tries to work with very limited information that is there in existing primary and secondary research papers
2. Literature Review
2.1. Quantification methods and emission factors
There are various agencies worldwide like GHG protocol, Global Reporting Initiative (GRI), International Integrated Reporting Council (IIRC) who have developed standards, tools and online training that helps countries and cities track progress towards their climate control goals. There are various methods to apply to assess and do the quantification of household emission like – ‘The GHG Protocol’, ‘ISO 14064’, ‘Life Cycle Assessment (LCA)’, market-based mechanisms such as the ‘Clean Development Mechanism (CDM)’, ‘Voluntary Carbon Standards (VCS)’ Telang, (2011). Researchers have applied various methods to quantify this emission. Xiaomei et al. Yan and Chen (2018) has computed the emission of residential buildings based on Life Cycle Analysis (LCA) by using local demographic and per capita housing database taken from secondary data and information from questionnaire based on 1) Building information, 2) household energy use, and 3) resident energy conservation. Mitali Das Gupta Gupta (2011) determines the carbon footprints of households by using carbon calculator offered by Clean India, a project of Development Alternatives, a prominent non-governmental organization in India that is dedicated to creating a carbon-free society. She uses a ‘stratified random sampling’ based on income levels. Economic characteristics, such as household size, per capita income, and carbon calculators, form the sole basis for calculating carbon equivalent emissions. The author limits her study to Direct impact of emission only and skips indirect impact due to limited scope of paper. The study also ignores cooking as a household activity consuming energy and carbon emitter. Shailesh ” Telang (2011) in his ARTICLE named “Carbon Footprint Calculation – A small Introduction of ISO 14064 has based the selection of emission factors and coefficients and quantification method totally on The GHG Protocol, ISO 14064. An educational campus, Apex Educational Institute, of approximately 100 acres was studied by S G Deshmukh Deshmukh (2015) in his research paper ‘Preliminary Report on Carbon Footprint of a Residential Complex’. The total CO2 emission of the campus was calculated after taking relevant inputs like 1) Total Electrical consumption, 2) petrol consumption, 3) Diesel (as a stand-by to electricity) consumption, 4) LPG consumption, 5) others like Paper. Consumption of Electricity and diesel is based on actual, according to logbook entry, in the year 2012-2013. The consumption of LPG, Petrol, and others are estimated following basic assumptions. Carbon footprint of each category is calculated based on unit rate of emission of those products. Rui Huang, Shaohui Zhang, and Changxin Liu Huang and Zhao (2018) in their paper studies CO2 emission of 4 megacities Beijing, Tianjin, Shanghai, and Chongqing along with its rural neighborhood. The emission data is found out with the help of existing data, coefficients, provided by different organizations, and application of simple mathematics and statistical models. The authors deal with direct and indirect emissions very systematically with in-depth study and analysis. Kaveri Patil and Aparajita Chattopadhyay Patil (2013) in their paper had studied factors that influence household energy decisions 2) Energy use and CO2 emissions in households. The authors mention the “National Sample Survey Organization (NSSO)” of the Government of India conducted a consumer survey from July 2009 to June 2010 (66 Round NSSSO, 2010), which served as the sole source of data and methodology for their study. The NSSO conducted a sample survey of 100855 people, 41736 of whom lived in urban areas. Other articles, such as those by Ekholm (2010), Pachuri (2007), Bhattacharyya (2006), and Gangopadhyay et al. (2005), have frequently cited the data by NSSO. The source of the emission coefficients for the paper by is Ventataraman et al. (2010). The study's limitation is that it only looks at energy usage and CO2 emissions from cooking, lighting, and electronic equipment. Moti L Mittal et al. in their research work on Estimates of Emission Coal Fired Thermal Power Plants in India Mittal and Sharma (2012) investigated emission of CO2 and other GHGs from thermal power plants in India for a period spanning from 2001-02 to 2009-10. He discovered that diverse coal quality, combustion technology, and operating systems are used by power plants. As a result the efficiency of power generation changes from plant to plant, as a result of which, the GHG emission rates of different plants are also changing. He also found out that CO2 emission from coal-based generation ranged from 0.82 to 1.0 KgCO2/per KWH. However micro level investigations showed many old plants were emitting more than 1.59 KgCO2/KWH and newer advance plants were emitting 0.58 – 1.0 KgCO2/KWh.
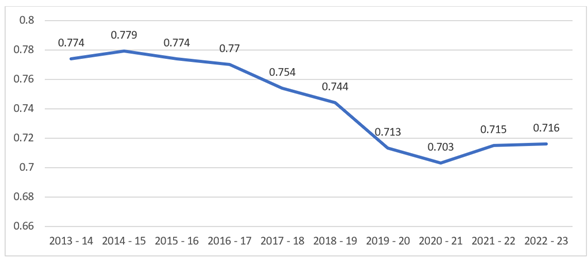
Following “Kyoto Protocol United Nations Framework Convention on Climate Change” (UNFCCC) and “Clean Development Mechanism” (CDM), the Indian government is also trying to decrease emissions from electricity grids. According to the Central Electricity Authority, Ministry of Power, Government of India, "CO2 Baseline Database for The Indian Power Sector," User Guide, Version 14.0, published in December 2018 Authority (2021), the results are encouraging. This has been possible by opting for better management, use of cleaner fuel, technical up-gradation generation process, use of advanced machineries, better transmission system, etc. Coal-based (electricity generation, which was approximately 58% of the total generation in 201, has come down to 39% in 2022. When considering simply emission coefficients from electricity generation, it is seen that this is also significantly decreasing as a result of the beneficial actions made by Indian government. Since the advent of Renewable Energy (RE), India's average emission factor from electricity generation has significantly decreased Table 1 and Figure 1.
Table 1
|
Table 1 Weighted Average Emission Factor (Considering Renewable Energy Generation) of Indian Grid |
||||
|
FY |
Total Electricity Generation
(BU) |
Total Emissions (Million
Tonnes) |
Average CO2 Emission Factor
of Grid Electricity including RE (tCO2/ MWh) |
|
|
2013 - 14 |
939.83 |
727.4 |
0.774 |
|
|
2014 - 15 |
1033.76 |
805.4 |
0.779 |
|
|
2015 - 16 |
1092.81 |
846.3 |
0.774 |
|
|
2016 - 17 |
1154.39 |
888.34 |
0.77 |
|
|
2017 - 18 |
1223.41 |
922.18 |
0.754 |
|
|
2018 - 19 |
1291.92 |
960.9 |
0.744 |
|
|
2019 - 20 |
1301.31 |
928.14 |
0.713 |
|
|
2020 - 21 |
1294.77 |
910.02 |
0.703 |
|
|
2021 - 22 |
1401.01 |
1002.01 |
0.715 |
|
|
2022 - 23 |
1523.72 |
1091.962 |
0.716 |
|
|
Source Central Electricity Authority (2023) |
||||
Figure 1
|
Figure 1 Average CO2 Emission
Factor of Grid Electricity Including RE (tCO2/MWh) Source CEA Central Electricity Authority (2023) |
According to cBalance Solutions Pvt. Ltd.'s 2009–10 GHG Inventory report on electricity generation and consumption in India, West Bengal's average emissions and, thus, its emission coefficient, are higher than the country's average Central Electricity Authority (2023), Table 2.
Table 2
|
Table 2 Trends in Average Emission Coefficient in West Bengal, India |
||
|
Emission
factor generation based. |
Combined
Emission Factor for End-User Consumption (considering AT&C loss) |
|
|
|
KgCO2/KWH |
KgCO2/KWH |
|
All
India Average |
0.89 |
1.1
kgCO2e/kWh |
|
West
Bengal Average |
0.97 |
1.29
kgCO2e/KWh |
|
Source GHG Inventory Report for Electricity Generation and Consumption in
India 2009-10 - Cbalance Solutions Pvt. Ltd Ltd (2009–2010) |
||
The literature review shows that the methods and approach undertaken by the researchers for quantification of CO2 emission are quite different. The emission factors and energy consumption standards applied are also varied. A comparative study different methods applied by few existing papers, emission coefficients used and findings are tabulated in Table 3.
Table 3
|
Table 3 Comparative Study of Existing Research Papers for Quantification Methods Applied and Emission Factors and Consumption Factors Considered |
||||
|
Xiaomei Yan et al. Research Paper |
Year of Publication |
Carbon Footprint Calculations based on |
SOURCE |
|
|
2018 |
Carbon Footprints Excluding the Operational Stage |
Carbon Footprints from the Building Operational Stage |
||
|
Calculations based on - Carbon emissions per unit area of apartments in life
cycle stages. CFi = Ai x EFi x T Where CFi is the carbon footprint of the building structure i ; Ai is the housing area of building structure i; EFi is the emissions factor per unit area of the building structure i and T is the lifespan of the buildings; assume the building life to be 50
years. Steel-Concrete Structure, Masonry-Concrete Structure Emission Factors - Extraction and production stage 0.6734, 0.3221 Materials transportation stage 0.0045, 0.0033 Construction stage 0.0337, 0.0161 Demolition stage 0.0303 0.0145 Recycle stage 0.0319 0.0068 Note - Unit: tCO2/m2. |
Calculation considers emissions from electricity generation only EE =
Ce x Ie, Where EE is the GHG emissions from residential electricity per month; Ce is the amount of household electricity consumption per month; Ie is the emission factor of electricity, 0.6623 KgCO2/KWh; GHGn is the total carbon emissions from power generation in Fujian
Province in year n, tCO2e; and Cn is the total grid generating capacity of Fujian
Province in year |
Source- Intergovernmental Panel on Climate Change (IPCC)
guidelines |
||
|
Author |
Year of Publication |
Carbon Footprint
Calculations based on |
SOURCE |
|
|
Carbon Footprints Excluding
the Operational Stage |
Carbon Footprints from the
Building Operational Stage |
|||
|
Mitali Dasgupta Article |
2011 |
Calculations not shown |
Calculations not shown |
The carbon footprints of
households are being calculated by the carbon calculator provided by Clean
India, an initiative of Development Alternatives, a leading NGO in India
working to build a carbon free society. Community Led Environment
Action Network (CLEAN-India) |
|
Shailesh Article |
2015 |
Only Operational Stage is
considered. Electricity = 0.85 kg CO2 per KWh, Step 1- Data collection; 1) Electricity: Collect data on
your annual electricity bills. The monthly electricity bills that the State Electricity
Board, Distribution, and Collection companies provide will tell you how many
power units—one unit in India is equivalent to one KWh of electricity—are
used in your residence. Multiply the number of units consumed per month by 12
(the number of months in a year). 2) Petrol/Diesel: Enter
how many liters of gasoline or diesel you used in your vehicle during the
course of a year. Please include average numbers if you are unable to recall
the precise value at this time. 3) LPG: Generally one LPG
cylinder has around 14 kg of liquefied petroleum gas. Multiply number of
cylinders used in a year by 14 and add the resulted value in the calculation. Step 2 – Calculation Methodology; 1) Electricity : Input
value (in KWh/Yr) X 0.85 (Emission Factor) = Output value in (Kg of CO2) 2) Petrol: Input
Value(In Litres/Yr) X 2.296(Emission Factor) = Output value in (Kg of
CO2) 3) Diesel: Input
Value(In Litres/Yr) X 2.653 (Emission Factor) = Output value in (Kg of
CO2) 4) LPG: Input
Value(In Kg/Yr) X 2.983 (Emission Factor) = Output value in (Kg of CO2) 5) Carbon Footprint : Add
(1+2+3+4) = Output value in (Kg of CO2) |
Source: CO2 emission factor database, version 06,
CEA (Government of India), http://www.cea.nic.in/reports/planning/cdm_co2/cdm_co2.htm § Motor gasoline/ Petrol = 2.296 kg CO2 per
liter, Source: Emission factors are taken from the file “Emission factors from
across the sector -tool”, extracted from
http://www.ghgprotocol.org/calculation-tools/alltools § Diesel= 2.653 kg CO2 per litre, § Liquefied petroleum gas (LPG) = 2.983 kg CO2 per
kilogram, |
|
|
Author |
Year of Publication |
Carbon Footprint
Calculations based on |
SOURCE |
|
|
Carbon Footprints Excluding
the Operational Stage |
Carbon Footprints from the
Building Operational Stage |
|||
|
S G Deshmukh |
2015 |
Yearly Consumption x Per
unit CO2 emission (Kg) Per Unit CO2 emitted (Kg) § Electricity = 0.82 § Diesel = 2.34 § petrol = 2.34 § LPG = 2.91 5. Paper = 2.90 |
Trees help reduce carbon
footprint by absorbing the co2 emissions. It is estimated that on an average
a tree is able to absorb about 10 Kg
of co2 per year. There are about 10,000 plants on the campus. Each plant is able to absorb
about 10 Kgs of CO2. Thus, total carbon absorbed 10,000 x 10 kg = 100,000 kgs
= 100 tonnes of co2. |
Source not mentioned |
|
Kaveri Patil, Aparajita Chattopadhyay |
2011 |
consumer survey, carried out
by National Sample Survey Organisation (NSSO) of Government of India between
July 2009 and June 2010 (66th Round NSSO, 2010). Total 100855 number of
sampled household were surveyed for NSS 66th round, out of which the sample
size was 59119 and 41736 for rural and urban households respectively |
The emission coefficients are sourced from Venkataraman et al. (2010), Mestl and Eskeland (2009) and Parikh J. et al. (2009). The emission coefficients
by fuel type used in this paper are 1.614 and 3.102 tons of CO2 per tons of
coal and petroleum products, respectively, and 0.0021 tons of CO2 per cubic
metre of natural gas. Coal based electricity production in India had emission factor of
approximately 1214gCO2/KWh at generation in 2003-05 (IEA, 2007). However, not
all electricity is from coal, and the average for India in 2003-05 was
929gCO2/kWh |
|
2.2. Selection of emission factors from existing literature
2.2.1. Factors of emission for electricity use
Analysis of data received from literature studies produces a huge difference in quantification results. The factor of CO2 emission for electricity generation and transmission, on which the entire quantification process depends, ranges from 0.716 to 0.929 kgCO2/KWH, even 1.59 for coal-based generations. This is primarily because of various reasons like place of generation, source of electricity (Coal/hydel/Renewable, etc.), transmission system, age of generation plant, and technical conditions adhered to during production of electricty. The conditions of generation in India are hugely different from those in USA or China or Europe, or any other place. Logically it would be erroneous to use coefficient factor given by international and other standards. It is best to find the coefficient of emission of the electricity generation plant from where the electricity is being used. Another primary reason for variation in CO2 emission factor in existing papers is the time frame of the different research papers – the value of emission factor changes over time. With the government upgrading all plants and taking all necessary measures to reduce emission, the coefficient of emission from electric generation plants is continuously reducing. The CEA, in 2022-23, has recorded the national average emission factor for CO2 as 0.716KgCO2/KWH, considering all types of electric generation units in India, including conventional sources like hydel and thermal power plants and renewable energy (RE) production Central Electricity Authority (2023). It is logical to use the emission factor for the generation plant where-from electricity is drawn for the chosen site. But in the absence of this information, this paper opts for the projected national average (0.716KgCO2/KWH) as per CEA.
2.2.2. Factors of emission for cooking fuel use (LPG)
The fifth “National Family Survey 2019-2021 (NFHS-5)” Ministry of Health and Family Welfare (2021), as per research carried out by the “Ministry of Health and Family Welfare”, 89.7% of urban households cook using clean fuel. Cooking with clean fuels like LPG, PNG, or electricity is becoming more and more common. LPG is a universally accepted cooking fuel in urban households and will very soon become the only option (other than electricity – which is studied as a separate parameter in this study) as a cooking fuel. So, with this scenario in India, this paper limits its study to only LPG as a cooking fuel in Urban households and skips all other options. Compact 5 kg cylinders of LPG are available for usage in mountainous, rural, and inconvenient locations; 14.2 kg cylinders are available for home use; and 19kg and 47.5kg cylinders are offered for commercial along with industrial utilization, respectively. For LPG calculations in this study, one LPG cylinder is assumed to hold 14.2 kg of LP gas.
A comparative study of Greenhouse gas emission profile of LPG and other sources of energy in India and North America is provided in Table 4. The GHG Protocol Emission Factor from Cross sector Tools, March 2017 states that CO2 Emission factor for Liquified Petroleum Gas (LPG) is 1.612 Kg/Litre Protocol (2017). The options for cooking fuel are the traditional ones like firewood, coal, kerosene, dung-cakes, etc., and the non-traditional ones like LPG, Ethanol, and electricity Gould and Urpelainen (2018). Traditional solid fuel for cooking purposes is recognized globally as a severe health hazard Lim et al. (2012).
Table 4
|
Table 4 GHG Emission Profiles: LPG & Other Energy Sources - India, Japan, North America |
|||
|
Cooking Fuel |
India |
Japan |
North America |
|
Kerosene |
1.23 |
|
|
|
Wood (Traditional) |
3.29 |
|
|
|
Wood (Traditional) with carbon credit |
0.66 |
|
|
|
Crop Residue |
5.19 |
|
|
|
Crop Residue |
2.01 |
|
|
|
with carbon credit |
|
|
|
|
Dung Mud Stove |
7.57 |
|
|
|
Dung Mud |
1.41 |
|
|
|
with Carbon Credit |
|
|
|
|
Electric Coil |
2.51 |
|
|
|
LPG |
1 |
|
|
|
Induction |
|
0.93 |
1.07 |
|
High Efficiency Natural Gas |
|
0.95 |
0.86 |
|
Source (Incorporated & WLPGA) |
|||
2.2.3. Factors of emission due to fuel consumption of vehicles during idling time
The study of emissions by vehicles owned by the residents or household is restricted to only emissions by the same vehicles when inside the building site. The paper assumes that vehicles when inside the site are at idling phase, i.e. not moving, and for the simplicity of calculations ignore the very little amount of movement inside the site. Though a lot of research paper and studies are there on consumption of petrol/diesel while the vehicle is running or moving, very few research work have been done on consumption of petrol/diesel by a vehicle during idling time i.e. when it is not moving. A comparative study of fuel consumption during idling time by various petrol vehicles is given in a research paper written by Niraj Sharma et al. Sharma et al. (2015). As per the paper, Idling Fuel consumption of vehicles in India is as follows Table 5.
Table 5
|
Table 5 Summary of Mean Consumption of Petrol Vehicles Tested at Idling time |
||||
|
Sr. No. |
Vehicle category |
No. of vehicles Tested |
Mean fuel consumption (ml/10
min) |
Name of the City |
|
1 |
Four wheeler |
30 |
99.5 |
Bhopal |
|
|
|
49 |
88 |
Chandigarh |
|
|
|
18 |
107.3 |
Pune |
|
|
|
13 |
112.8 |
Chennai |
|
|
|
4 |
81.7 |
Kolkata |
|
|
|
29 |
98.6 |
Delhi |
|
2 |
3 Wheeler |
20 |
40 |
Bhopal |
|
3 |
2 Wheeler |
26 |
26.9 |
Bhopal |
|
|
|
22 |
25.3 |
Chandigarh |
|
|
|
11 |
22.3 |
Pune |
|
|
|
28 |
22.8 |
Chennai |
|
|
|
19 |
21.2 |
Vadodara |
|
|
|
5 |
27.6 |
Kolkata |
|
|
|
11 |
20.7 |
Delhi |
|
Source Sharma et al. (2015) |
||||
As per this paper, the mean value of consumption of petrol by motorcycles and cars across India is 0.14 litre / hour and 0.60 litre / hour Table 6. The same study when done in Kolkata gave the mean values as 0.17 litre / hour for motorcycles and 0.49 litre / hour for cars Table 7.
Table 6
|
Table 6 Mean Value of Consumption of Petrol by Motorcycles and Cars in India |
|||
|
Mean Value of consumption of
Petrol in India |
Motorcycles (Petrol) |
0.14 |
litre/hr |
|
|
Cars (Petrol) |
0.6 |
litre/hr |
|
Source Sharma et al. (2015) |
|||
Table 7
|
Table 7 Mean Value of Consumption of Petrol by Motorcycles and Cars in Kolkata |
|||
|
Mean Value of consumption of
Petrol in Kolkata |
Motorcycles (Petrol) |
0.17 |
litre/hr |
|
|
Cars (Petrol) |
0.49 |
litre/hr |
|
Source Sharma et al. (2015) |
|||
The academic paper by Shailesh Telang (2011) titled “Carbon Footprint Calculation – A Small Introduction of ISO14064” fixes emission coefficient factor from automobile petrol consumption to 2.296 and puts calculation methodology as–
Emission due to Petrol = Input Value (in Litres / YR) x 2.296
(Emission Coefficient of petrol)
= Output Value (in KgCO2)
Emission due to Diesel = Input Value (in Litres / YR) x 2.653
(Emission Coefficient of diesel)
= Output Value (in KgCO2)
Emission factors included in Table 8 are used in all emissions calculations in the India GHG Program's 2015 India-specific Road Transport Emission Factors Program (2015), which was authored by Stakeholder Consultation and published by the India GHG Program Secretariat.
Table 8
|
Table 8 Emission Factor of Automobile Fuel |
|
|
FUEL TYPE (Four Wheelers) |
CO2
Emission |
|
Emission factor for Petrol
(Motor Gasoline) |
2.27
KgCO2/litre |
|
Emission factor for Diesel |
2.64
KgCO2/litre |
|
Emission Factor for CNG |
2.69
KgCO2/litre |
|
Source Program (2015) |
|
2.2.4. Factors of emission from Respiration
CO2 is one of the common human breath components. In their research paper titled ‘Human metabolic emissions of carbon dioxide and methane and their implications for carbon emissions,’ the authors Li et al. (2022) found that the average CO2 emission was around 28.7 g/h/person ± 2.1 g/h/person after quantifying the exhaled, dermal, and total body emission rates in a controlled environment. The authors clarify that the whole-body emission rate of CO2 varies with changes in humidity level, temperature variations, diet, and other things. According to the researchers, this emission process can be thought of as a cycle in which CO2 is taken from the atmosphere through photosynthesis, transformed into plant matter, then consumed by humans (either directly from plants or through animals that are fed plants), and finally returned to the atmosphere as CO2. Most authors point out that this part of emission by humans is not considered with importance by the IPCC (2001) and are not taken into account when formulating strategies for mitigation of GHG emission. The cyclical process is frequently regarded as an activity that contributes "no net carbon flux to the atmosphere" Li et al. (2022), West and Marland (2009). However, all authors iterate that this component of CO2 flux must be recognized in all analysis, quantification, and mitigation of CO2 emission scenario. Y. T. Prairie and C. M. Duarte in their research paper ‘Direct and indirect metabolic CO2 release by humanity’ Duarte (2007) calculated ‘direct’ metabolic CO2 emission, i.e. emission due to metabolism released by humans and domesticated animals through respiration and ‘indirect’ metabolic CO2 emission, i.e. emission due to decomposition of their resulting wastes to find out their contribution of humanity to CO2 footprint. West and Marland (2009) in their study "The human carbon budget: an estimate of the spatial distribution of metabolic carbon consumption and release in the United States," claims that, as food is now farmed in concentrated agricultural regions and transported over long distances for human consumption in metropolitan areas, they tried to support their claim that the transfer of carbon for human consumption and its emission through metabolism processes is becoming more complicated.
2.2.5. Factors of emission from Potable Water Production
Carbon emission associated with potable water production (PWP) and its supply needs to be recognized as an important concern Akash and Chakraborty (2024). Many researchers have studied GHG or CO2 emissions from urban water systems- showing without any doubt that this emission is considerable and needs more research and proper mitigation. Zihan Gui, Heshuai Qi, and Shiwu Wang in their research paper titled ‘Study on Carbon Emissions from an Urban Water System Based on a Life Cycle Assessment: A Case Study of a Typical Multi-Water County in China’s River Network Plain’ have investigated the water-carbon nexus of a small county in China called Yiwu City Gui et al. (2024). The authors clearly state that carbon emission from water system in any city or place depends a lot on the water sources and distribution system and will vary greatly from emission of water supply system of any other place due to these reasons. However, Kolkata, the location of our research, is extremely similar to Yiwu City, where the research has been conducted. Both locations are on a river plain with low-lying terrain and a wealth of surface and groundwater resources. Because of their similar topographies, it can be predicted that the emission patterns from the water supply systems in Yiwu City and Kolkata will be very similar. The results of a study conducted in Yiwu can therefore serve as a guide for a study conducted in Kolkata. Considering high-quality water supply scenario, the paper finds carbon footprint intensity of Yiwu City as 0.90 kgCO2eq/m3 = 0.0009 kgCO2eq/litre of supplied water. The paper takes into account all four stages abstraction and treatment, distribution, consumption, along with wastewater treatment for quantification method.
Akash and Chakraborty (2024) do a more elaborate and detailed quantification of emissions for potable water production (PWP) for a place in Chittagong Bangladesh. This research paper specifies that emissions from ground water (GW) and surface water (SW) are considerably different – emissions from SW are much higher due to more contamination than in GW. Air fallout, surface runoff, and human activities like industry and agriculture all contribute to the increased contamination of surface water. Because dirt naturally filters it, ground water is less likely to get contaminated. This paper calculates carbon footprint of potable water to 0.18 kgCO2eq/m3 from treatment of raw water, 0.37 kgCO2eq/m3 for transmission from treatment plant to booster pumps, 0.06 kgCO2eq/m3 to distribute water in the city by booster pumps, 0.02 kgCO2eq/m3 for lifting to/ overhead tanks and, lastly, the maximum share of 17.97 kgCO2eq/m3 for purification by boiling at the household level. The total, considering all stages, comes to 18.526 kgCO2eq/m3, and excluding the last two stages comes to 0.61 kgCO2eq/m3 = 0.00061 kgCO2eq/litre. The paper does not consider emission at the wastewater treatment phase for quantification method.
As per the “Bureau of Indian Standards”, IS:1172-1993 Standards (1993), houses with a complete flushing system shall have a minimum water supply of 200 “Liters Per Capita Per Day (LPCD)” for domestic usage. Additionally, it states that for “Low-Income Groups (LIG)” and “Economically Weaker Sections (EWS)”, the amount of water that must be provided to a home might be lowered to 135 lpcd. Shaban (2007) in their paper titled ‘Water Consumption Patterns in Domestic Households in Major Cities’ found out water consumption patterns in different cities of India including Kolkata Table 9. The authors suggest that water consumption by household depends strongly on water availability. Water is abundant in Kolkata and that’s why the consumption of water is maximum in Kolkata.
Table 9
|
Table 9 Domestic Water Consumption Per Household and Per Capita Per Day (in Litres) |
||
|
Cities |
Per
Household |
Per
Capita Mean |
|
Delhi |
377.7 |
78 |
|
Mumbai |
406.8 |
90.4 |
|
Kolkata |
443.2 |
115.6 |
|
Hyderabad |
391.8 |
96.2 |
|
Ahmedabad |
410.9 |
95 |
|
Kanpur |
383.7 |
77.1 |
|
Source Shaban (2007) |
||
However, there are other recommendations – like The National Commission on Urbanization (1998) says that per capita water requirement should be minimum of 90-100 litres per day.
This paper tried to identify sources or activities of a urban residential buildings which are responsible for CO2 emission. This study was based totally on existing literature review. The sources or activities are identified as follows - 1) Electricity consumption, 2) fuel consumption for cooking, 3) fuel consumption for vehicles, 4) respiration, 5) potable water consumption. Other information like emission factors and consumption factors derived from existing primary and secondary literature for application in this paper are shown in Table 10
Table 10
|
Table 10 Information on Emission Factor and Consumption Factor Derived from Existing Literature |
||||
|
Sources of Emission |
Consumption Factor |
Source |
Emission Factor |
Source2 |
|
Electricity |
- |
- |
0.716 KgCO2/KWH) |
CEA Central Electricity Authority (2023) |
|
Cooking Fuel (LPG) |
Each Cylinder in India
contains 14.2 Kg LPG |
- |
1.612 Kg/Litre |
The GHG Protocol Emission
Factor from Cross sector Tools, March 2017 Protocol (2017) |
|
4-wheelers Fuel consumption
during Idling time (petrol) |
0.6 litre/hr |
Niraj Sharma et al. Sharma (2015) |
2.27 KgCO2/ litre |
India GHG Program's 2015
India-specific Road Transport Emission Factors Program (2015) |
|
4-wheelers Fuel consumption
during Idling time (petrol) |
0.14 litre/hr |
Niraj Sharma et al. Sharma (2015) |
2.27 KgCO2/ litre |
India GHG Program's 2015
India-specific Road Transport Emission Factors Program (2015) |
|
Respiration |
- |
- |
28.7 g/h/person = 251 KgCO2/ person/annum |
Li et al. (2022) |
|
Potable Water Production |
||||
3. Methodology
3.1. Identification of sources of CO2 emission
Review of previous research work has shown that some of them have considered some sources of CO2 emission from urban residential building in the operation stage and skipped few. Since this paper deals with only the CO2 emission from operation phase of the building, it was felt that all the sources mentioned in different research work should be ideally taken into consideration. To find causes or sources of CO2 emission the research was designed to wholly depend on previous and existing research papers. As previously stated, CO2 emission from respiration by residents have never been taken into account in existing research papers - considering it as a part CO2 Cycle. However, testing of quantitative balance between CO2 emission by the building through different activities of the tenements and again consumption of CO2 by the building itself by photosynthesis by plants inside the site being the primary objective of the thesis, it was decided to include respiration by the residents as a source of CO2 emission and consider it for all quantification method. After going through all information from various primary and secondary literature, the sources of emission are identified as 1) electricity, 2) fuel for cooking, 3) fuel for vehicles, 4) respiration, 5) potable water production.
3.2. Quantification method for energy consumption
The primary objective of the paper being identification of sources of CO2 emission from urban multi-storied and multi-tenement residential buildings, the approach adopted for the research was set as – 1) to obtain all information regarding sources/causes of CO2 emission from the residential building in the operation stage from existing primary and secondary literature review, 2) to obtain all CO2 emission factors from secondary literature, 3) to obtain energy consumption data like electricity usage and fuel usage for cooking through Sample Survey of existing residential buildings, 4) to assume time span of use of vehicles inside the site, as information regarding this is neither available in existing research papers nor is it possible to find through survey, 5) to calculate emission of CO2 from respiration using information on number of residents from sample survey and emission factors from existing research papers and 6) to calculate emission of CO2 from potable water production by using national standards ( information regarding usage of potable water could not be found out though sample survey as in Kolkata and Newtown there are no meter facilities for water consumption ). Information from monthly or quarterly electricity consumption were added, to calculate the total yearly consumption in terms of Kilo-watthour in each of the buildings or flats.
3.3. Quantification method for CO2 Emission
3.3.1. Emission due to consumption of electricity
The total yearly electricity consumption of individual single tenement and multistoried multi-tenement residential buildings in Kilowatt-hour was obtained from input data through sample survey and this yearly consumption (KWH) was multiplied by CO2 emission factor (0.716 KgCO2/KWH) of electricity generation, national average, 2023, provided by Central Electricity Authority, Government of India, to give the total annual CO2 emission from electricity consumption by the building or individual flat. All CO2 emission is finally converted & tabulated in terms of “TonneCO2/annum”. Same process is also applied to find the total CO2 emission from electricity consumption from common areas of multi-tenement buildings, as in all multi-storied buildings the flats and common areas are separately connected to different meters Figure 2.
Figure 2
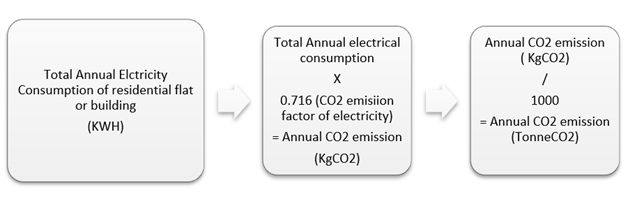
|
Figure 2 Method of Quantification of CO2 Emission due to Electricity consumption from Urban Residential Building |
![]() … Eq 01
… Eq 01
Where Ee = Total annual emission from a building in the operation phase due to consumption of electricity measured (TonneCO2/annum)
Ce = Total annual consumption of electricity (KWH)
0.716 KgCO2 per KWH is the average emission factor considered for generation and transmission of electricity in India Authority (2021) or 0.716 KgCO2 is emitted when 1 KWH of electricity is generated and transmitted to the end user in India.
3.3.2. Emission due of Fuel consumption for cooking (LPG)
Consumption calculation: LPG consumption, by the residentials flat / flats for cooking purpose, in terms of cylinders, were added to calculate the total yearly consumption in terms of cylinders in each tenement or flat of the buildings. The total yearly LPG consumption in terms of cylinders was multiplied by 14.2 kg (in India all domestic cylinders carry 14.2 Kg of LPG) to give total annual consumption of LPG in terms of Kilogram.
Emission calculation: The total annual consumption of LPG (Kg) is multiplied by 2.985 (emission factor of LPG = 2.985 KgCO2/ kg of LPG) to give total annual CO2 emission due to LPG consumption for cooking by that household or flats Figure 3.
Figure 3
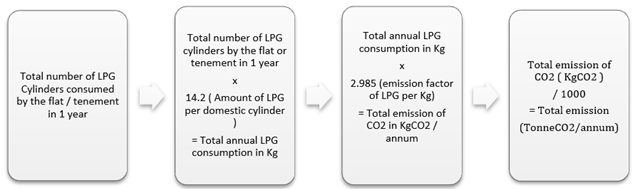
|
Figure 3 Method of Quantification of CO2 Emission due to LPG consumption from Urban Residential Building |
![]() …..Eq 02
…..Eq 02
Where El = total annual CO2 emission from building in operation stage from cooking using LPG measured (TonneCO2/annum)
Cl = total consumption of LPG (kg)
![]() …. Eq 03
…. Eq 03
Nl = total number of LPG cylinders consumed annually
2.985 KgCO2 is the emission factor of LPG or 2.985 KgCO2 is emitted when 1 kg of LPG is burnt.
14.2 Kg is the amount of LPG in one cylinder in India
3.3.3. Emission from Fuel Consumption by 2-wheelers AND 4-Wheelers (Idling Time)
During initial discussions with residential tenements in Kolkata, it was found out that many residents, due to non-availability of car parking space inside the plot, park their cars or motorbikes permanently on the road in front of their building/plot. Though this paper aims to study all emissions by residents of a building from it’s own plot, it still becomes rationale to consider all these cases of parking adjacent to the plot be included as being parked inside the plot and considered for this study. With an eye on future building designs, it can be assumed that all buildings will have enough parking space for all residents so that we can have more carriage space on the road. In some cases it was also found that some other car or motorcycle, not belonging to a resident. is parked inside the plot. As information on this issue is unpredictable and difficult to obtain, for this research paper, it is assumed that, no outside cars or motor-cycles are parked inside the site and hence they are not considered for quantification.
This Study being concerned with CO2 emission only inside the building / plot, it becomes important to concentrate on emission effects of vehicles due to Idling time and movement inside the plot and skip, for simplicity of the study and quantification method, all emissions outside the plot. Furthermore, with limitations of this study being set to only small urban plots, the movement inside a small plot can be considered as negligible and emission due to fuel burning inside the plot can be restricted to only Idling time due to parking, i.e, when the engine is on and the car is not moving. It is generally observed that Parking Time of a car inside a small plot varies considerably and it is not feasible to find out the exact time of Idling. This research work assumes that a car takes maximum 5 minutes from start of ignition to going out of the plot and again 5 minutes from entering the plot to putting the ignition off. This makes the total times as 5+5 = 10 min for every time a car is started and taken out of the plot and again enters the plot and parks the car. It is also observed that the number of times the car is taken out of the plot and enters the building varies considerably. Again, for the simplicity of the study, it is assumed that a car is generally taken out and enters the plot two times daily. With this assumption, the total time of idling due to parking becomes 10 +10 = 20 minutes per day. So, for this particular study, which is to find out emission of CO2 from a residential building on a small plot during its operation stage only, assumptions related to emission due to presence of automobiles, are taken as -
1) automobiles considered for calculations are all 4 wheelers cars or 2 wheelers (and not other variants as bus, trucks, vans, auto rickshaws, etc.). Other vehicles come inside the plot very rarely and are not considered for this study.
2) Since many nations including India, with the sole objective to reduce emission, are contemplating on ban on all sale of diesel cars from 2027, cars considered for calculation of emission are only Petrol cars.
3) Cars are generally taken out of the plot 2 times a day on an average,
4) For all calculation, it is assumed that the cars when inside the plot and with engine running, they are not moving, i.e. they are in a ‘Idling condition’.
5) The maximum idling time for cars and motorcycles inside the plots is assumed as 5 minutes each time it is ignited to be taken out and same 5 minutes each time it enters the plot and is parked. Same is assumed for a motorcycle. So the total time taken, every time a car or motorcycle is taken out, is 10 minutes.
6) So the total time of idling time of a vehicle inside a plot is 20 minutes per day = 20 x 365 minutes per annum = 7300 minutes per annum = 121.67 hr per annum.
With idling time of the vehicles fixed (121.67 hour per annum), there comes the need to ascertain the consumption of petrol / diesel during this idling time of the vehicles. This is derived from research work of Niraj Sharma and Ravi Shankar Chalumuri Sharma (2015) as shown in Table 11. Annual petrol consumption by a 2-wheeler during idling inside a plot, considering total idling time as 121.67 hours per annum (20 minutes per day) comes to 121.67 hours x 0.14 litres / hour = 17.034 litres. Annual petrol consumption by a 4-wheeler during idling inside a plot, considering total idling time as 121.67 hours per annum (20 minutes per day) comes to 121.67 hours x 0.60 litres / hour =73.002 litres.
Table 11
|
Table 11 Mean Value of Consumption of Petrol during Idling Time in India |
|||
|
Mean Value of consumption of
Petrol in Kolkata |
Motorcycles (Petrol) |
0.14 |
litre/hr |
|
|
Cars (Petrol) |
0.6 |
litre/hr |
|
Source - Sharma (2015) |
|||
The emission factor of petrol for 2 wheelers and 4 wheelers are derived from The India GHG Program – India specific Road Transport Emission Factors, 2015, written by Stakeholder Consultation and publishes by India GHG Program Secretariat uses emission factors as presented in Table 12 for all calculations for emissions –
Table 12
|
Table 12 CO2 Emission Factor for Petrol |
|
|
FUEL TYPE (Four Wheelers) |
CO2 Emission Factor |
|
Emission factor for Petrol |
2.27 KgCO2/litre |
|
(Motor Gasoline) |
|
|
Emission factor for Diesel |
2.64 KgCO2/litre |
|
Emission Factor for CNG |
2.69 KgCO2/litre |
The rate of consumption of petrol by a 2-wheeler being 0.14 litre/ hour and total time of idling by a 2- wheeler being 121.67 hour per year, the total consumption of fuel by a 2 – wheeler comes to 0.14 x 121.67 litre = 17.034 litres / annum. Considering CO2 emission factor as 2.27 KgCO2/litre, annual emission from petrol consumption by a 2 – wheeler comes to 17.034 litrs / annum x 2.3 KgCO2/litre = 39.18 KgCO2 per annum = 39.18 / 1000 TonneCO2/annum= 0.039 TonneCO2/annum. Information is obtained from the sample survey about the number of 2 wheelers parked by the owner of the building / flat inside the plot. The number of 2-wheelers parked inside the plot is taken and multiplied by .039 TonneCO2/annum to give the total emission of CO2 by all motor-cycles owned by the owner of the building / flat and parked inside the plot.
![]() …. Eq 04
…. Eq 04
Where Emp = Total annual CO2 emission from consumption of Petrol by motorcycles owned by residents during the operation stage of the building and inside the site (TonneCO2/annum)
Nm = total number of motorcycles owned by the resident and parked inside the site.
0.039 KgCO2/motorcycle is the calculated average CO2 emitted annually by one motorcycle driven by petrol assuming that –
1) this CO2 emission is only inside the site,
2) this CO2 emission is only when the motor cycle is driven by petrol,
3) this CO2 emission calculated considering only idling time, i.e. when the engine is on but the motorcycle is not moving
4) the motorcycle is taken out of the site only two times daily considering the yearly average,
5) it takes 5 minutes to take the motorcycle from the parking lot to out of the site and again 5 minutes to enter and park it in its parking lot,
6) Emission factor of petrol is 2.27 KgCO2/litre
7) Consumption of petrol by a motorcycle during Idling time is 0.14 litre/hour
The rate of consumption of petrol by a 4-wheeler being 0.6 litre/ hour and total time of idling by a 4- wheeler being 121.66 hour per year, the total consumption of fuel by a 4 – wheeler comes to 0.6 x 121.66 litre = 72.996 litres / annum. Considering CO2 emission factor as 2.27 KgCO2/ litre, annual emission from petrol consumption by a 4 – wheeler comes to 72.996 litrs / annum x 2.3 KgCO2/litre = 167.89 KgCO2 per annum= 167.89 / 1000 TonneCO2/annum= 0.168 TonneCO2/annum. Information is obtained from the sample survey about how many 4 wheelers is there parked by the owner of the building / flat inside the plot. The number of 4-wheelers parked inside the plot is taken and multiplied by 0.168 TonneCO2/annum to give the total emission of CO2 by all 4 -wheelers owned by the owner of the building / flat and parked inside the plot.
Considering 4 wheelers or precisely cars, the equation is set as –
![]() …. Eq 05
…. Eq 05
Where Ecp = Total annual CO2 emission from consumption of Petrol by cars owned by residents during the operation stage of the building and inside the site (TonneCO2/annum)
Nc = total number of cars owned by the resident and parked inside the site.
0.168 KgCO2/motorcycle is the calculated average CO2 emitted annually by one car driven by petrol assuming that –
1) this CO2 emission is only inside the site,
2) this CO2 emission is only when the car is driven by petrol,
3) this CO2 emission calculated considering only idling time, i.e. when the engine is on but the car is not moving
4) the car is taken out of the site only two times daily considering the yearly average,
5) it takes 5 minutes to take the car from the parking lot to out of the site and again 5 minutes to enter and park it in its parking lot,
6) Emission factor of petrol is 2.27 KgCO2/litre
7) Consumption of petrol by a car during Idling time is 0.6 litre/hour
3.4. Emission by Respiration of Residents
Emission by respiration from human respiration inside the flat or plot is calculated by multiplying the number of residents in the flat by emission factor of 251 KgCO2/ person/annum Li et al. (2022).
Emission per annum by Respiration from a single tenement building / flat
= 251 KgCO2/person/annum x number of residents in the building / flat.
![]() …. Eq 06
…. Eq 06
Where Er = total emission by all the residents of the building (TonneCo2/annum)
Nr = total number of residents
251 CO2/person/annum is the Co2 emission factor from respiration
3.5. Emission for consumption of potable water (PWP)
Potable Water Production (PWP) is an intrinsic part of urban development – aa huge quantity of processed water is needed for the urban dwellers. This process of good quality potable water production involves considerable amount of energy consumption and consequently GHG emissions. The literature study, previously mentioned, showed that CO2 emission factor and quantity from PWP depends a lot on source of water, geographical conditions, distribution system, etc. This research paper finds the case study of Yiwu county in China Gui et al. (2024) for CO2 emission from PWP very interesting. The source of water for extraction in Yiwu is surface water like a network of rivers. In Newtown, which is the site for this research, potable water is also extracted from river Ganga. The other attribute, the geographical conditions of both places are also same- both being plain land with lots of water bodies. Thus, it becomes logical to adopt the results of this paper by Gui et al. (2024), for use in this research work. The CO2 emission factor of 0.90 KgCO2/m3 is hence adopted for quantification process of Co2 emission from PWP in this research paper. For the calculation of CO2 emission, other than emission factor, quantity of water consumed by the residents were also required. However, Kolkata of Newtown do not have any meter system for water connection. So, recording of water consumption by individual flats or houses was not feasible. There was also no information in existing literature. This research work, in this scenario, decides to rely on Indian Standards and consider the average water consumption from Bureau of Indian Standards, IS:1172-1993 Standards (1993). The average water consumption from the public water supply distribution system is taken as 200 litres/person/day. The total annual quantity of water consumption by the building is given by –
![]() .. Eq 07
.. Eq 07
Where Cw = Total water consumption through urban potable water distribution system (Litres)
Nr = total number of residents
200 litres/ person/day is the water consumption average given by Bureau of Indian Standards
![]() …. Eq 08
…. Eq 08
Where Ew = Total annual CO2 emission from PWP from the building due to water consumption in TonneCO2/annum
Cw = Total water consumption through urban potable water distribution system (Litres) 0.0009 KgCO2/litre is the emission factor of CO2e from potable water distribution.
The total annual CO2 emission from a multi-storied, muti-tenement residential building during its operation phase is given by the equation –
![]() …Eq 09
…Eq 09
Where Eb =Total annual CO2 emission from the building in operation phase measured (TonneCO2/annum)
Ee = Total annual emission from a building in the operation phase due to consumption of electricity measured (TonneCO2/annum)
El = total annual CO2 emission from building in operation stage from cooking using LPG measured (TonneCO2/annum)
Emp = Total annual CO2 emission from consumption of Petrol by motorcycles owned by residents during the operation stage of the building and inside the site (TonneCO2/annum)
Ecp = Total annual CO2 emission from consumption of Petrol by cars owned by residents during the operation stage of the building and inside the site (TonneCO2/annum)
Er = total emission by all the residents of the building (TonneCo2/annum)
Ew = Total annual CO2 emission from PWP from the building due to water consumption in TonneCO2/annum
4. Sample Survey
4.1. Design of sample survey
The primary objective of this paper is to investigate Quantitative and Qualitative parameters of Household carbon Footprint. The sample surveys were carried out over a period starting from 2020 to 2024 searching for input data on variables as stated in Table 13. In order to search for input data the survey questionnaire was divided into certain variables. For the quantification process consumption quantities of different energies were required as per activities already identified in research design– 1) Electricity & 2) LPG for cooking. Information on water consumption was not taken into account as there are no meters for measuring its consumption. However, since quantification of emission from water consumption needed the number of residents and also emission from respiration requires the number of residents, so information on family members was included in the questionnaire. Calculation of emission from cars and motorcycles needed the number of cars and motorcycles parked inside the plot, this information was also included in the questionnaire.
Table 13
|
Table 13 Variable Description of Sample Survey Input |
|||||
|
Sl.
No. |
Variables |
Question
/ Description |
Units |
Data
Source |
Notes |
|
1 |
Plot
Area |
Plot
area (including covered and open areas) |
Square
feet |
Sanction
Plan |
Respondents
were all conversant with Square feet and not Square meter. Values in square
feet were converted to square meter. |
|
2 |
Covered
Area of the Flat / Building |
Covered
area of building – in case of a single tenement building. Flat
Area – in case of a multi-tenement building |
Square
feet |
Sanction
Plan |
|
|
3 |
Covered
Common area (for multi-tenement
buildings) |
Covered
Common areas including Parking areas, Staircase, common service areas. |
Square
feet |
Sanction
Plan |
|
|
4 |
Income |
Total
Income of all occupants |
Rupee |
||
|
5 |
Electricity
Consumption |
Unit
Consumed over a period of 12 consecutive months |
KWH |
Electricity
Bills |
Kolkata
has monthly electricity bills, whereas Saltlake and Newtown has quarterly
electricity bills. For Quarterly bills (Saltlake and Newtown) , values of
quarterly bills were converted to monthly values. |
|
6 |
Fuel
Consumption for cooking |
Number
of Cylinders consumed over a period of 12 months |
Number |
Count
of Cylinders |
Assumption
by respondents as there is no exact recording |
|
7 |
Fuel
consumption by automobile |
Number
of 2-wheelers & 4-wheelers parked inside plot or on the road just outside
the plot. Also number of other vehicles if parked inside the plot |
Number |
Count
of automobiles |
Parking
is mostly inside the plot. However in some cases they are parked on the road
just outside the plot. |
|
8 |
Emission
through respiration |
Number
of residents |
Number |
||
Consumption values in all these stages are found out from direct questionnaire survey and/or application of consumption factors obtained from literature review. The CO2 emission values by these sources are quantified mathematically by using the consumption values and respective emission factors as derived and mentioned in chapter 3 namely research methods and design. Further finding correlation between CO2 emission and building parameters, like floor area, plot area, number of residents, etc. also becomes necessary and hence it is also studied at length to find any correlation.
As discussed in the research design and methodology chapter that considering there are various types of buildings as per location, forms, structures and use groups, this sample survey limits its boundaries to ‘location - Urban’, ‘use group - Residential’ and ‘Form/Structure – Multi-storied & Multi-tenement’. Though Newtown is the site for this research work, it being a city developed few years back and still in infancy, the sample study was not limited to only Newtown – but extended to Kolkata also.
4.2. Building Typology studied in Survey
As has been already mentioned that this research work is being done to study quantification method of CO2 emission from a multi-tenement residential building in an urban area. To do this, and for a better understanding of the subject, it was decided not to restrict the study to multi-tenement buildings only, but extend it to single tenement buildings and individual flats. The sample survey was distributed into different building typologies depending upon tenement sizes, building structures and location Table 14.
Table 14
|
Table 14 Sample Survey Done as Per Building Typology |
|||
|
Building Typology |
TENEMENT TYPE |
Sample number |
Location |
|
CATEGORY I |
Single Tenement - |
4 |
Kolkata & Bidhan Nagar |
|
|
Individual houses |
|
|
|
|
(2 storied) |
|
|
|
CATEGORY II |
Individual Flats in
Multi-tenement building |
4 |
Bidhan Nagar |
|
|
(4 storied) |
|
|
|
CATEGORY III |
Whole Building |
5 |
Newtown |
|
|
(Entire Plot, Individual
Flats and Common Areas) |
|
|
|
|
(Garage + 3 storied) |
|
|
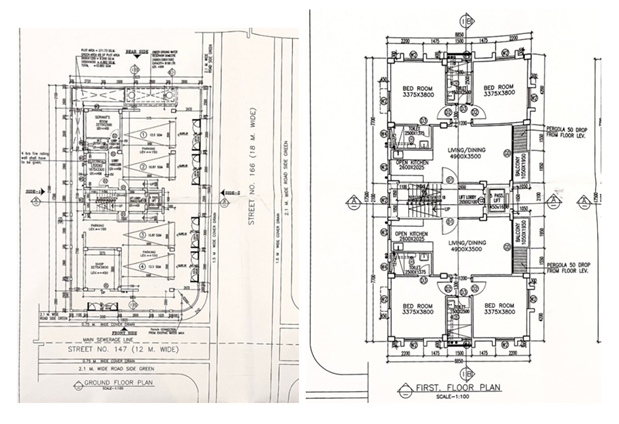
Residential single tenement individual buildings were selected in different locations of Kolkata and Bidhan Nagar (saltlake), whereas, flats in multi-storied and multi-tenement buildings were selected in Bidhan Nagar (saltlake) and Newtown. The building in Newtown could be studied fully - meaning whole building could be studied except one flat, where owner not present. All data of this building, related to this research study, was also obtained. The whole building, in Newtown, surveyed for sample study had Plot area 271.73 sqm. The ground covered area is 149.446 sqm. which is approximately 55% of the plot area, which is as per NKDA building rules the maximum ground coverage for residential plots less than 1500 sqm. The ground open space is 122.284 sq, which is about 45% of the plot area. Green open spaces (not paved) was introduced by NKDA to improve environmental aspects of urban areas like storm water management, heat-island, greeneries, etc. It is fixed at minimum 4% of the plot area. The green open space in this plot is 10.88 sqm, which is exactly the minimum area required (4%). The plot area, ground coverage, open spaces and other dimensions of open spaces of the plot like front open space, rear open space and side open spaces are mentioned in the Table 4.3. The front open space is 2.0 m, rear open space is 2.10 m, the side open spaces are 2.470 m and 1.3 m. Table 15 and Figure 4
Table 15
|
Table 15 Particulars of Whole Building studied in New Town |
|||||
|
Areas
& Dimensions |
As
per stipulated NKDA Building Rules |
||||
|
Measurements
as per site |
%
coverage as per Site |
||||
|
Quantity |
Units |
||||
|
Plot
Area |
271.73 |
sqm |
|||
|
Covered
Area |
149.446 |
sqm |
55.00% |
Maximum
Ground Coverage for Residential Plots below 1500 sqm= 55% |
|
|
Open
Area |
122.284 |
sqm |
45.00% |
45% |
|
|
Green
Area |
10.88 |
sqm |
4.00% |
4% |
|
|
Open
Paved Area |
111.404 |
sqm |
41.00% |
No
Rules |
|
|
Front
Open Space |
2000 |
meters |
1.2
M for residential buildings up to 15.1 m height |
||
|
Rear
Open Space |
2.100 |
meters |
2.0
M for Residential Plots upto 300 sqm and building height 15.1 M |
||
|
Side
Open Space (1) |
2.470 |
meters |
0.8
meters for plot area less that 300 sqm and building height less that 15.1
meters |
||
|
Side
Open Space (2) |
1.300 |
meters |
2.4
meters building height less that 15.1 meters |
||
Figure 4
|
Figure 4 Ground Floor Plan & Typical Plan for 1st, 2nd and 3rd Floors |
5. Analysis and Results
5.1. Identification of sources of emission
After going through all information from various primary and secondary literature, the sources of CO2 emission from urban multi-tenement multi-storied buildings are identified as 1) electricity, 2) fuel for cooking, 3) fuel for vehicles, 4) respiration, 5) potable water production. This identification process was totally based on previous research works. There area some other activities mentioned in research papers like – emission due to consumption of paper and emission due to respiration of pets. There is chance of other activities emitting CO2 gas from the building. However, this paper studies only 5 activities as mentioned earlier and skips other activities due to lack of data and information.
5.2. Results of Quantification
Emission from five types of different sources namely electricity, cooking, automobiles, respiration and water consumption are tabulated Table 12 and compared. It is found that the maximum operation phase CO2 emission in almost all urban single tenement individual buildings and flats in urban multi-storied multi-tenement buildings occur from electricity consumption followed by respiration, fuel consumption for cooking, water consumption and lastly fuel consumption by automobiles. The quantification results show that, when all samples are considered together, approximately 38.94% of the total CO2 emission is from consumption of electricity, 13.32% from respiration, 6.68% from consumption of LPG for cooking, 3.45% from water consumption and lastly 2.60% from petrol consumption by automobiles owned by the residents of residential buildings. When data from only single tenement individual buildings (category 1 – sample 01,02,03 & 04) were studied for quantification the total emission came to 34.416 TonneCO2/ annum. The total emission from electricity was 24.63 TonneCO2/ annum, 4.777 TonneCO2/annum from respiration, 2.882 TonneCO2/annum from cooking fuel, 1.248 TonneCO2/annum from water consumption and 0.879 TonneCO2/ annum from fuel consumption due to automobile idling time. The percentage distribution of emission from different sources were approximately 71.57% from electricity, 13.88% from respiration, 8.37% from cooking fuel and 3.63% from water consumption and 2.55% from automobile. Survey data from only flats in multi-tenement buildings (category 2), when tabulated, showed that the total emission came to 30.606 TonneCO2/annum. The total emission from electricity was 14.308 TonneCO2/ annum, 8.548 TonneCO2/annum from respiration, 3.798 TonneCO2/annum from cooking fuel, 2.234 TonneCO2/annum from water consumption and 1.718 TonneCO2/annum from fuel consumption due to automobile idling time. The percentage distribution of emission from different sources were approximately 46.75% from electricity, 27.93% from respiration, 12.41% from cooking fuel, 7.30% from water consumption and 5.61% from automobile idling time fuel consumption (Figure 06).
Survey data when considering multi-storied, multi-tenement whole buildings including common areas (category 3) were tabulated the total emission from building came to 14.404 TonneCO2/annum. The total emission from electricity was 6.080 TonneCO2/annum, 4.525 TonneCO2/annum from respiration, 1.738 TonneCO2/annum from cooking fuel, 1.183 from water consumption and 0.879 TonneCO2/annum from fuel consumption due to automobile idling time. The percentage distribution of emission from different sources were approximately 42.21 % from electricity, 31.42% from respiration, 12.07% from cooking fuel, 8.21% from water consumption and 6.10% from automobile idling time fuel consumption (Figure 07)
Study of emission distribution from different sources of a household when compared across different categories of buildings shows that in case of a single tenement individual building the percentage of emission from electricity is quite high (71.57%). The same value for flats in multi-tenement buildings is much lesser (46.75%) and when the whole building is considered along with common areas it becomes 42.25% The comparative values of distribution percentage of different sources from residential buildings in the operation stage, when compared across different categories are given in Table 16.
Table 16
|
Table 16 Distribution of CO2 Emission from Different Sources Across Different Categories of Residential Buildings |
||||||
|
Category |
Description of Household |
Electricity |
Cooking fuel (LPG) |
Fuel (petrol) consumption
for automobiles |
Respiration |
Water consumption |
|
(%) |
(%) |
(%) |
(%) |
(%) |
||
|
Category 1 |
Single tenement individual
buildings |
71.57 |
8.75 |
2.55 |
13.88 |
3.63 |
|
Category 2 |
Flats in multi-storied
multi-tenement building |
46.75 |
12.41 |
5.61 |
27.98 |
7.3 |
|
Category 3 |
Whole multi-storied
multi-tenement building including common areas |
42.21 |
12.07 |
6.1 |
31.42 |
8.21 |
|
The Mean Annual CO2 Emission Comes to 0.028
TonneCO2/sqm. of Plot Area of a Single Tenement Building |
||||||
The mean annual emission from a single tenement building comes to 0.026 TonneCO2/ sqm. of covered built-up area. However, when all flats in different locations and having different covered areas were analysed together, the mean CO2 emission came to 0.034 TonneCO2 /annum. The mean value of emission per unit covered area of the building / flat when compared gives a more or less close results Table 17. The mean value of annual CO2 emission comes to 0.031 TonneCO2/ annum/sqm.
Table 17
|
Table 17 Mean Value of CO2 Emission Per Unit Built-Up Area |
||
|
Category |
Description |
Mean Value of CO2
Emission (TonneCO2/annum/sqm) |
|
Category I |
Single-tenement |
0.028 |
|
|
Individual House |
|
|
Category II |
Flats in a multi-storied
building (Saltlake) |
0.039 |
|
Category III |
flats in a multi-storied
building (Newtown) |
0.028 |
|
Categories II & III
combined |
flats in a multi-storied
building (Saltlake & Newtown) |
0.033 |
|
Categories I, II &
III All Categories
combined |
Single tenement individual
house & Flats in multi-storied buildings |
0.029 |
6. Conclusion
Activities causing CO2 emission in urban multi-storied, multi-tenement residential buildings during the operation phase are several. This paper identifies five activities 1) electricity, 2) fuel for cooking, 3) fuel for vehicles, 4) respiration, 5) potable water production, which area acting as sources of CO2 emission. However, there can be more such activities emitting CO2 and more research work should be undertaken to find them. Emission due to electric consumption does not take place inside the premises and happens at the generation plant. However, this emission due to electric consumption has been considered in this paper as the building is solely responsible for it. CO2 emission due to respiration by residents is generally skipped by all researchers. This paper, for CO2 emission quantification process, takes into account this emission from respiration. This paper also identifies only LPG as a source of CO2 emission from cooking activity as existing literature reviews show that LPG has almost become the only form of cooking fuel in urban India, other than electricity, which has already been considered as a source of emission. Emission due to potable water consumption, which again is happening somewhere else and not in the premises, and is generally not considered by most researchers, has been considered by this paper. CO2 emission due to fuel consumption by automobiles owned by residents when used only inside the premises has been considered.
The process of selection of consumption quantity or factors of energy and associated CO2 emission factors in urban multi-storied, multi-tenement residential buildings during the operation phase are varied. Researchers have applied several methods to do the same. Relying on international standards or factors or coefficients in all probability gives erroneous results, not true to local level or even national level investigation. There is a need for immense study on these fields, especially in India - at the national level or at the state or local level, so that more authentic results are drawn in a research work. This paper quantifies consumption of energy and associated CO2 emission based on rates and factors derived from existing primary and secondary literature and they are as follows –
1) Electricity – emission factor = 0.716 KgCO2/KWH including production and transmission and considering all forms of electricity like thermal, hydel, RE, etc.
2) LPG – emission factor = 2.985 KgCO2/Kg of LPG
3) Petrol (only idling time considered)
· 2 Wheelers - consumption = 0.14 litre/hour
· 4 Wheelers - consumption = 0.6 litre/hour
Petrol emission factor = 2.27 KgCO2/litre
4) Respiration - emission factor = 251 KgCO2/person/annum
5) Potable Water production – consumption – 200 litres/person/day
Emission – 0.0009 KgCO2/litre of potable water including abstraction, treatment, distribution and wastewater treatment
The results of quantification show that, considering different activities in the operation phase of urban single tenement individual buildings and flats in urban multi-storied multi-tenement buildings, maximum CO2 emission takes place from electricity consumption followed by respiration, fuel consumption for cooking, water consumption and lastly fuel consumption by automobiles. When data from only single tenement individual buildings were studied for quantification the percentage distribution of emission from different sources were approximately 71.57% from electricity, 13.88% from respiration, 8.37% from cooking fuel and 3.63% from water consumption and 2.55% from automobile. Survey data from only flats in multi-tenement buildings when tabulated, showed that the percentage distribution of emission from different sources were approximately 46.75% from electricity, 27.93% from respiration, 12.41% from cooking fuel, 7.30% from water consumption and 5.61% from automobile idling time fuel consumption.
CONFLICT OF INTERESTS
None.
ACKNOWLEDGMENTS
None.
REFERENCES
Adalberth, K. (2000). Energy Use and Environmental Impact of New Residential Buildings. Lund: Lund University of Technology.
Akash, P. B., & Chakraborty, P. (2024). Assessment of Carbon Footprint of Potable Water Production: A Case from Bangladesh. Green Carbon, 2(3), 339–349. https://doi.org/10.1016/j.greenca.2024.06.006
Amose, T., & J, K. R. (2017). LPG Trend in Growing Economic Components of India. Shanlax
International Journal of Economics, 5(2), 5–7.
Atlantic Consulting. (2009). LPG's Carbon Footprint Relative to Other Fuels: A Scientific Review.
Gattikon, Switzerland: Atlantic Consulting.
Bureau of Indian Standards.
(1993). Indian Standard Code of Basic Requirements
for Water Supply, Drainage, and Sanitation (4th revision).
Carbon Solutions Ltd. (2009–2010). GHG Inventory Report for Electricity Generation and Consumption in
India, 2009–10.
Central Electricity Authority.
(2021). CO2 Baseline Database for the Indian Sector
- User Guide (Version 16.0). Ministry of Power, Government of India.
Central Electricity Authority.
(2023). CDM - CO2 Baseline Database for the Indian
Power Sector - User Guide (Version 19.0). Ministry of Power, Government of
India.
Deshmukh, S. G. (2015). Preliminary Report on Carbon Footprint. ResearchGate.
Duarte, Y. T. (2007). Direct and Indirect Metabolic CO2 Release by Humanity. Biogeosciences, 4, 215–217. https://doi.org/10.5194/bg-4-215-2007
Environmental Incorporated & WLPGA. (n.d.). LP Gas: An Energy Solution for a Low Carbon World - A Comparative Analysis Demonstrating the Greenhouse Gas Reduction Potential of LP Gas. WLPGA.
Feng, K. H. (2016). Carbon Implications of China's Urbanization. Energy, Ecology and Environment, 1, 39–44. https://doi.org/10.1007/s40974-016-0015-x
Gould, C. F., & Urpelainen, J. (2018). LPG as a Clean Cooking Fuel: Adoption, use, and Impact in Rural India. Energy Policy, 122, 395–408. https://doi.org/10.1016/j.enpol.2018.07.042
Gui, Z., Qi, H., & Wang, S. (2024). Study on Carbon Emissions from an Urban Water System Based on a Life Cycle Assessment: A Case Study of a Typical Multi-Water County in China's River Network Plain. Sustainability. https://doi.org/10.3390/su16051748
Gupta, M. D. (2011). Impact of Lifestyle Pattern on Energy Consumption and Carbon
Emissions: A View from India. Semantic Scholar.
Huang, R., & Zhao, S. (2018). Comparing Urban and Rural Household CO2 Emissions. MDPI Energies.
India GHG Program. (2015). The India GHG Program – India-Specific Road Transport Emission Factors, 2015.
Li, M., Bekö, G., Zannoni, N., Pugliese, G., Carrito, M., Cera, N., & Nobre, P. (2022). Human Metabolic Emissions of Carbon Dioxide and Methane and Their Implications for Carbon Emissions. Science of The Total Environment, 833. https://doi.org/10.1016/j.scitotenv.2022.155241
Lim, S. S., Vos, T., Rodgers, A., & Campbell, H. (2012). A Comparative Risk Assessment of Burden of Disease and Injury Attributable to 67 Risk Factors and Risk Factor Clusters in 21 Regions, 1990–2010: A Systematic Analysis for the Global Burden of Disease Study 2010. Lancet, 380, 2224–2260.
Lin, B., & Liu, H. (2015). CO2 Emissions of China's Commercial and Residential Buildings: Evidence and Reduction Policy. Building & Environment, 92, 418–431. https://doi.org/10.1016/j.buildenv.2015.05.020
Ministry of Health and Family
Welfare, Government of India. (2021). National
Family Health Survey (NFHS-5), 2019–21.
Mittal, M. L., & Sharma, C.
(2012). Estimates of Emissions from Coal-Fired
Thermal Power Plants in India. ResearchGate.
National Sample Survey Office,
Ministry of Statistics and Programme Implementation, Government of India.
(2012). Energy Sources of Indian Households for
Cooking and Lighting, 2009–10 (NSS 66th round).
Patil, K., & A, C. (2013). Household Energy Use and CO2 Emission: Differentials and Determinant in India. ResearchGate.
Ramesh, T., Prakash, R., & Shukla, K. (2012). Life Cycle Analysis of Residential Buildings with Different Envelopes and Climates in the Indian Context. Applied Energy, 193–202. https://doi.org/10.1016/j.apenergy.2011.05.054
Shaban, A., & R, N. (2007). Water Consumption Patterns in Domestic Households in Major Cities. Economic & Political Weekly, 2190–2197.
Shang, M., & Guo, H. (2021). A study of Carbon Emission Calculation of Residential Buildings Based on Whole Life Cycle Evaluation. E3S Web of Conferences, 7. https://doi.org/10.1051/e3sconf/202126104013
Sharma, N., Chalumuri, R. S., Kumar, P. P., & Singh, A. (2015). Evaluation of Idling Fuel Consumption of Vehicles Across Different Cities. Recent Advances in Traffic Engineering (RATE 2015). ResearchGate.
Telang, S. (2011). Carbon Footprint Calculation – A Small Introduction to ISO 14064. Green Clean Guide.
The GHG Protocol. (2017). The GHG Protocol Emission Factor from Cross-Sector Tools.
West, T. O., & Marland, G. (2009). The Human Carbon Budget: An Estimate of the Spatial Distribution of Metabolic Carbon Consumption and Release in the United States. Biogeochemistry, 94, 29–41. https://doi.org/10.1007/s10533-009-9306-z
World LPG Association (WLPGA). (2020). Charting the Success of LPG Distribution in India - An Exceptional Energy Case Study, July 2020. World LPG Association (WLPGA).
Yan, X., & Chen, S. (2018). Carbon Footprints of Urban Residential Buildings: A Household Survey-Based Approach. MDPI. https://doi.org/10.3390/su10041131
Zheng, F., & Wang, Y. (2023). Research on the Correlations Between Spatial Morphological Indices and Carbon Emission During the Operational Stage of Built Environments for Old Communities in Cold Regions. MDPI. https://doi.org/10.3390/buildings13092222
Zimmerman, H. J. (2005). Benchmarks for Sustainable Construction: A Contribution to Developing a Standard. Energy and Buildings, 37, 1147–1157. https://doi.org/10.1016/j.enbuild.2005.06.017
 This work is licensed under a: Creative Commons Attribution 4.0 International License
© Granthaalayah 2014-2025. All Rights Reserved.