CFD MODELING AND SIMULATION OF A COUNTERCURRENT REACTOR OF HIDROTREATMENT PROCESS WITH JATROPHA CURCAS L. VEGETABLE OIL
Pablo Vizguerra Morales 1![]()
![]() ,
Fabian Salvador Mederos Nieto 1
,
Fabian Salvador Mederos Nieto 1![]()
![]()
1 Mexican Center for Cleaner Production
(CMPL), National Polytechnic Institute Mexico City, Mexico
|
|
|
ABSTRACT |
|
|
In this work,
a microscale countercurrent reactor was analyzed and simulated in CFD, and
the results were compared with a drained bed reactor (TBR) which is held in
the CMP+L research center. The importance of this study is to find the
mathematical model of the countercurrent reactor to produce clean fuels from
Jatropha Curcas L. vegetable oil and in the future scale it to an industrial
level. For the hydrotreatment process, a commercial CoMo/γ-Al2O3
catalyst was used, and Jatropha Curcas L vegetable oil was used as raw
material. The operating conditions that were considered for the CFD
simulation were temperature 380 °C, pressure 8 MPag, LHSV 8.0 h−1. The
reactor model considers a reaction mechanism 13 hydrocracking reactions of
triglycerides towards renewable fuels. The CFD simulation was carried out in
Fluent 18.2 in a transient state and in 3 dimensions, considering the
standard k-ϵ turbulence model, the Eulerian multiphase model and the
porous medium model, obtaining results very similar to the experimental ones,
with a conversion of triglycerides of 0.996% and the retention time of the
liquid temperature was 169 seconds and in the simulation is 200 seconds, the
molar concentration profiles of the products were obtained whereby this model
can be applied to the industrial scale. |
|||
|
Received 03 April 2024 Accepted 01 May 2024 Published 21 May 2024 Corresponding Author Pablo
Vizguerra Morales, p.vizguerramorales@ugto.mx
DOI 10.29121/IJOEST.v8.i3.2024.596 Funding: This research
received no specific grant from any funding agency in the public, commercial,
or not-for-profit sectors. Copyright: © 2024 The
Author(s). This work is licensed under a Creative Commons
Attribution 4.0 International License. With the
license CC-BY, authors retain the copyright, allowing anyone to download,
reuse, re-print, modify, distribute, and/or copy their contribution. The work
must be properly attributed to its author.
|
|||
|
Keywords: Hydrotreatment,
CFD, Reactor |
|||
1. INTRODUCTION
In recent years, energy demand is increasing worldwide and
in the country of Mexico due to demographic growth and social developments. The
main source of energy generation to satisfy current needs is fossil fuels,
which gives rise to the emission of CO2, which causes environmental
problems such as climate change and global warming, droughts throughout the
country of Mexico. Therefore, it is important to counteract the environmental
impact and alternative fuel sources such as renewable energy such as wind, solar
and biofuels must be generated. Biofuels result mainly from biomass raw
materials, biomass is that which is free of sulfur, nitrogen and ash; Thus, the
emissions are also free of SOx, NOx and CO2. Biofuels are an option
for the sustainable development of the country through the diversification of
the energy matrix and also mitigate climate change. The classification of
biofuels depends mainly on the type of feedstock, conversion technology, product
formed and carbon source Gollakota et al. (2015).
The main obstacle for these biofuels is the degradation of biomass. The bio-oil obtained from the pyrolysis of lignocellulosic biomass is unstable and has a high water content, low pH, high viscosity, low calorific value and is highly corrosive. The bio-oil produced is composed of 300 different organic compounds, consisting of (20-30% by weight) water, (15-30% by weight) lignin fragments, (10-20% by weight) aldehydes. , (10-15% by weight) carboxylic acids, (5-10% by weight) carbohydrates, (2-5% by weight) phenols, (1-4% by weight) furfurals, (2-5% by weight) alcohols and ketones (1-5% by weight), Oasmaa et al. (2002).
To overcome the deterioration of biomass oil properties
due to pyrolysis, an improvement process is required before application. One
study explained the chemistry, the difficulties in determining rate constants,
the problems associated with the presence of oxygen, and the growing concern
for improving fuels derived from coal and biomass, Furimsky
(1983). The HDO process was reported to be similar to
hydrodenitrogenation (HDN) but 10 times more efficient than the later technique
with vanadium nitride catalysts, Oyama
(1996).
Mahfud (2007) explained the oxygen removal process from bio-oil using high-pressure HDO in the presence of suitable catalysts such as cobalt-molybdenum or nickel-molybdenum. It was reported that bio-oil upgrading by HDO requires relatively high pressures in the range of 7-20 MPa to convert some of the bio-oil compounds that have low HDO reactivity into O-free products, Gutiérrez & Kaila (2009). Wildschut et al. (2009) performed HDO experiments in an autoclave using glucose and cellobiose as model compounds for the sugar fraction of the pyrolysis oil. They found that there is no formation of benzene in the product in the HDO reaction of phenol over Ru/C catalyst, Wildschut et al. (2010).
Another study is on the improvement of catalysts with bio-oil for motor fuels, two paths were suggested for the improvement process: hydrodeoxygenation and zeolite cracking Mortensen et al. (2011). A subsequent HDO study of bio-oils was with fast pyrolysis of various feedstocks using carbon as a catalyst support Elkasabi et al. (2014).
Several HDO studies have been carried out with CFD simulation, a work carried out CFD simulations on the effect of catalysts (Pt/Al2O3, Ni–Mo/Al2O3, Co–Mo/Al2O3) on the hydrodeoxygenation process of bio-oils, Gollakota et al. (2015). Other work focused on CFD modeling on external mass transfer and intraparticle diffusion effects in supercritical hydrogenation of sunflower oil, Guardo et al. (2007).
One study was on the CFD analysis of the heat coefficient during palm oil hydrotreatment, Mendoza, C. C., & Vélez, J. F. (2015). CFD Analysis of the Heat Transfer Coefficient During Hydrotreatment of Palm Oil, 08 -12-2015, V Symposium Internacional de Biofábricas, Virtual.. A recent study on CFD in modeling a hydrotreating reactor to produce renewable diesel from non-edible vegetable oils was carried out, Muharam et al. (2017). Muharam worked on the phenomenological model to predict the performance of a sludge bubble column reactor for green diesel production, Muharam et al. (2019). A study on CFD simulations of catalytic hydrodeoxygenation of bio-oil using Pt/Al2O3 in a fixed bed reactor, Subramanyam et al. (2015).
Therefore, this study aims to numerically investigate the hydrodynamics and mass transfer of the Jatropha Curcas L. oil hydrotreatment process in a countercurrent microscale reactor in the presence of a commercial Co–Mo/γ-Al2O3 catalyst using the CFD tool, this to produce clean fuels and be able to know the mathematical model to scale this process to an industrial level.
This work consists of the following objectives: 1) Find the mathematical model of hydrodynamics and mass transport that represents the hydrotreatment process in the countercurrent microreactor using CFD to validate the results with experimental data and 2) perform the simulation with Fluent of the kinetics of the reaction mechanism with 13 reactions and find the residence time of the liquid phase, validating with experimental data.
3) have a good product yield (clean fuels) and scale this process to an industrial level.
Mathematical formulation and problem statement
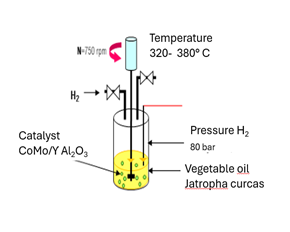
The experimental
reactor with which the CFD simulation was compared is a dynamic drained bed
reactor (TBR) where it carries out the hydrotreatment process, using a
commercial CoMo/γ-Al2O3 catalyst, Jatropha Curcas vegetable oil
was used as raw material. L, shown in Figure 1, Mederos Nieto et al. (2020). The
reactor that was simulated is a microscale countercurrent reactor with a
diameter of 1.3 cm and a height of 30 cm. It was simulated in Fluent version
18.2 of Ansys and is shown in Figure 2. The operating
conditions that were considered for the simulation were temperature 380 °C,
pressure 8 MPag, LHSV 8.0 h−1.
Figure 1
|
Figure 1 Experimental TBR Reactor for the HDO Process. |
Figure 2

|
Figure 2 Microscale Counter Current Reactor. |
The models that
were used in this work, the Eulerian multiphase model, the standard κ –
ε turbulence model, the species transport model, and the Eddy dispassion
concept – Finite rate, predict the behavior of the reactor under different
reaction conditions. The reactor dimensions and operating conditions are shown
in Table 1.
Government
Equations
The equations are those involved in solving the
problem posed by the physical phenomenon to be modeled: Reynolds average
Navier-Stokes equation (RANS), standard κ - ε turbulence model,
equations of state and coupled methods. Fluent uses the finite volume method as
a numerical method to solve the governing equations, ANSYS (2016).
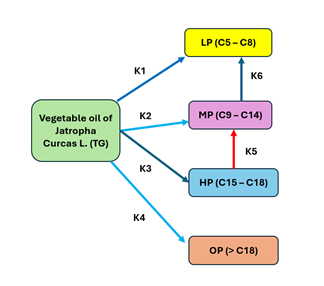
Reaction mechanism
The direct global
kinetics of Jatropha oil for the triglycerides triolein and tristearin, where
the components are represented as: reactive (TG), LP (nC5 – C8), MP (nC9-C14),
HP (nC15-C18) and OP (> nC18), shown in Figure 3, Anand & Sinha (2012).
Table 1
|
Table 1 Reactor Conditions and Operation |
|
|
Reactor |
|
|
Scale |
Micro |
|
Mode |
Countercurrent |
|
Type |
Isothermal |
|
Operation
variables |
|
|
Pressure (Pa) |
800000 |
|
Temperature
(°C) |
320 -380 |
|
LHSV (h-1) |
8 |
|
H2/
Oil volume ratio (NL/L) |
1500 |
|
Gas Phase |
|
|
Mass
Flow (Kg/s) |
1.1 x10
-6 |
|
Composition (%mol) |
100 |
|
Liquid
Phase |
|
|
Mass flow (Kg/s) |
4.8 x10 -6 |
|
Composition
(% mol) |
100 |
|
Solid phase |
|
|
Particle
shape |
Trilobe
Extrudate |
|
Catalyst Mass (g) |
2 |
|
Catalyst
volume (cm3) cm3 |
2.4 |
|
Inert volume (cm3) |
2.4 |
|
Bed
Volume (cm3) |
3.7165 |
|
Bed Length (cm) |
2.8 |
|
Equivalent
particle diameter (cm) |
0.052 |
|
Reactor dimensions |
|
|
Inside
(cm) |
1.3 |
|
Total Lenght (cm) |
30 |
Figure 3
|
Figure 3 Kinetic Model for the Hydroconversion of Jatropha Curcas L. Oil |
2. MATERIALS AND METHODS
The study of hydrodynamics and mass transfer
was carried out with Fluent 18.2, which gave us the product profiles of the
reaction, a computer with 12 GB RAM and an AMD A 8 processor was used. The
essential parameters to carry out a study of this type were to obtain an
adequate mesh that represents our study area, propose models in Fluent to
represent our process, turbulent model, porous model and multiphase model.
2.1. CFD simulation
2.1.1. Preprocessing
1)
The
reactor meshing was performed in the ICEM software, and the boundary conditions
were also introduced to the mesh. The mesh was made with a hexahedral structure
with a size of 99669 cells (Figure 4) and the boundary conditions are shown in Figure 5.
2)
A mesh
quality study was also carried out with three different mesh sizes with
hexahedral structure with three sizes, 49835, 182608 and 99669 cells, taking
the mesh of 99669 cells for the study to reduce computational work.
Figure 4

|
Figure 4 Mesh Generated for the Reactor. |
Figure 5

|
Figure 5 The Boundary Conditions in the Mesh. |
3)
The
simulation in Fluent was carried out in 3 dimensions, in a transient state,
using the standard viscous model, the Eulerian multiphase model, for the gas,
liquid and solid phases and the Porous Medium model.
4)
The
kinetic parameters of the simulated chemical reaction are shown in Table 2.
5)
The
boundary conditions used in Fluent are shown in Table 3.
Table 2
|
Table 2 Reaction Mechanism and Kinetic Parameters Used. |
||||
|
Reactions |
Ao (h-1) |
Ea (Kj/mol) |
ΔHR (MJ/mol) |
|
|
1 |
C57H110O6 +
3H2 = 3 C17H35COOH + C3H8 |
9.8723 x10⁹ |
128.4918 |
-1.0235 |
|
2 |
C57H110O6
+ 12H2 = 3 C18H38 + 6H2O + C3H8 |
157.559 |
12.7951 |
-1.262 |
|
3 |
C57H110O6
+ 6H2 = 3 C17H36 + C3H8+
3 H20 + 3 CO |
157.559 |
12.7951 |
-0.8039 |
|
4 |
C57H110O6
+ 3 H2 = 3 C17H36 + 3CO2 + C3H8 |
157.559 |
12.7951 |
-0.9294 |
|
5 |
C57H110O6 +
6H2 = 3 C8H18 + 3C9H20
+ 3CO2 + C3H8 |
1.1004 x10²¹ |
277.9029 |
-1.0574 |
|
6 |
C57H110O6
+ 10H2 = 5 C6H14 + 3C5H12
+ 3CO2 + 3C3H8 |
3.4066 x 10⁹ |
127.1923 |
-1.0574 |
|
7 |
C17H35COOH
+ 3H2 = C18H38 + 2H20 |
127.1923 |
90.7014 |
-0.0795 |
|
8 |
C17H35COOH + H2
= C17H36 + CO + H20 |
127.1923 |
90.7014 |
0.0732 |
|
9 |
C17H35COOH
= C17H36 + CO2 |
127.1923 |
90.7014 |
0.0317 |
|
10 |
C18H38 + C8H18
= C26H54 + H2 |
6.1409 × 10¹² |
173.1821 |
0.0299 |
|
11 |
C18H38
+ H2 = C12H26 + C6H14 |
1.3894 × 10¹⁹ |
260.85 |
-0.0424 |
|
12 |
C17H36 + H2 = C8H18
+ C9H20 |
0.0424 |
2.1775 |
-0.043 |
|
13 |
C12H26
+ H2 = C8H18 +C4H10 |
0.2817 |
6.5759 |
-0.0202 |
6)
The convergence criteria were 0.001 for all
equations, with 1600 seconds of simulation.
Table 3
|
Table 3 Boundary Conditions for CFD Simulation |
|||||
|
Zones |
Boundary
condition |
Values |
Pressure
(Pa) |
Temperature
(°C) |
Species
(mole fraction) |
|
Oil inlet (TG) |
Mass flow (kg/s) |
4.80E-06 |
100 |
380 |
0.0006 |
|
H2
inlet |
Mass
flow (kg/s) |
1.10E-06 |
200 |
320 |
1 |
|
Gas product outlet |
outlet pressure (Pa) |
0 |
0 |
650 |
- |
|
Liquid
products output |
outlet
pressure (Pa) |
0 |
0 |
680 |
- |
|
Wall |
Wall |
Stationary |
0 |
680 |
- |
2.1.3. Post Processing
7)
The
profiles and temperature contours of the countercurrent microscale reactor will
be obtained, as well as the velocity vectors, product profiles and the
triglyceride conversion profile, which will be validated with the experimental
data carried out in the TBR reactor.
3. RESULTS AND DISCUSSIONS
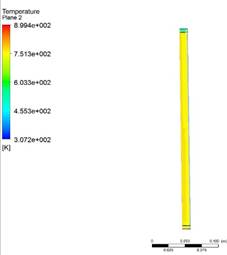
The simulation and
analysis of the conversion of triglycerides was carried out in the
countercurrent micro reactor using Jatropha oil and hydrogen as raw materials. Figure 6 shows the temperature contour on the walls of the
reactor varying from 700 to 870 °K and varying with time and at the end of the
simulation 1600 seconds it reaches that maximum temperature, in the first 200
seconds it reaches 673 °K and as time progresses it reaches a temperature of
873°K (600° C). Figure 7 shows the contour of the mass fraction of
triglycerides (Jatropha oil) after 1600 seconds of reaction where it is
observed that the oil has had its highest conversion. Only an amount remains
between 5 and 10 cm from the reactor inlet with a mass fraction of 0.0009972.
The oil conversion takes place at the beginning of the reactor and reaches the
end of the reactor fully consumed.
Figure 6
|
Figure 6 Total Temperature Contour at 1600 Seconds. |
Figure 7

|
Figure 7 Mass Fraction Contour of TG (Jatropha Oil) |
Figure 8 shows the contour
of the water vapor product after 1600 seconds of simulation where there is a
higher concentration in the central part of the reactor approximately 15 cm, At
the upper outlet of the reactor there is a mass fraction of 0.015, The formation
of water vapor takes place almost entirely in the center of the reactor where
there is greater contact of reactants and phases. The contour of the mass
fraction of the product (C17H36) is also observed, which
are HP, between 10 and 15 cm, taking the top of the reactor as the axis, there
are mass fractions of 0.003871 and 0.0161. That is to say, the reaction
increases as the triglycerides decrease in the reactor, since the contact
between phases is slower due to the porosity. At the reactor outlet there is a
mass fraction of 0.01548.
Figure 9 shows the contour of the mass fraction of the product (CO) after 1600
seconds of simulation between 10 and 15 cm, there are mass fractions of
0.009509 and at the exit of the reactor in the upper part there is a mass
fraction of 0.0091. The greatest formation of CO takes place in the part of the
central where there is more contact between phases.
Figure 8

|
Figure 8 Contour of a) Mass Fraction of Water Steam and b) Mass Fraction of Product (C17H36) at 1600 Seconds of Simulation. |
It is important to compare the results of the
microscale reactor, using the experimental data of the TBR reactor against the
Matlab simulation by Mederos et al. (2020) and against this CFD simulation work with Fluent. Figure 10 shows the
comparison of the simulation in Fluent, considering the reaction mechanism
shown above, the simulation lasted 1600 seconds, considering conditions of
temperature of 380 °C and pressure of 8 MPa. Similar behaviors were observed
between the experimental part, Matlab and Fluent, only that the CFD simulation,
it is observed in the simulation that after 200 seconds the reaction begins to
start due to the fact that it must meet the residence time and this ensures the
contact of the two reactants.
Figure 9

|
Figure 9 Mass Fraction Contour of CO Product. |
Figure 10

|
Figure 10 Molar Concentration Profile of TG (C17H36O2) at 1600 Seconds of Simulation Compared to Experimental Data and Matlab Simulation, and CFD |
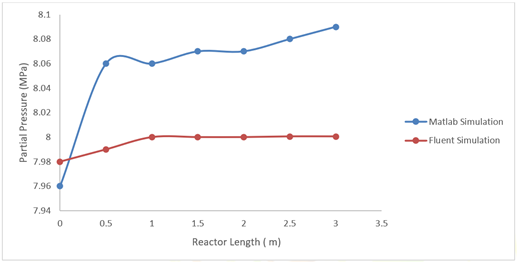
Figure 11 shows the partial pressure profile and the
pressure comparison between the two simulations, these tend to behave in the
same way, the simulation in Matlab has a total pressure that varies from 8.06
MPa to 8.08 MPa. For the simulation in Fluent it varies between 7.99 MPa to 8
MPa, there is not much difference between the simulations, there is more
pressure drop in the simulation in Fluent.
Figure 11
|
Figure 11 Pressure Profile at 1600 Seconds of Simulation Compared to those of the Matlab Simulation and the CFD Simulation. |
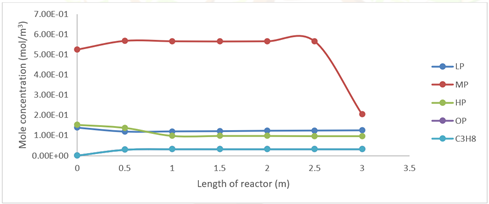
Figure 12 shows the variation of light (LP), medium (MP),
heavy (HP), oligomerized (OP) and propane products throughout the reactor at
1600 seconds of simulation in Fluent in the liquid temperature part of the
reactor, the molar concentration of LP is 0.125, MP is 0.205, HP is 0.097, OP
is 0.0325 and propane is 0.0325 mol/m3.
Figure 12
|
Figure 12 Profile of LP, MP, HP, OP and Propane Products at 1600 Seconds of Simulation. |
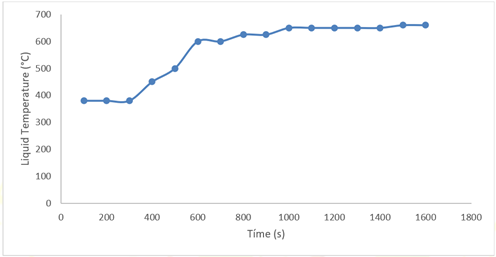
Figure 13 shows the retention time that was calculated to be
168.96 seconds for the liquid temperature, and in the simulation, is observed
that it is 200 seconds, because this is where the process temperature begins to
rise.
Figure 13
|
Figure 13 Temperature Profile in the Liquid Phase Versus Simulation Time at the Bottom of the Countercurrent Micro Reactor. |
Table 4 shows the concentrations of light, medium, heavy and oligomerized products for the countercurrent reactor. In the countercurrent reactor there are more medium products with an average concentration of 0.525 kmol/m3, light products with a concentration of 0.107, and heavy products with a concentration of 0.0982. and oligomerized of 0.0325.
Table 4
|
Table 4 Product Concentrations After 1600 Simulation. |
||||
|
|
Light |
Medium |
Heavy |
Oligomerized |
|
0 |
1.26E-01 |
5.25E-01 |
1.53E-01 |
1.00E-03 |
|
0.05 |
1.05E-01 |
5.68E-01 |
1.38E-01 |
3.00E-02 |
|
0.1 |
1.06E-01 |
5.66E-01 |
9.82E-02 |
3.25E-02 |
|
0.15 |
1.07E-01 |
5.65E-01 |
9.82E-02 |
3.25E-02 |
|
0.2 |
1.09E-01 |
5.66E-01 |
9.81E-02 |
3.25E-02 |
|
0.25 |
1.10E-01 |
5.66E-01 |
9.71E-02 |
3.25E-02 |
|
0.3 |
1.12E-01 |
5.66E-01 |
9.70E-02 |
3.25E-02 |
4. CONCLUSIONS and RECOMMENDATIONS
This work is novel because the CFD simulation and modeling of the countercurrent microreactor was carried out using Fluent software, this for the hydrotreatment and hydrocracking process of Jatropha Curcas L vegetable oil and was verified with the results of the research center's reactor.
The simulation conditions in Fluent that were
considered; temperature 380 ° C, pressure 8 MPa, LHVS of 8.0 h-1. The results were validated with the
experimental results of a drained bed reactor (TBR) for the hydrotreatment
process for Jatropha Curcas L. vegetable oil, is observed that it gives good
approximations.
The
reactor model considers a reaction mechanism of 13 reactions of triglycerides
towards renewable fuels, these products are divided into light, medium, heavy
and oligomerized. The simulation was carried out in Fluent 18.2 in a transient
state and in 3 dimensions, considering the standard k-ϵ turbulence model.
The
Eulerian multiphase models and the porous medium model were used, obtaining
results very similar to the experimental ones and the simulation in Matlab,
showing a good approximation with the experimental results that can be applied
to scale the rector to an industrial level.
A good conversion of triglycerides of 99.0% and concentration of products in the liquid phase of the reactor was also shown. The calculated residence time was 168.96 seconds, which is very similar to the simulation since from there the temperature of the process begins to rise. of HDO and demonstrates that the simulation is successful for this type of reactors and processes.
CONFLICT OF INTERESTS
None.
ACKNOWLEDGMENTS
Acknowledge to Dr. Fabian Salvador Mederos Nieto for his support in this work, as well as to the research project SIP - IPN- 20231028.
REFERENCES
ANSYS, Inc., (2016). ANSYS Fluent User’s Guide. Canonsburg, PA, USA.
Anand, M., & Sinha, A.K. (2012). Temperature-Dependent Reaction Pathways for the Anomalous Hydrocracking of Triglycerides in the Presence of Sulfided Co–Mo–Catalyst. Bioresour Technol, 126, 148–155. https://doi.org/10.1016/j.biortech.2012.08.105
Elkasabi, Y., Mullen, C. A., Pighinelli, A. L. M. T., & Boateng, A. A. (2014). Hydrodeoxygenation of Fast Pyrolysis Bio – Oils from Various Feedstocks Using Carbon – Supported Catalysts, Fuel Processing Technology, 123, 11-18. https://doi.org/10.1016/j.fuproc.2014.01.039
Furimsky, E. (1983). Chemistry of Catalytic Hydrodeoxygenation, Catalysis Review, 25, UK, 421 - 458. https://doi.org/10.1080/01614948308078052
Gollakota, A. R. K., Subramanyam, M D., Kishore, N., & Gu, S. (2015). CFD Simulations on the Effect of Catalysts on the Hydrodeoxygenation of Bio-Oil, Royal Society of Chemistry, 5, 41855. https://doi.org/10.1039/C5RA02626A
Guardo, A., Casanovas, M., Ramírez, E., Recasens, F., Magaña, I., Martínez, D., & Larrayoz, M.A. (2007). CFD Modeling on External Mass Transfer and Intra-Particle Diffusional Effects on the Supercritical Hydrogenation of Sunflower Oil, Chemical Engineering Science 62, 5054–5061. https://doi.org/10.1016/j.ces.2007.01.080
Gutiérrez, A., & Kaila, R. K. (2009). Hydrodeoxygenation of Guaiacol on Noble Metal Catalysts, Catalysis Today, 147(3-4), 239 – 246. https://doi.org/10.1016/j.cattod.2008.10.037
Mahfud, F. H. (2007). Hydrotreatment of Fast Pyrolysis Oil Using Heterogeneous Noble Metal Catalysts, PhD Thesis, University of Gronigen : A Handbook, CPL Press, Newbury, UK, 1. https://doi.org/10.1021/ie9006003
Mederos Nieto, F. S., Elizalde Martínez, I., Trejo Zárraga, F., Hernández-Altamirano, R., & Alonso-Martínez, F. (2020). Dynamic Modeling and Simulation of Three-Phase Reactors for Hydrocracking of Vegetable Oils, Reaction Kinetics, Mechanisms and Catalysis 131, 613–644. https://doi.org/10.1007/s11144-020-01896-4
Mendoza, C. C., & Vélez, J. F. (2015). CFD Analysis of the Heat Transfer Coefficient During Hydrotreatment of Palm Oil, 08 -12-2015, V Symposium Internacional de Biofábricas, Virtual.
Mortensen, P. M., Grunwaldt, J. D., Jensen, P. A., Knudsen, K. G., & Jensen, A. D. (2011). A review of catalytic upgrading of Bio – oil to engines fuels, Applied catalysis A: general, 407, 1-19. https://doi.org/10.1016/j.apcata.2011.08.046
Muharam, Y., Nugraha, O. A. & Leonardi, D. (2017). Modelling of a Hydrotreating Reactor to Produce Renewable Diesel from Non-Edible Vegetable Oils, Chemical Engineering Transactions, 56, 1561–1566. https://doi.org/10.3303/CET1756261
Muharam, Y., Putri, A. D., & Hamzah, A. (2019). Phenomenological Model for the Prediction of the Performance of a Slurry Bubble Column Reactor for Green Diesel Production, Journal of Physics: Conference Series, 1349. https://doi.org/10.1088/1742-6596/1349/1/012057
Oasmaa, A., Meier, D., & Bridgwater, A. (2002). Fast Pyrolysis of Biomass: A Handbook, CPL Press, Newbury, UK, 1.
Oyama, S. T. (1996). The Chemistry of Transition Metal Carbides and Nitrides. Blackie Academic and Professional, Springer, Virginia, USA. https://doi.org/10.1007/978-94-009-1565-7_1
Subramanyam, M. D., Gollakota, A. R. K., & Kishore, N. (2015). CFD Simulations of Catalytic Hydrodeoxygenation of Bio–Oil using Pt/Al2O3 in a Fixed Bed Reactor, RSC Advances, 110, 90354–90366. https://doi.org/10.1039/c5ra14985a
Wildschut, J., Mahfud, F. H., Venderbosch, R. H., & Heeres, H. J. (2009). Hydrotreatment of Fast Pyrolysis Oil Using Heterogeneous Noble - Metal Catalysts, Ind. Eng. Chem. Res., 48(23), 1324–1334. https://doi.org/10.1021/ie9006003
Wildschut, J., Melian–Cabrera, I., & Heeres, H. J. (2010). Catalyst Studies on the Hydrotreatment of Fast Pyrolysis Oil, Applied Catalysis B: Environmental, 99(1-2), 298–306. https://doi.org/10.1016/j.apcatb.2010.06.036
 This work is licensed under a: Creative Commons Attribution 4.0 International License
© Granthaalayah 2014-2024. All Rights Reserved.