EXPLORING DIURNAL PATTERNS: DROP SIZE AND RAINFALL RATE DYNAMICS AT SHILLONG STATION
Dr. Nita H Shah 1![]()
![]() ,
Jyoti Chahal 2
,
Jyoti Chahal 2![]()
![]() , Dr. Bipasha Paul Shukla 3
, Dr. Bipasha Paul Shukla 3![]()
![]()
1 Professor
and Head of Department, Gujarat University, India
2 Research
Scholar, Gujarat University, India
3 Scientist
“SG”, Space Application Center (ISRO), India
|
|
|
ABSTRACT |
|
|
Rainfall prediction is crucial for various aspects of human life, environmental sustainability, and agriculture. Understanding rainfall intensity and its dependence on factors such as drop size distribution (DSD) is essential. This study investigates the relationship between drop size distribution and rainfall rate at Shillong station, Meghalaya, India, utilizing RD-80 disdrometer data for the year 2005. DSD plays a pivotal role in quantitative precipitation estimation, impacting rainfall properties like water content, intensity, and kinetic energy. Moreover, it is integral to satellite communication, aiding in the prediction of wave attenuation. We analyze the data to ascertain the correlation between rainfall rate and DSD, with an assumption of an exponential form for DSD. The analysis categorizes the daytime into four segments: Morning (6:00 AM-12:00 PM), Afternoon (12:00 PM-6:00 PM), Evening (6:00 PM-12:00 AM), and Night (12:00 AM-6:00 AM) to observe rain's diurnal variations. Notably, variations in correlation coefficients suggest differing rainfall patterns and intensity levels throughout the day and across months. These insights contribute to a deeper understanding of rainfall dynamics in the region, which is critical for effective water resource management and disaster preparedness. |
|||
|
Received 15 February 2024 Accepted 17 March 2024 Published 03 April 2024 Corresponding Author Jyoti
Chahal, jyotichahall.jc@gmail.com
DOI 10.29121/IJOEST.v8.i2.2024.583 Funding: This research
received no specific grant from any funding agency in the public, commercial,
or not-for-profit sectors. Copyright: © 2024 The
Author(s). This work is licensed under a Creative Commons
Attribution 4.0 International License. With the
license CC-BY, authors retain the copyright, allowing anyone to download,
reuse, re-print, modify, distribute, and/or copy their contribution. The work
must be properly attributed to its author.
|
|||
|
Keywords: Disdrometer,
Drop Size Distribution, Rainfall Rate, Correlation Coefficients |
|||
1. INTRODUCTION
Rainfall prediction is one of the major applications of weather forecasting as many lives, our environment, and agriculture depend on rain. Rainfall has both advantages and disadvantages according to its intensity. So, to study about rainfall intensity and the factors on which rainfall intensity depends becomes very important. Drop size distribution (DSD) is one of them as rainfall intensity is also a function of DSD, also it has major application in the field of meteorology, hydrology, and climate science Tokay et al. (2001), The drop size distribution is fundamental for quantitative precipitation estimation and helpful in computing rain bulk properties such as water content, rain intensity, and kinetic energy Jayawardena & Rezaur (2000). This study is also helpful for the satellite communication as we can predict the attenuation of the waves Timothy et al. (2002). Also, for the analysis of rainfall data, it is pre-assumed that the drop size distribution has an exponential form i.e.,
N(D) = N0 exp(- L D) (0 £ D £Dmax ) (1)
Where N0 (m-3cm-1) and L (cm-1) are the parameters of DSD and Dmax is the maximum diameter of the drop Ulbrich (1983).
In this paper, we used the RD-80 disdrometer data measurements of drop size distribution and observed the relationship of drop size distribution with the rainfall rate. Much research work already has been done by the researchers on rainfall rate and drop size distribution because as much information we have about these factors is going to be helpful in many areas related to climate. Baltas et al. (2016) analyzed the thirty-six rainfall events for nine years’ period 2002- 2014 and the measurements was from the Joss-Waldvogel disdrometer (JWD), they studied the respective drop size distribution and depict that among the six statistical distributions which one was fits best by using the Kolmogorov-Smirnov test. Cha & Yum (2021) studied the two-year data 2010-2011 of a mountain site Daegwallyeong in Korea and examine the Hydrometeor classification, DSD, and the rain rate by using the data of Parsivel optical disdrometer. Rees & Garrett (2021) determines the area required for the disdrometer to measure the rate of precipitation and compared the result with the guidelines of WMO (World Meteorological Organization) and aimed precision at 95% probability. Luo et al. (2021) studied the three-year data of two-dimensional video disdrometer placed at suburban station of Beijing, China, and investigated the total seasonal rainfall by examine the seasonal variations of the drop size distribution and rainfall rate with the method of arranging the disdrometer parameters into six regimes.
1.1. Data used
Disdrometer is a measuring device which is used for the identification of the type of falling hydrometeors, measures DSD, Rainfall intensity and the velocity of the falling hydrometeors. There are many usages of disdrometer data, and several studies have already been done on disdrometer data. one major limitation of this instrument is that it cannot measure the frequency of the very small drop Montopoli et al. (2008).
In this paper, we used the data of impact type disdrometer (RD-80) on raindrop size distribution, of the stations, which was supplied by SAC Ahmedabad for analysis. The disdrometer is also called A Joss Waldvogel impact type disdrometer as Joss and Waldvogel developed the first automatic impact disdrometer Meshesha et al. (2014). This disdrometer gives the data for every 30-second time interval. All the specifications of the disdrometer data are mentioned in Table 1 ARM, Atmospheric Radiation Measurement Climate Research Facility, (2016, March). In the impact disdrometer there are already preassigned 20 classes of the diameter and velocity of the falling hydrometeors. In the data if the falling hydrometeors meet the requirements of the class, then they will count in that class.
Table 1
|
Table 1 Classes of Diameter and Velocities of Drops |
|||||
|
Drop
size class |
Output code of processor
RD-80 |
Lower
threshold of drop diameter(mm) |
Average diameter of drops class i, Di (mm) |
Fall velocity of a drop with diameter Di, v (Di), (m/s) |
Diameter interval of drop size class i, DDi (mm) |
|
1 |
1-13 |
0.313 |
0.359 |
1.435 |
0.092 |
|
2 |
14-23 |
0.405 |
0.455 |
1.862 |
0.100 |
|
3 |
24-31 |
0.505 |
0.551 |
2.267 |
0.091 |
|
4 |
32-38 |
0.596 |
0.656 |
2.692 |
0.119 |
|
5 |
39-44 |
0.715 |
0.771 |
3.154 |
0.112 |
|
6 |
45-54 |
0.827 |
0.913 |
3.717 |
0.172 |
|
7 |
55-62 |
0.999 |
1.116 |
4.382 |
0.223 |
|
8 |
63-69 |
1.232 |
1.331 |
4.986 |
0.197 |
|
9 |
70-75 |
1.429 |
1.506 |
5.423 |
0.153 |
|
10 |
76-81 |
1.582 |
1.665 |
5.793 |
0.166 |
|
11 |
82-87 |
1.748 |
1.912 |
6.315 |
0.329 |
|
12 |
88-93 |
2.077 |
2.259 |
7.009 |
0.364 |
|
13 |
94-98 |
2.441 |
2.584 |
7.546 |
0.286 |
|
14 |
99-103 |
2.727 |
2.869 |
7.903 |
0.284 |
|
15 |
104-108 |
3.011 |
3.198 |
8.258 |
0.374 |
|
16 |
109-112 |
3.385 |
3.544 |
8.556 |
0.319 |
|
17 |
113-117 |
3.704 |
3.916 |
8.784 |
0.423 |
|
18 |
118-121 |
4.127 |
4.350 |
8.965 |
0.446 |
|
19 |
122-126 |
4.573 |
4.859 |
9.076 |
0.572 |
|
20 |
127 |
5.145 |
5.373 |
9.137 |
0.455 |
1.2. Study region
In this paper we analyzed the data for Shillong station capital of Meghalaya and a hilly area of north-east India, it is located at 25.57°N 91.88°E. The study of the region is noteworthy as the world’s highest rainfall area, Mawsinram/Cherrapunjee is nearby Shillong. Here monsoons come in June and rain until the end of October. Its summers are cool and very rainy, while its winters are cool yet dry, also it is assumed that the region features a subtropical highland climate (oceanic climate).
Figure 1

|
Figure 1 Location of the Meghalaya Hills with N-S Cross-Section and Seasonal Rainfall Distribution for the period 1901- 2000 Seasons: A-Winter, B-Pre-Monsoon, C-Monsoon, D-Post-Monsoon |
In the Figure 1, Prokop & Walanus (2015) examined the performance of independently four climatic seasons of Meghalaya hills particular for Shillong also, which can be distinguished over north-east India: winter (January–February), pre-monsoon (March-May), southwest monsoon (June–September) and post-monsoon (October–December).
2. Methodology
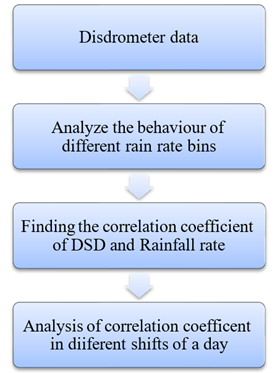
In this paper, we analyzed the disdrometer data for the year 2005 for Shillong station by finding the correlation coefficient of rainfall rate and drop size distribution of each predefined 20 classes of the disdrometer by the formulae of a particular class
Correlation coefficient =

ri = rainfall rate at time t
r = mean of the values of rainfall rate
ni = number of drops of a particular class at time t
n = mean of the values of the number of drops of a particular class at time t
with the help of this correlation coefficient, we were able to find the classes which have a very high correlation with the rainfall rate and the classes which have a very low correlation with the rainfall rate which helps to depict how strong a relationship is between these two variables (rainfall rate and drop size distribution). We also examined the rainfall rate according to the day divided into four-time intervals morning time (6:00 AM-12:00 PM), afternoon time (12:00 PM-6:00 PM), evening time (6:00 PM-00:00 AM), and nighttime (00:00 AM-6:00 AM). And analyze the variations in the rainfall rate.
3. Result and Discussion
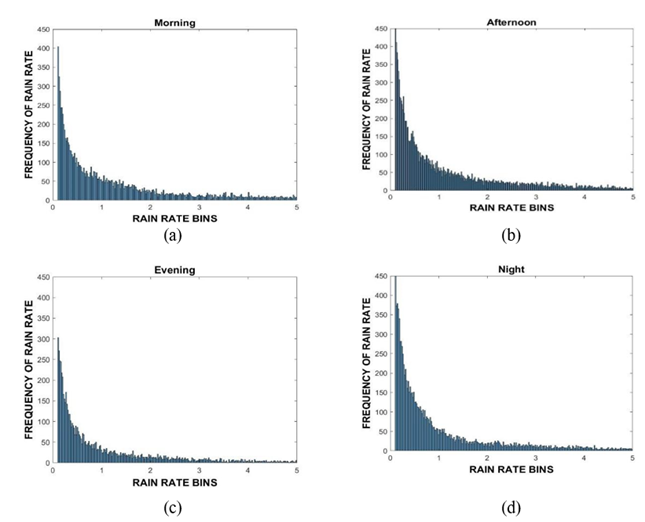
3.1. Rainfall rate
Firstly, the rainfall data for the year 2005 is analyzed for Shillong station to determine the rainfall pattern as observed from the disdrometer. Figure 2 shows the histogram for rain rate during different periods in a day (Morning, Afternoon, Evening, and Night). As expected, the frequency of occurrence of rainfall decreases steeply as we shift to higher rainfall rates. Still, for all time, we find that there are occurrences of heavy rainfall (~5mm/hr).
Light rainfall is a frequent feature in Shillong due to its orography and availability of an abundance of moisture from the Bay of Bengal. Hourly monitoring of spatial variability in the amount and intensity during cyclonic storms, the southern slope of the plateau acts as a barrier to rainfall as studied during the Sidr cyclone Prokop & Walanus (2015).
Figure 2
|
Figure 2 Shows the Rainfall Rate Variations at Different Times (a) Morning, b) Afternoon, c) Evening, d) Night) of a Day |
Next, we want to study the correlation between the rainfall rates to the drop size distribution, for different times of the day and for different months.
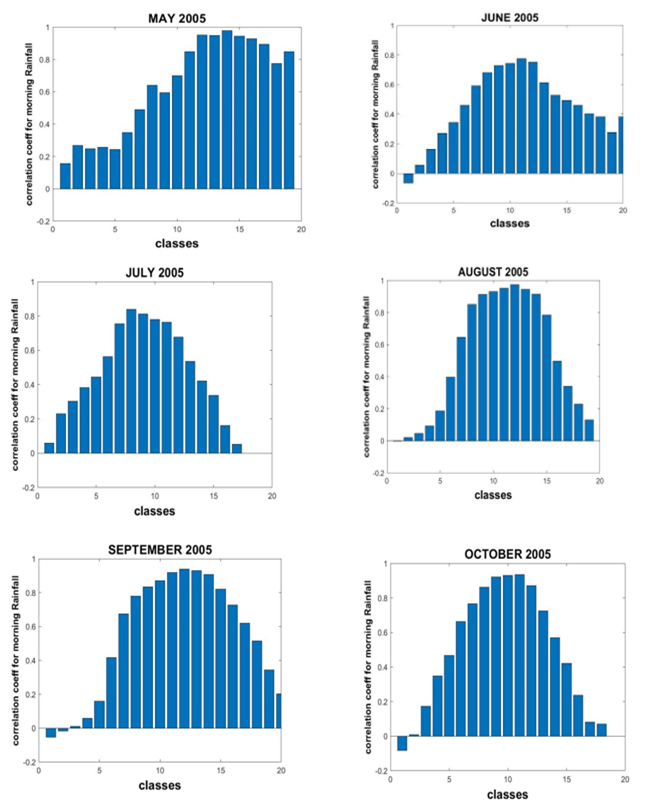
3.2. Morning
Figure 3
|
Figure 3 Correlation Coefficient of Rainfall Rate and DSD for Morning |
In Figure 3, The months of July, August, September, and October, show a Gaussian distribution of correlation coefficients, while May and June exhibit a skewed distribution having a left and a right tail respectively. During July, August, September, and October, the maximum correlation is found for class 7- class 13. Among all the months, May is seen to have a better correlation (> 0.7) of bigger size particles with rainfall. This may pertain to the high convective activity which promotes sudden updraft and leads to a high rain rate. This may be due to nor’ wester activity during the pre-monsoon phase.
3.3. Afternoon
Figure 4

|
Figure 4 Correlation Coefficient of Rainfall Rate and DSD for Afternoon |
In Figure 4, Among all the months August and October have the better correlation with the classes having bigger drop diameter i.e., classes 15-class20 also because of the convective rains in that region afternoon rainfall has the shortest duration but contribute more to the total rainfall. So, we can say the rainfall intensity in the afternoon is high as compared to the remaining time of the day Also, the temperature variation with height (the lapse rate) increases, which leads to more convection in the afternoon time. Also due to the convection the population of the smaller clouds is more and generally formed in the afternoon, these clouds have a very short lifetime that’s why they vanish in the afternoon after reached to their maximum size Meshesha et al. (2014).
3.4. Evening
Figure 5

|
Figure 5 Correlation Coefficient of Rainfall Rate and DSD for Evening |
In Figure 5, the month July, August, September, and October show the Gaussian distribution of correlation coefficient while the month June exhibits the skewed distribution of correlation coefficient, and in all the month’s class 9- class 14 has the better correlation except for the month June and May as the average rainfall is very less in June and no rainfall in May.
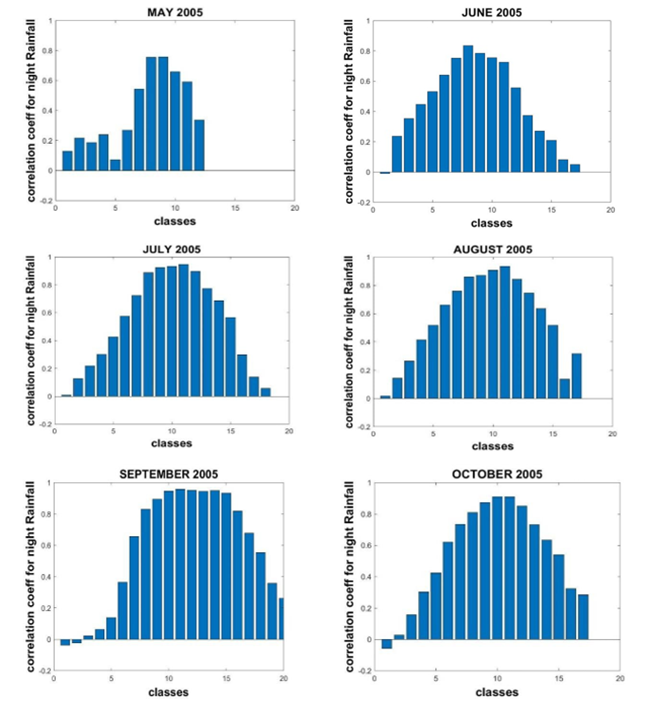
3.5. Night
Figure 6
|
Figure 6 Correlation Coefficient of Rainfall Rate and DSD for Night |
In Figure 6, the month June, July, August, September, and October shows that the relationship is directly proportional to the classes up to 10 but after that, the relation becomes inversely proportional as the classes increase the correlation coefficient decreases except for the month May. Among all the months September has the better correlation with class 7 up to class 15 (> 0.8)
4. Conclusions
In this study, we conclude that the light rainfall day is much more than the heavy rainfall day in Shillong. In the pre-monsoon season, may has the better correlation in the morning time with higher classes (drops with bigger diameter) which is due to deep convection occurring in a hilly area. In the monsoon season, the drops having a medium diameter (class9-class13) have a better correlation with rainfall rate ( > 0.5 ) even have a good correlation with the larger drops also as the summer monsoon season contributes the highest rainfall days in a year and has both light rainfall days and heavy rainfall days. From pre-monsoon to monsoon season, we obtained a negative correlation with the smaller drops also which means when the rainfall events increase the possibility of the smallest raindrops decreases. Though this study is carried out for a particular year, in the future it would be interesting to compare the results with other years too.
CONFLICT OF INTERESTS
None.
ACKNOWLEDGMENTS
The authors are thankful to the Director, Space Application Centre, ISRO for his valuable support during the study.
REFERENCES
ARM, Atmospheric Radiation Measurement Climate Research Facility, (2016, March).
Baltas, E., Panagos, D., & Mimikou, M. (2016). Statistical Analysis of the Raindrop Size Distribution using Disdrometer Data. Hydrology, 3(1), 9. https://doi.org/10.3390/hydrology3010009
Cha, J. W., & Yum, S. S. (2021). Characteristics of
Precipitation Particles Measured by PARSIVEL Disdrometer at a Mountain and a
Coastal Site in Korea. Asia-Pacific Journal of Atmospheric Sciences, 57(2),
261-276. https://doi.org/10.1007/s13143-020-00190-6
Jayawardena, A. W., & Rezaur, R. B. (2000). Drop Size Distribution and Kinetic Energy Load of Rainstorms in Hong Kong. Hydrological Processes, 14(6), 1069-1082. https://doi.org/10.1002/(SICI)1099-1085(20000430)14:6<1069::AID-HYP997>3.0.CO;2-Q
Luo, L., Guo, J., Chen, H., Yang, M., Chen, M., Xiao, H., Ma, J., & Li, S. (2021). Microphysical Characteristics of Rainfall Observed by a 2DVD Disdrometer During Different Seasons in Beijing, China. Remote Sensing, 13(12), 2303. https://doi.org/10.3390/rs13122303
Meshesha, D. T., Tsunekawa, A., Tsubo, M., Haregeweyn, N., & Adgo, E. (2014). Drop Size Distribution and Kinetic Energy Load of Rainfall Events in the Highlands of the Central Rift Valley, Ethiopia. Hydrological Sciences Journal, 59(12), 2203-2215. https://doi.org/10.1080/02626667.2013.865030
Montopoli, M., Marzano, F. S., & Vulpiani, G. (2008). Analysis and Synthesis of Raindrop Size Distribution Time Series from Disdrometer Data. IEEE Transactions on Geoscience and Remote Sensing, 46(2), 466-478. https://doi.org/10.1109/TGRS.2007.909102
Prokop, P., & Walanus, A. (2015). Variation In The Orographic Extreme Rain Events Over the Meghalaya Hills in Northeast India in the Two Halves of the Twentieth Century. Theoretical and Applied Climatology, 121(1), 389-399. https://doi.org/10.1007/s00704-014-1224-x
Rees, K. N., & Garrett, T. J. (2021). Idealized Simulation Study of the Relationship of Disdrometer Sampling Statistics with the Precision of Precipitation Rate Measurement. Atmospheric Measurement Techniques, 14(12), 7681-7691. https://doi.org/10.5194/amt-14-7681-2021
Timothy, K. I., Ong, J. T., & Choo, E. B. (2002). Raindrop Size Distribution Using Method of Moments for Terrestrial and Satellite Communication Applications in Singapore. IEEE Transactions on Antennas and Propagation, 50(10), 1420-1424. https://doi.org/10.1109/TAP.2002.802091
Tokay, A., Kruger, A., & Krajewski, W. F. (2001). Comparison of Drop Size Distribution Measurements by Impact and Optical Disdrometers. Journal of Applied Meteorology and Climatology, 40(11), 2083-2097. https://doi.org/10.1175/1520-0450(2001)040<2083:CODSDM>2.0.CO;2
Ulbrich, C. W. (1983). Natural Variations in the Analytical Form of the Raindrop Size Distribution. Journal of Climate and Applied Meteorology, 1764-1775. https://doi.org/10.1175/1520-0450(1983)022<1764:NVITAF>2.0.CO;2
 This work is licensed under a: Creative Commons Attribution 4.0 International License
© Granthaalayah 2014-2024. All Rights Reserved.