Identification and coding of Elliot Wave pattern
Vaidehi Vaghela 1![]() , Ravi Gor 2
, Ravi Gor 2![]()
1 Research scholar, Department of Mathematics, Gujarat University, India
2 Department of Mathematics, Gujarat University, India
|
|
|
ABSTRACT |
|
|
Prediction of
stock price and modelling of market pattern are quite difficult and complex
to understand itself. There are hidden factors of market like effect of news,
sentiment of crowd etc. which play an important role of modelling the market
pattern. The modelling of market patterns was primarily developed by R.N.
Elliott. The Elliott Wave theory was described subjectively in literature and
wave patterns cannot be identify easily. In this work, we mainly focus on
identification of wave pattern through Fractal indicators and Awesome
Oscillator using R programming. |
|||
|
Received 19 March 2022 Accepted 19 April 2022 Published 06 May 2022 Corresponding Author Vaidehi
Vaghela, vaidehivaghelafmg@gujaratuniversity.ac.in DOI 10.29121/IJOEST.v6.i3.2022.325 Funding: This research
received no specific grant from any funding agency in the public, commercial,
or not-for-profit sectors. Copyright: © 2022 The
Author(s). This work is licensed under a Creative Commons
Attribution 4.0 International License. With the
license CC-BY, authors retain the copyright, allowing anyone to download,
reuse, re-print, modify, distribute, and/or copy their contribution. The work
must be properly attributed to its author.
|
|||
|
Keywords: Fractal
Indicator, Awesome Oscillator, Elliott Wave, Elliott Wave Formation |
|||
1. INTRODUCTION
In modern financial analysis, many economists suggest that traditional model is not enough to perform entire analysis. If market is driven by people than the traditional analysis should be combined with psychology and human behaviour. If the psychological behaviour of traders and investors is taken into consideration it indicates that in certain situation, they often react in the same pattern; either panic buying/selling or holding. Such behaviour of traders and investors leads to drastic increase in buying/selling which creates buying/selling pressure in the market. This type of pressure creates patterns in price movements and the market moves with these price patterns.
We can predict the market movement using price patterns. One of the simplest patterns of market is fractal pattern. When there is buying pressure in the market than market moves in upward direction but after certain time market will definitely change the direction due to lack of buyers. Such movement of price creates fractal pattern. If the strength of buyers/seller is not sufficient then it leads to up/down fractal.
1.1. FRACTAL INDICATOR WILLIAMS (1998)
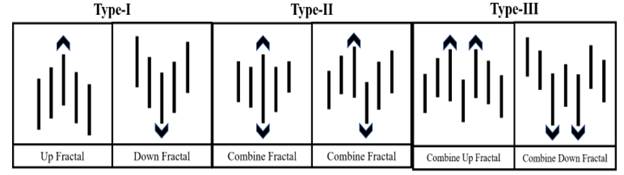
The Fractal Indicator is a pattern indicator, and it is developed by Bill Williams in 1998 in his book ‘New Trading Dimensions: How to Profit from Chaos in Stocks, Bonds, and Commodities’. Originally, He developed this pattern indicator for generating buy-stop/sell-stop in Alligator Indicator. In the Fractal Indicator, pattern is made by five consecutive candles and the high/low of middle candle is highest high/lowest low among all five candles. There are three different types of patterns in Fractal Indicator which are represented in the following Figure 1. In this work, we mainly use Type-I pattern.
Figure 1
|
|
|
Figure 1 |
Calculation
|
Up Fractal |
Down Fractal |
|
|
|
|
|
|
|
|
|
|
|
|
where,
![]()
![]()
![]()
![]()
![]()
1.2. AWESOME OSCILLATOR (AO) WILLIAMS (1998)
According to Bill Williams, Awesome Oscillator is the best momentum indicator, and it is non-limiting oscillator. AO measures the speed of change in price of last five days and compares it with the speed of change in price of last thirty-four days. The value of AO is oscillated around zero.
Calculation
![]()
![]()
![]()
![]()
![]()
1.3. ELLIOTT WAVE
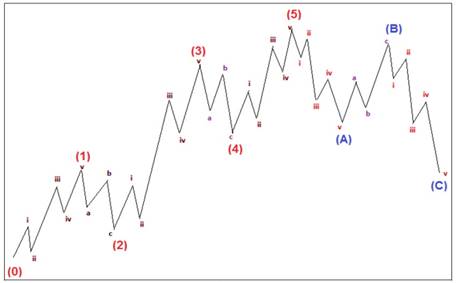
The Elliott Wave is mainly divided into two waves: 1) an impulse wave, which net travels in the same direction as the larger trend, always shows five waves in its pattern and 2) a corrective wave, on the other hand, net travels in the opposite direction of the main trend. Elliott (1946)
As shown in Figure 1 the wave formation consists of 5 waves in the direction of primary/impulsive wave marked as 1, 2, 3, 4 and 5. It is followed by three waves in reverse direction of main trend which is called corrective waves marked as A, B and C. As shown in Figure 2, inner wave marked as 1, 3 and 5 are also impulsive waves of smaller degree. So, the wave 1, wave 3 and wave 5 are parts of impulsive wave in upward direction. Elliott (1946)
Though Elliott waves follow many rules, but three basic rules are followed by each wave to interpret the Elliott wave. These guidelines are unbreakable. These rules are as follows:
· Rule 1: Wave 2 is not retracted more than 100% of wave 1.
· Rule 2: Wave 3 can never be the shortest wave among the 5 waves of impulse.
· Rule 3: Wave 4 cannot touch Wave 1. Elliott (1946)
Figure 2
|
|
|
Figure 2 Elliott Wave Elliott
(1946) |
Elliott Wave formation using Fractal Indicator and Awesome Oscillator
The Elliott Wave pattern can be classified into two waves namely Impulse wave and Corrective wave. The main Impulse wave includes five wave points, and the main Corrective wave includes three wave points. In the main Impulse wave, wave points 1, 3 and 5 are end point of impulse wave and wave points 2 and 4 are end point of corrective wave. According to the rules of Elliott Wave formation, if we find the five points of impulse wave then the remaining 3 points can be easily predicted. So, in this work, me mainly focus on identifying 5 wave points of main Impulse wave. For that, we use Fractal Indicator and Awesome Oscillator.
In the Elliott Wave, first five wave points can be identified using up and down Fractal. But it is not necessary that every fractal is wave point. In addition to this, every rule of Elliott wave formation must be followed to become a wave point. To identify wave points 1, 3 and 5, two information are needed: 1) up fractal and 2) a change in trend coming from that (particular) point. And to identify wave points 2 and 4, two information are needed: 1) down fractal and 2) a change in trend coming from that (particular) point. This trend change can identify using Awesome Oscillator. So, in this work, we try to find out the Elliott Wave formation using Fractal Indicator and Awesome Oscillator.
2. LITERATURE REVIEW
Elliott (1946) published his definitive work on wave principle. He developed the wave theory based on human behaviour in a specific pattern. Using stock market data as his main research tool, Elliott had isolated thirteen patterns of movement, or "waves," that recur in market price data. Elliott (1946)
Williams (1998) developed the new concepts combining trading psychology and chaos theory on the stock markets. He introduced markets inherent parts into five trading dimensions. He described the leading indicator called Awesome Oscillator (AO) which measures immediate momentum of the market. Williams (1998)
Akar and Ugur (2021) studied the stock price prediction of tesla motors using different technical indicators. he also used machine learning algorithms namely long short-term memory model (LSTM) for price prediction. he observed that investor should use more than one indicator for trend identification. He analysed that LSTM might predict an unexpected jump in the stock price and help in finding the entry and exit signals. Akar and Ugur (2021)
Iovane et al. (2016) introduced the multiparametric methodology (MIAMI Model) for financial trading, investment, and prospects analysis Iovane et al. (2016).
Roy (2020) explained how the movement of the market can be captured by the Bill Williams invented Alligator, Fractal and Awesome Oscillator. He discussed how to make quick profits from the above indicators in swing trading. Also, he emphasized on risk management and proper position trading in a market. Roy (2020)
Vaghela and Gor (2020) worked on Elliott wave theory with a combination of sentiment indicator put-call ratio to reduce the complexity of Elliott wave theory. They tried to identify the wave pattern by put call ratio indicator. Vaghela and Gor (2020)
Vaghela et al. (2021) constructed a combined strategy of Commodity Channel Index (CCI) and Double Exponential Moving Average (DEMA) for the Elliott wave formation. They examined that the combined strategy provides better buying and selling opportunity Vaghela et al. (2021).
Vaghela et al. (2021) developed Elliott wave creation through Stochastic Oscillator and Average Directional Indicator (ADX). They concluded that ADX is better at wave formation than Stochastic Oscillator. Also, this strategy helps to identify the upcoming trend in the market. Vaghela et al. (2021)
Panchal et al. (2020) introduced a new trading method of Bollinger Bands namely Moving Fibonacci Strategy (MF Strategy) and concluded that MF strategy identify signal when security prices were around the moving average and that is a short fall of Bollinger Bands strategy Panchal et al. (2020).
Panchal and Gor (2022) worked on comparative study of different investing strategies namely DCRSI Strategy, PSAREMA Strategy and MF Strategy with the oldest and basic strategy Moving Average Crossover Panchal and Gor (2022).
3. FRACTAL INDICATOR THROUGH EXCEL AND R PROGRAMMING
·
Excel
1)
Find the High(n-2), High(n-1), High(n), High(n+1),
High(n+2), Low(n-2), Low(n-1), Low (n),
Low (n+1) and Low (n+2) value from data
2) Outcome: - IF(E2>=C2, E2>=D2, E2>=F2, E2>=G2,"Up Fractal","0") and IF (E2<=C2, E2<=D2, E2<=F2, E2<=G2,"Down Fractal","0")
|
A |
B |
C |
D |
E |
F |
G |
H |
|
|
1 |
Date |
High |
High (n-2) |
High (n-1) |
High(n) |
High(n+1) |
High(n+2) |
Outcome |
|
2 |
6/1/2021 |
2202 |
2,105.00 |
2,191.70 |
2,202.00 |
2,209.50 |
2,250.00 |
0 |
|
3 |
6/2/2021 |
2209.5 |
2,191.70 |
2,202.00 |
2,209.50 |
2,250.00 |
2,216.45 |
0 |
|
4 |
6/3/2021 |
2250 |
2,202.00 |
2,209.50 |
2,250.00 |
2,216.45 |
2,242.00 |
Up Fractal |
|
5 |
6/4/2021 |
2216.45 |
2,209.50 |
2,250.00 |
2,216.45 |
2,242.00 |
2,227.15 |
0 |
|
6 |
6/7/2021 |
2242 |
2,250.00 |
2,216.45 |
2,242.00 |
2,227.15 |
2,221.00 |
0 |
|
7 |
6/8/2021 |
2227.15 |
2,216.45 |
2,242.00 |
2,227.15 |
2,221.00 |
2,230.00 |
0 |
|
8 |
6/9/2021 |
2221 |
2,242.00 |
2,227.15 |
2,221.00 |
2,230.00 |
2,228.00 |
0 |
|
9 |
6/10/2021 |
2230 |
2,227.15 |
2,221.00 |
2,230.00 |
2,228.00 |
2,258.25 |
0 |
|
10 |
6/11/2021 |
2228 |
2,221.00 |
2,230.00 |
2,228.00 |
2,258.25 |
2,274.90 |
0 |
|
11 |
6/14/2021 |
2258.25 |
2,230.00 |
2,228.00 |
2,258.25 |
2,274.90 |
2,247.05 |
0 |
|
12 |
6/15/2021 |
2274.9 |
2,228.00 |
2,258.25 |
2,274.90 |
2,247.05 |
2,235.00 |
Up Fractal |
|
13 |
6/16/2021 |
2247.05 |
2,258.25 |
2,274.90 |
2,247.05 |
2,235.00 |
2,235.00 |
0 |
|
14 |
6/17/2021 |
2235 |
2,274.90 |
2,247.05 |
2,235.00 |
2,235.00 |
2,247.50 |
0 |
|
15 |
6/18/2021 |
2235 |
2,247.05 |
2,235.00 |
2,235.00 |
2,247.50 |
2,261.00 |
0 |
|
16 |
6/21/2021 |
2247.5 |
2,235.00 |
2,235.00 |
2,247.50 |
2,261.00 |
2,250.60 |
0 |
|
17 |
6/22/2021 |
2261 |
2,235.00 |
2,247.50 |
2,261.00 |
2,250.60 |
2,214.60 |
Up
Fractal |
|
18 |
6/23/2021 |
2250.6 |
2,247.50 |
2,261.00 |
2,250.60 |
2,214.60 |
2,153.50 |
0 |
|
19 |
6/24/2021 |
2214.6 |
2,261.00 |
2,250.60 |
2,214.60 |
2,153.50 |
2,126.50 |
0 |
|
20 |
6/25/2021 |
2153.5 |
2,250.60 |
2,214.60 |
2,153.50 |
2,126.50 |
2,109.00 |
0 |
|
21 |
6/28/2021 |
2126.5 |
2,214.60 |
2,153.50 |
2,126.50 |
2,109.00 |
2,122.65 |
0 |
|
22 |
6/29/2021 |
2109 |
2,153.50 |
2,126.50 |
2,109.00 |
2,122.65 |
2,123.15 |
0 |
|
23 |
6/30/2021 |
2122.65 |
2,126.50 |
2,109.00 |
2,122.65 |
2,123.15 |
2,132.90 |
0 |
|
24 |
7/1/2021 |
2123.15 |
2,109.00 |
2,122.65 |
2,123.15 |
2,132.90 |
2,153.55 |
0 |
|
25 |
7/2/2021 |
2132.9 |
2,122.65 |
2,123.15 |
2,132.90 |
2,153.55 |
2,148.90 |
0 |
|
26 |
7/5/2021 |
2153.55 |
2,123.15 |
2,132.90 |
2,153.55 |
2,148.90 |
2,127.75 |
Up Fractal |
|
A |
B |
C |
D |
E |
F |
G |
H |
|
|
1 |
Date |
Low |
Low (n-2) |
Low (n-1) |
Low
(n) |
Low(n+1) |
Low(n+2) |
Outcome |
|
2 |
6/1/2021 |
2146.5 |
1,990.00 |
2,085.05 |
2,146.50 |
2,157.00 |
2,196.10 |
0 |
|
3 |
6/2/2021 |
2157 |
2,085.05 |
2,146.50 |
2,157.00 |
2,196.10 |
2,184.25 |
0 |
|
4 |
6/3/2021 |
2196.1 |
2,146.50 |
2,157.00 |
2,196.10 |
2,184.25 |
2,185.00 |
0 |
|
5 |
6/4/2021 |
2184.25 |
2,157.00 |
2,196.10 |
2,184.25 |
2,185.00 |
2,198.15 |
0 |
|
6 |
6/7/2021 |
2185 |
2,196.10 |
2,184.25 |
2,185.00 |
2,198.15 |
2,157.95 |
0 |
|
7 |
6/8/2021 |
2198.15 |
2,184.25 |
2,185.00 |
2,198.15 |
2,157.95 |
2,177.55 |
0 |
|
8 |
6/9/2021 |
2157.95 |
2,185.00 |
2,198.15 |
2,157.95 |
2,177.55 |
2,180.10 |
DownFractal |
|
9 |
6/10/2021 |
2177.55 |
2,198.15 |
2,157.95 |
2,177.55 |
2,180.10 |
2,195.05 |
0 |
|
10 |
6/11/2021 |
2180.1 |
2,157.95 |
2,177.55 |
2,180.10 |
2,195.05 |
2,240.30 |
0 |
|
11 |
6/14/2021 |
2195.05 |
2,177.55 |
2,180.10 |
2,195.05 |
2,240.30 |
2,205.85 |
0 |
|
12 |
6/15/2021 |
2240.3 |
2,180.10 |
2,195.05 |
2,240.30 |
2,205.85 |
2,179.90 |
0 |
|
13 |
6/16/2021 |
2205.85 |
2,195.05 |
2,240.30 |
2,205.85 |
2,179.90 |
2,184.35 |
0 |
|
14 |
6/17/2021 |
2179.9 |
2,240.30 |
2,205.85 |
2,179.90 |
2,184.35 |
2,200.15 |
DownFractal |
|
15 |
6/18/2021 |
2184.35 |
2,205.85 |
2,179.90 |
2,184.35 |
2,200.15 |
2,219.35 |
0 |
|
16 |
6/21/2021 |
2200.15 |
2,179.90 |
2,184.35 |
2,200.15 |
2,219.35 |
2,201.70 |
0 |
|
17 |
6/22/2021 |
2219.35 |
2,184.35 |
2,200.15 |
2,219.35 |
2,201.70 |
2,140.00 |
0 |
|
18 |
6/23/2021 |
2201.7 |
2,200.15 |
2,219.35 |
2,201.70 |
2,140.00 |
2,081.10 |
0 |
|
19 |
6/24/2021 |
2140 |
2,219.35 |
2,201.70 |
2,140.00 |
2,081.10 |
2,081.00 |
0 |
|
20 |
6/25/2021 |
2081.1 |
2,201.70 |
2,140.00 |
2,081.10 |
2,081.00 |
2,084.10 |
0 |
|
21 |
6/28/2021 |
2081 |
2,140.00 |
2,081.10 |
2,081.00 |
2,084.10 |
2,091.05 |
DownFractal |
|
22 |
6/29/2021 |
2084.1 |
2,081.10 |
2,081.00 |
2,084.10 |
2,091.05 |
2,095.00 |
0 |
|
23 |
6/30/2021 |
2091.05 |
2,081.00 |
2,084.10 |
2,091.05 |
2,095.00 |
2,092.95 |
0 |
|
24 |
7/1/2021 |
2095 |
2,084.10 |
2,091.05 |
2,095.00 |
2,092.95 |
2,131.50 |
0 |
|
25 |
7/2/2021 |
2092.95 |
2,091.05 |
2,095.00 |
2,092.95 |
2,131.50 |
2,120.20 |
0 |
|
26 |
7/5/2021 |
2131.5 |
2,095.00 |
2,092.95 |
2,131.50 |
2,120.20 |
2,098.00 |
0 |
·
R-Programming: (some important steps)
1) Import data from yahoo finance.
2) Data manipulation: Omit ‘Null’ value from the data.
3) Find the High(n-2), High(n-1), High(n), High(n+1), High(n+2), Low(n-2), Low(n-1), Low (n), Low (n+1) and Low (n+2) value from data.
4) Using above value find Up Fractal and Down Fractal.
4. AWESOME OSCILLATOR THROUGH EXCEL AND R PROGRAMMING
·
Excel
1) Mid-Price:
- ![]()
2) SMA(Mid-Price,5): - Average (previous 5 days Mid-Price)
3) SMA(Mid-Price,34): - Average (previous 34 days Mid-Price)
4) AO: - SMA(Mid-Price,5) - SMA(Mid-Price,34)
5) Trend: - IF(C2>C3, DOWN) & IF (C2<C3, UP)
|
A |
B |
C |
D |
E |
F |
G |
H |
|
|
1 |
Date |
High |
Low |
Mid-Price |
SMA(Mid-Price,5) |
SMA(Mid-Price,34) |
AO |
Trend |
|
2 |
6/1/2021 |
2202 |
2146.5 |
2174.25 |
2062.03 |
1966.9566 |
95.073382 |
UP |
|
3 |
6/2/2021 |
2209.5 |
2157 |
2183.25 |
2104.2 |
1974.3809 |
129.81912 |
UP |
|
4 |
6/3/2021 |
2250 |
2196.1 |
2223.05 |
2153.285 |
1983.0228 |
170.26221 |
UP |
|
5 |
6/4/2021 |
2216.45 |
2184.25 |
2200.35 |
2183.855 |
1990.7684 |
193.08662 |
UP |
|
6 |
6/7/2021 |
2242 |
2185 |
2213.5 |
2198.88 |
1998.8662 |
200.01382 |
UP |
|
7 |
6/8/2021 |
2227.15 |
2198.15 |
2212.65 |
2206.56 |
2007.9676 |
198.59235 |
DOWN |
|
8 |
6/9/2021 |
2221 |
2157.95 |
2189.475 |
2207.805 |
2016.3426 |
191.46235 |
DOWN |
|
9 |
6/10/2021 |
2230 |
2177.55 |
2203.775 |
2203.95 |
2025.4074 |
178.54265 |
DOWN |
|
10 |
6/11/2021 |
2228 |
2180.1 |
2204.05 |
2204.69 |
2034.1404 |
170.54956 |
DOWN |
|
11 |
6/14/2021 |
2258.25 |
2195.05 |
2226.65 |
2207.32 |
2042.6669 |
164.65309 |
DOWN |
|
12 |
6/15/2021 |
2274.9 |
2240.3 |
2257.6 |
2216.31 |
2051.1926 |
165.11735 |
UP |
|
13 |
6/16/2021 |
2247.05 |
2205.85 |
2226.45 |
2223.705 |
2058.0272 |
165.67779 |
UP |
|
14 |
6/17/2021 |
2235 |
2179.9 |
2207.45 |
2224.44 |
2063.3669 |
161.07309 |
DOWN |
|
15 |
6/18/2021 |
2235 |
2184.35 |
2209.675 |
2225.565 |
2069.1875 |
156.3775 |
DOWN |
|
16 |
6/21/2021 |
2247.5 |
2200.15 |
2223.825 |
2225 |
2076.9162 |
148.08382 |
DOWN |
|
17 |
6/22/2021 |
2261 |
2219.35 |
2240.175 |
2221.515 |
2085.7625 |
135.7525 |
DOWN |
|
18 |
6/23/2021 |
2250.6 |
2201.7 |
2226.15 |
2221.455 |
2094.6706 |
126.78441 |
DOWN |
|
19 |
6/24/2021 |
2214.6 |
2140 |
2177.3 |
2215.425 |
2102.2147 |
113.21029 |
DOWN |
|
20 |
6/25/2021 |
2153.5 |
2081.1 |
2117.3 |
2196.95 |
2107.4051 |
89.544853 |
DOWN |
|
21 |
6/28/2021 |
2126.5 |
2081 |
2103.75 |
2172.935 |
2112.4015 |
60.533529 |
DOWN |
|
22 |
6/29/2021 |
2109 |
2084.1 |
2096.55 |
2144.21 |
2117.4684 |
26.741618 |
DOWN |
|
23 |
6/30/2021 |
2122.65 |
2091.05 |
2106.85 |
2120.35 |
2122.9654 |
-2.615441 |
DOWN |
|
24 |
7/1/2021 |
2123.15 |
2095 |
2109.075 |
2106.705 |
2128.4088 |
-21.70382 |
DOWN |
|
25 |
7/2/2021 |
2132.9 |
2092.95 |
2112.925 |
2105.83 |
2133.2912 |
-27.46118 |
DOWN |
|
26 |
7/5/2021 |
2153.55 |
2131.5 |
2142.525 |
2113.585 |
2137.8493 |
-24.26426 |
UP |
·
R-Programming: (some important steps)
1) Import data from yahoo finance.
2) Data manipulation: Omit ‘Null’ value from the data.
3) Find Mid-Price.
4) Calculate SMA(Mid-Price,5), SMA(Mid-Price,34) and then after calculate AO.
5) Plot AO.
5. RESEARCH METHODOLOGY
5.1. Objective
To identify exact Elliott wave pattern using its subjective rules through Fractal Indicator and Awesome Oscillator.
To derive R-code and Excel-code for Fractal Indicator and Awesome Oscillator.
To identify the Elliott wave pattern in security prices using the programming language R
5.2. Data Collection
· In this work, we have taken daily data from NSE website.
· We collected stock price data from January 2005 to March 2022 from NSE website.
· To demonstrate the study, we use four companies: Reliance Industry pvt. Ltd. (RELIANCE.NS), Aarti Industries Limited (AARTIIND.NS), Dr. Reddy's Laboratories Limited (DRREDDY.NS), Graphite India Limited (GRAPHITE.NS). The choice of the companies is random.
5.3. Computation
All the computations are performed in R-Programming. The step wise procedure is given below.
· Take a data of security from NSE/BSE.
· Clean the data of security that is removing non-trading day using excel.
· Import clean data of security in RStudio which includes ‘Open’, ‘High’, ‘Low’ and ‘Close’ price of security.
· Find Mid-Price using ‘High’ and ‘Low’ price. After that calculate SMA(Mid-Price,5) and SMA(Mid-Price,34) and Calculate AO.
· Find current trend using AO.
· Find Up Fractal and Down Fractal using ‘High’ and ‘Low’ price.
· Identify Elliott Wave pattern using current trend and Fractal.
5.4. Result
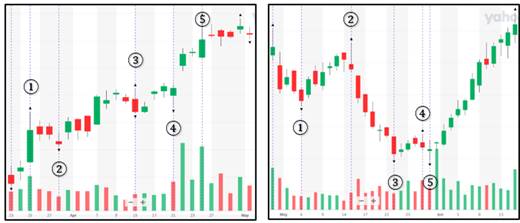
Using the above procedure, we can identify Elliott Wave Pattern using daily, ‘Open’, ‘High’, ‘Low’ and ‘Close’ price of security. For the demonstration purpose, Table 1, Table 2, Table 3, Table 4 represent one Bullish and Bearish wave of RELIANCE.NS, AARTIIND.NS, DRREDDY.NS and GRAPHITE.NS respectively. In the outcome, we find 5 impulse wave points through pattern identification and give the prediction for 3 corrective wave point namely A, B, and C. In other words, we find the main impulse wave of Elliott Wave pattern and give the prediction for the corrective wave. If the impulse wave is Bullish, then upcoming corrective wave is Bearish and vice a versa.
Table 1
|
Table 1 Bullish and Bearish Wave (RELIANCE.NS) |
||||||||
|
Date |
High |
Low |
Bullish
Wave |
Date |
High |
Low |
Bearish
Wave |
|
|
3/25/2020 |
1140.73 |
954.2 |
W1 |
5/4/2018 |
955.64 |
941.07 |
W1 |
|
|
3/30/2020 |
1064.7 |
1010.42 |
W2 |
5/15/2018 |
990.6 |
967.47 |
W2 |
|
|
4/15/2020 |
1224.39 |
1132.26 |
W3 |
5/23/2018 |
917.3 |
900.61 |
W3 |
|
|
4/21/2020 |
1240.24 |
1153.07 |
W4 |
5/29/2018 |
919.28 |
905.81 |
W4 |
|
|
4/24/2020 |
1480.91 |
1334.54 |
W5 |
5/30/2018 |
914.53 |
898.08 |
W5 |
|
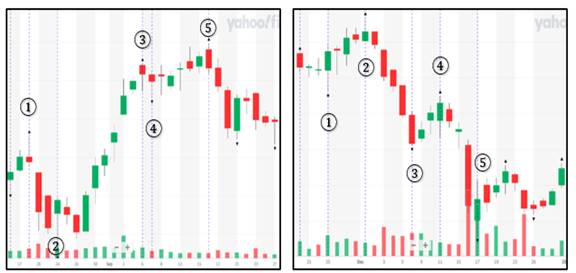
Figure 3
|
|
|
Figure 3 Graphical representation of Table
1 |
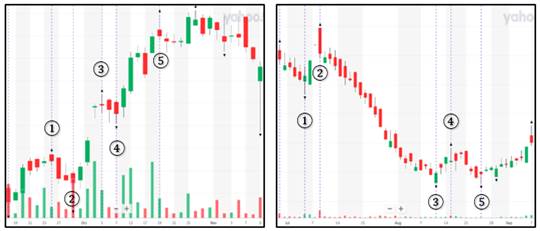
Table 2
|
Table 2 Bullish and Bearish Wave (AARTIIND.NS) |
||||||||
|
Date |
High |
Low |
Bullish
Wave |
Date |
High |
Low |
Bearish
Wave |
|
|
9/26/2016 |
153.81 |
151.17 |
W1 |
7/5/2007 |
10.63 |
9.67 |
W1 |
|
|
9/29/2016 |
149.92 |
141.59 |
W2 |
7/10/2007 |
11.94 |
10.91 |
W2 |
|
|
10/5/2016 |
166.93 |
162.8 |
W3 |
8/10/2007 |
7.05 |
6.62 |
W3 |
|
|
10/7/2016 |
165.47 |
160.37 |
W4 |
8/16/2007 |
7.83 |
7.33 |
W4 |
|
|
10/19/2016 |
184.65 |
178.9 |
W5 |
8/24/2007 |
7.01 |
6.6 |
W5 |
|
Figure 4
|
|
|
Figure 4 Graphical
representation of Table
2 |
Table 3
|
Table 3 Bullish and Bearish Wave (DRREDDY.NS) |
||||||||
|
Date |
High |
Low |
Bullish
Wave |
|
Date |
High |
Low |
Bearish
Wave |
|
8/18/2021 |
4755.04 |
4675 |
W1 |
|
11/25/2014 |
3595 |
3460 |
W1 |
|
8/24/2021 |
4595.7 |
4445.7 |
W2 |
|
12/1/2014 |
3666.25 |
3602 |
W2 |
|
9/6/2021 |
4943.29 |
4871.45 |
W3 |
|
12/8/2014 |
3405.55 |
3310.55 |
W3 |
|
9/7/2021 |
4925.95 |
4855.54 |
W4 |
|
12/11/2014 |
3448 |
3331 |
W4 |
|
9/16/2021 |
4996.5 |
4916.54 |
W5 |
|
12/17/2014 |
3213 |
3057 |
W5 |
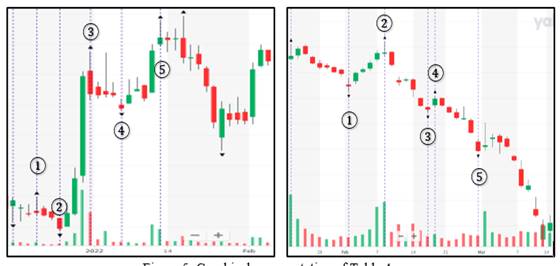
Figure 5
|
|
|
Figure 5 Graphical
representation of Table
3 |
Table 4
|
Table 4 Bullish and Bearish Wave (GRAPHITE.NS) |
||||||||
|
Date |
High |
Low |
Bullish
Wave |
Date |
High |
Low |
Bearish
Wave |
|
|
12/22/2021 |
424 |
409.75 |
W1 |
2/3/2020 |
293.89 |
280.54 |
W1 |
|
|
12/27/2021 |
407 |
396 |
W2 |
2/10/2020 |
329.79 |
316 |
W2 |
|
|
12/31/2021 |
544 |
503.85 |
W3 |
2/18/2020 |
266 |
260 |
W3 |
|
|
1/6/2022 |
505 |
495.29 |
W4 |
2/19/2020 |
276.89 |
266.1 |
W4 |
|
|
1/13/2022 |
569 |
548 |
W5 |
2/28/2020 |
235 |
222 |
W5 |
|
Figure 6
|
|
|
Figure 6 Graphical representation of Table
4 |
6. CONCLUSION
In this paper, we have successfully used the Fractal Indicator and Awesome Oscillator for Elliott wave formation. Using R programming we find five wave points of the Elliott wave's main impulse wave. We have applied this to the index NIFTY100 and top 100 securities of the NSE. We took data from January 2005 to April 2022. We attempt to predict three wave point of main Corrective Wave which is correct in most cases, but there are exceptions like, in Figure 6, identification of Bearish wave points 5 is wrong so prediction of corrective is not correct. Such instances call for further research into this area. In this work we have worked on only one standard wave pattern of Elliott Wave, so we get less wave pattern on security price. Further improvements on this works are the scope for future research.
REFERENCES
Akar, A. Ugur, O. (2021). Technical Indicators and LSTM Prediction for Stock Prices.
Elliott, R.N. (1946). Nature's Law - The Secret of the Universe.
Guides, T. S. (2017). Bill Williams Awesome Oscillator Strategy-Big Profits, Small Losses.
Iovane, G., Amorosia, A., Leone, M., Nappi, M., & Tortora, G. (2016). Multi Indicator Approach Via Mathematical Inference for Price Dynamics in Information Fusion Context. Information Sciences, 373, 183-199.
Panchal, M., & Gor, R. (2022). Comparative Study of Hybrid Strategies with Moving Average Crossover, International Journal of Engineering Science Technologies (IJOEST), 6(1). 2456-8651.
Panchal, M., & Gor, R. Hemrajani, J. (2020). A Hybrid Strategy Using Mean Reverting Indictor PSAR and EMA. IOSR Journal of Mathematics (IOSR-JM), 6(5), 2278-5728.
Roy, P. (2020). How to Make Money with Alligator & Awesome Oscillator: Alligator and Fractals Swing Trading Strategy (Kindle Edition).
Russell, S. (n.d.). Comparing the Awesome Oscillator to a Time-Based Trade : A Framework for Testing Stock Trading Algorithms.
Vaghela V. & Gor, R. (2020). Market Direction by combining Elliott Wave Theory with Sentiment Indicator. Alochnachakra, 9(6), 5794-5797.
Vaghela, V., Gor, R., & Malvi, N. (2021). Elliott Wave formation using Hybrid Strategy of Stochastic and ADX Indicators. IOSR Journal of Economics and Finance (IOSR-JEF), 12(4), 2321-5933. https://10.9790/5933-1204011725
Williams, B. M. (1998). New Trading Dimensions : How to Profit from Chaos in Stocks, Bonds, and Commodities, 72.
 This work is licensed under a: Creative Commons Attribution 4.0 International License
© Granthaalayah 2014-2022. All Rights Reserved.