0BCOMPARATIVE STUDY OF HYBRID STRATEGIES WITH MOVING AVERAGE CROSSOVER1BMaitri Panchal 1
|
|
||
|
|
|||
|
Received 2 January 2022 Accepted 16 January 2022 Published 15 February 2022 Corresponding Author Maitri Panchal, maitripanchalfmg@gujaratuniversity.ac.in DOI 10.29121/IJOEST.v6.i1.2022.271
Funding:
This
research received no specific grant from any funding agency in the public,
commercial, or not-for-profit sectors. Copyright:
© 2022
The Author(s). This is an open access article distributed under the terms of
the Creative Commons Attribution License, which permits unrestricted use, distribution,
and reproduction in any medium, provided the original author and source are
credited.
|
ABSTRACT |
|
|
|
According
to traders and investors, combined strategy gives better returns than
individual strategy for the security analysis in the stock market. But
traders and investors have a trend of first using one of oldest strategy;
Moving Average Crossover (Crossover) because this strategy gives upcoming
trend direction directly and easily. In this paper, we compare the return of
hybrid strategy namely Hybrid Strategy of Donchian
Channel and RSI (DCRSI), Hybrid Strategy of Parabolic SAR and EMA (PSAREMA)
and Moving Fibonacci Strategy (MF) with the oldest strategy Crossover. Also,
we check the profitability of these strategies in different market conditions
and demonstrate on NSE data through R-Programming. |
|
||
|
Keywords: DCRSI, PSAREMA, MF, Crossover 1. INTRODUCTION Mathematical Study of
the financial markets is an ongoing process, and a lot of economic and
financial theories rely on mathematical models of risk to accomplish such studies.
In financial firms the main target is to minimize the risk and maximize the
profit of investment in the stock market and answer the most basic question
in the financial derivatives market - “When to buy/sell the derivatives?” and
to follow the main profit rule of the financial market - “Buy low and sell
high”. The main and direct application of
mean reversion phenomena in the financial market is to identify market
trends. The meaning of market trend is a perceived tendency of the financial
market to move in a particular direction over time. To identify the trend of
the market, there are many technical trend indicators that are working on the
phenomena of mean reversion and help us to understand upcoming trends. We
wish to study deeply and analyze the concept of technical trend indicators
using data from NSE and demonstrate how we can progress towards understanding
technical analysis better. 1.1. TECHNICAL ANALYSIS AND RATIONAL ANALYSIS The term technical
analysis is defined as “an analytical approach based on the belief that price
reflects all that is knowable about a security at any given time. Therefore,
the price structure itself is the best source of data for forecasting futures
prices Bollinger (2002).” This
definition was given by John Bollinger who was an American financial analyst
According to the |
|
||
security means that an analytical approach that focuses on the underlying fact set to forecast the future price of a security Bollinger (2002). In other words, the fundamental analysis is based on the intrinsic value of the security. For the accurate prediction of security pricing both the fundamental and technical analysis are needed, this concept was initially given by John Bollinger. He introduced the Rational analysis which mentioned the juncture of the sets of technical analysis and fundamental analysis Bollinger (2002).
1.2. TRADING STRATEGY
Trading strategy is the systematic discipline or methodology that is used to make a decision to buy or sell the securities within a certain trading timeframe. All traders or investors use their own trading strategies in the market. There are many trading strategies in the market over the years. Among all these strategies, most of the strategies are based on the single indicator strategy which is very risky. There is no such one indicator in the market which can help us in every market condition. There is one standard strategy that is moving average crossover or price cross over in which buying and selling decisions are based on the long-term moving average and short-term moving average crosses each other. This strategy is used in almost every market condition, but this strategy gives late signals of buying and selling.
1.3. TECHNICAL INDICATOR
Technical Indicators are usually mathematical constructions of price, volume or other factors that serve to aid decision making Bollinger (2002). There are many technical indicators in the market. In this study, we use Bollinger Bands, Fibonacci Retracement, Simple Moving Average, Exponential Moving Average, Parabolic Stop and Reversal (PSAR), Donchian Channel, Relative Strength Index (RSI).
2. Literature review
Bollinger (1992) was the first one to describe Bollinger
bands. He focused on the volatility as a trading band and found that Bollinger
bands were quick to react to large moves in the market Souza et al. (2018).
Mitra (2011) analysed the advantages of the moving
average based on the rules of trade in India from December 2000 to November
2010 over a period of ten years. The analysis of the study found a profit from
technical analysis when the price of the trade was ignored or kept at a low
level but found that trading costs were an important factor in determining the
profitability of the trade Mitra (2011).
Yazdi and Lashkari (2012) developed Virtual Historical Trading Software (VHTS) for the purpose of
calculating the Parabolic SAR (P-SAR) indicator based on its original formulas
and interpretations. Also, it generated buy and sell signals. They examined the
effectiveness of the P-SAR indicator for four pairs of currencies; Euro-US
Dollar, British Pound- US Dollar, US Dollar-Swiss Franc, US Dollar-Japanese Yen
were evaluated based on the profit of buy and sell signals and concluded that
P-SAR performed well with EURUSD Yazdi and Lashkari (2012).
Alajbeg et al. (2012) evaluated the simple trading system – a dual
exponential moving average crossover on the S&P 500 index, with a shorter
moving average of 50-day EMA and a longer of 200 days EMA Alajbeg et al. (2012).
Otake and Fallou (2013) attempted to apply Fibonacci trading in the
African market similar to the western or Japanese
market. They considered different turning points and calculated the retracement
and projection ratios and concluded that Fibonacci retracement proved that the
stock prices almost reversed around the Fibonacci ratios and Fibonacci trading
could be very useful for traders in the African stock market Otake and Fallou (2013).
Tapa et al. (2016) examined the profitability of technical
analysis using moving average crossover strategy compared with the simple buy
and hold strategy on Malaysian equity market Tapa et al. (2016).
Gurrib (2016) investigated the use of an optimized moving
average crossover strategy for the S&P 500 Gurrib (2016).
Souza et al. (2018) investigated the profitability of technical
analysis as applied to the stock markets of the BRICS member nations. They
created a portfolio containing the assets traded in the markets of each BRICS
member and developed an automated trading system that simulated transactions in
this portfolio using technical analysis technique Souza et al. (2018).
Panchal and Gor (2020) attempted to construct a hybrid strategy of
Exponential Moving Average and Parabolic Stop and Reversal which follows the
Mean Reversion process. They concluded that the hybrid strategy provides better
long and short positions in the market and good strength of trend rather than
individual indicator Panchal and Gor (2020).
Panchal and Gor (2021) applied Mean Reverting Theory on the Donchian Channel. To reduce the drawback of the Donchian Channel they combined it with RSI indicator which
is useful in volatile and normal markets. They also combined it with
fundamental factors which give better buy and sell signals Panchal and Gor (2021).
Panchal and Gor (2021) worked on Bollinger bands and Fibonacci
retracement and introduced a new concept namely Moving Fibonacci Strategy. Also,
they tried to eliminate the shortcomings of individual indicator strategy and
calculate the return obtained from the strategy through R programming Panchal and Gor (2021).
3. Strategy through Indicators
3.1. BOLLINGER BANDS PANCHAL AND GOR (2021)
Bollinger Bands is the most popular technical indicator. Its construction is simply volatility bands which are placed across the moving average. Bollinger Bands evolved from Trading Bands (Envelops). The Trading Bands or Envelops was used as a technical indicator in the mid-to late 1970s. It is the concept of shifting moving average up and down by a fixed amount or weight to obtain an envelope around price. Bollinger (2002) John Bollinger standardized Trading Bands using standard deviation for envelops. Mainly Bollinger Bands are plotted two standard deviations above and below a simple moving average. Bollinger (2002)
Calculations: Bollinger (2002)
![]()
![]()
![]()
where, ![]() and
and
![]()
The Envelops is simply based on statistical standard deviation in Bollinger Bands. So that, Bollinger Bands can be considered as volatility bands or volatility indicator. The Bollinger Bands measures market volatility too. In Bollinger Bands strategy, buy/sell signal generated when prices are nearer to or crosses the Upper/Lower Band. Bollinger Bands is useful in strong trend and inadequate when prices around the Middle Band.
3.2. FIBONACCI RETRACEMENT PANCHAL AND GOR (2021)
Fibonacci Retracement is one of the support and
resistance indicator. The Support and resistance are considered as lowest and
highest point of stock over a timeframe respectively. The Support levels
provide a floor to security’s prices that is price of security retracing from
that certain/specific level and changing in the current trend. And in the same
way resistance levels provide a roof to security’s prices that is price of
security retracing from that certain/specific level and changing the current
trend.
Fibonacci Retracement is a method of technical analysis to identify potential trend reversal. In standard Fibonacci Retracement strategy, buy and sell signal generated when prices are retraced between the 23.6% & 32.8% levels and 61.8% & 78.6% levels. Fibonacci Retracement is useful in strong reversal market and deficient in corrective market. Fibonacci Retracement levels are described using Fibonacci sequence and golden ratio.
Calculations:
There are 5 retracement level in 0% and 100%
MAX = retracement level 100% = maximum of (50 Day High price) [Gray Line]
5th Level = Retracement level 78.6% [Blue Line]
4th Level = Retracement level 61.8% [Sky-Blue Line]
3rd Level = Retracement level 50% [Green Line]
2nd Level = Retracement level 32.8% [Yellow Line]
1st Level = Retracement level 23.6% [Red Line]
MIN = retracement level 0% = minimum of (50 Day Low price) [Gray Line]
3.3. EXPONENTIAL MOVING AVERAGE PANCHAL AND GOR (2020)
An exponential moving average (EMA) is a type of moving average (MA). EMA is technique of smoothing highly fluctuated data. Simple Moving Average (SMA) gives equal weight to smoothen data whereas EMA gives exponentially diminishing weights to all past prices. Like all moving averages, this technical indicator is used to produce buy and sell signals based on the historical average. EMA is a trend indicator which helps to determine direction of the trend. When the market is in a strong and sustained uptrend, the EMA indicator line will also show an uptrend and vice-versa for a down trend. A rising EMA tends to support the price action, while a falling EMA tends to provide resistance to price action. EMAs are commonly used in conjunction with other indicators to confirm significant market moves and to gauge their validity.
EMA is easy to Calculate. The equation for calculating EMA is as follows. Mitra (2011)
![]()
Were,
![]() =
Current closing Price
=
Current closing Price
![]() =
Exponential smoothing constant =
=
Exponential smoothing constant = ![]()
![]() = Numbers of days in EMA
= Numbers of days in EMA
![]() = Previous periods
= Previous periods ![]() which is simply SMA of last
which is simply SMA of last ![]() -days
closing price.
-days
closing price.
3.4. PARABOLIC STOP AND REVERSAL (PSAR) PANCHAL AND GOR (2020)
PSAR is a time and price technical analysis tool. Parabolic SAR (PSAR) was first introduced in 1978 by Welles Wilder, Jr. in his book, “New Concepts in Technical Trading Systems”. The parabolic SAR is a technical indicator that sets trailing price stops for long or short positions. PSAR helps traders to decide entry and exit points. PSAR is mainly used to identify trend and points of potential reversal in the price movement of traded asset. PSAR is widely used to set trailing stop loss. The Parabolic SAR mainly works in trending markets and in neutral market PSAR fails to catch the trend. PSAR appears on a chart as series of dots. If dot appears above the closing price PSAR indicates it as a down trend. When dot appears below the closing price PSAR indicates it as up trend. The signals are used to set stop losses and profit targets.
In the calculation of PSAR, the first point in each Initial PSAR will be high or low value of current price. Rising and falling SAR are calculated according to the aforesaid factors differently as given in below equations I and II.
1) Rising
PSAR: Yazdi and Lashkari (2012), Welles
(1978)
![]()
2) Falling PSAR: Yazdi and Lashkari (2012), Welles (1978)
![]()
were,
· Previous PSAR = The PSAR value of previous period.
· Extreme point (EP) = The highest high of current uptrend and lowest low of the current downtrend.
· Acceleration Factor (AF) = Determines the sensitivity of the SAR. Basically, it starts from 0.02 and is increased by 0.02 every time new EP is recorded and maximum it goes up to 0.2. Each time new trend is recorded, it is back on its basic value 0.02.
3.5. DONCHIAN CHANNEL PANCHAL AND GOR (2021)
Donchian Channel indicator was developed by Richard Donchian in 1936. There are three lines in the Donchian Channel called Upper Channel, Middle Channel and Lower Channel. The upper channel shows high price of n-period, the lower channel shows low price of n-period, and the middle channel shows average of high and low price of n-period. The area between upper channel and lower channel represents the Donchian Channel. The Donchian Channel indicator is useful for determining market volatility, identifying better time entry, and identifying explosive breakout trades before it occurs in strong market and inadequate in weak market. In Dochian Channel, breakout strategy is standard strategy in which buy/sell signals generates when price crosses the Upper/Lower Channel.
Calculation:
![]()
![]()
![]()
3.6. RELATIVE STRENGTH INDEX PANCHAL AND GOR (2021)
Relative Strength
Index (RSI) was developed by J. Welles Wilder in 1978 and introduced in his
book “New Concepts in Technical Trading Systems”. RSI is a momentum indicator that measures the oscillation of directional
price movements. Momentum indicators help traders to identify the speed of
price movement by comparing prices over time. RSI oscillates between 0 and 100.
A standard RSI strategy, buy signal generate when it goes below 30 and sell
signal generates when it goes above 70.
Calculation:
![]()
were,
![]()
![]()
![]()
![]()
![]()
![]()
4. Hybrid Strategy
4.1. HYBRID STRATEGY OF DONCHIAN CHANNEL AND RSI (DCRSI) PANCHAL AND GOR (2021)
The Donchian channel is used for identifying breakout in
security price, but it cannot measure trend change in normal volatile markets.
RSI measures price moment in a normal volatile market but it cannot measure
breakout in a highly volatile market. Both indicators have drawbacks but using
them together can reduce drawbacks and increase profitability. The hybrid
strategy of Donchian Channel and RSI that follows the
steps given below.
Stepwise Procedure followed
·
Using Donchian Channel, identify whether the price of security is
upside or downside.
·
Outcomes
of Donchian Channel: Buy signal is generated when low
price is less than LC price. Sell signals is generated when high price is
greater than UC price. If these two situations do not exist, then hold.
·
Check
whether the price of security is in weak tread or strong trend through RSI.
·
Outcomes
of RSI:Buy signal is
generated when the RSI price is below than 36.Sell signal is generated when the
RSI price is above than 66. If these two situations do not exist, then hold.
·
Check
whether market is highly or normal volatile through Donchian
channel.
·
Hybrid
Strategy Outcomes: Strong buy signal is generated when Donchian
Channel and RSI both generate buy signal. Strong sell signal is generated when Donchian Channel and RSI both generate sell signal. If
these two situations do not exist, then hold.
·
Using
hybrid outcome, take position in market.
4.2. HYBRID STRATEGY OF PARABOLIC SAR AND EMA (PSAREMA) PANCHAL AND GOR (2020)
Exponential
Moving Average is calculated using number of periods and closing price of
security while PSAR is calculated on extreme high and low price of security.
Exponential Moving Average is helpful for eliminating fluctuation in security
prices. Also, it can determine whether the price of security is in buy zone or
sell zone. PSAR is a leading and lagging indicator. It is helpful to identify
the reversal market. PSAR is mainly useful to set trailing stop-loss of a
security. The signals generated by the EMA are delayed in the financial markets
which is the biggest layback of EMA. It cannot measure sudden rise and fall.
Many times, PSAR generates false reversal signals due to small corrections in
strong trend.
The EMA can
eliminate price fluctuations and the PSAR can recognize the reverse trend.
Therefore, combining these two indicators can be a profitable and effective
strategy for investing in the financial market. This Hybrid strategy works better
than single indicator strategy. The hybrid strategy of Parabolic SAR and EMA follow
the steps given below.
Stepwise Procedure followed
·
Identify
whether the price of security is in buy zone or sell zone through EMA.
·
Check
whether price of security is near or far to EMA.
·
Identify
the trend of security by PSAR.
·
Check
whether current market is normal volatile or highly volatile.
·
Hybrid
strategy outcome: When both PSAR and 5-period EMA gives UP trend we consider
LONG position and vice versa. When both contradict each other’s trend, it indicates
HOLD for investing.
·
Take
either long or short position in the market through Hybrid Strategy’s signal.
·
Identify
reversal market by Hybrid Strategy to book profit on previous position.
4.3. MOVING FIBONACCI STRATEGY (MF) PANCHAL AND GOR (2021)
Bollinger Band
is helpful to identify current trend and volatility of security and determine
the entry and exit points through Band break-out. Fibonacci Retracement is a
support and resistance indicator. It is helpful to identify different support
and resistance levels using the Golden Ratio and Fibonacci sequence. The entry
and exit signals determined by Bollinger Bands’ break-out strategy is accurate
only in strong market trends. But some problems occur in weak market or
security price closer to middle bands (moving average). That is, if the
security price lies in between bands or is closer to moving average than
determining the signal and trend prediction is difficult. With different
support and resistance levels scenarios, it is difficult to predict from which
support or resistance the prices revert back.
Due to these
types of pros and cons, we construct a strategy combining both the indicators.
The construction of Fibonacci Retracement Level in between (within) the
Bollinger Bands can help us to identify proper support or resistance level and also upcoming trend prediction if price is closer to
moving average. The Moving Fibonacci Strategy follow the steps given below.
Stepwise Procedure followed
·
Apply
Bollinger Band break out strategy on stock.
·
Place
Fibonacci Retracement Level in Bollinger Bands
·
Take
either long or short position in market through Hybrid Strategy’s signal.
·
Identify
reversal market by Hybrid Strategy to book profit on previous position.
4.4. MOVING AVERAGE CROSSOVER (CROSSOVER) MITCHELL (2022)
The most basic
strategy of moving average is Crossover strategy. In this strategy, two moving
averages with different periods are used. One of them is with a small period
considered as the short moving average and the other is the long moving
average. In Crossover strategy, Simple Moving Average and Exponential Moving
Average are commonly used. In this strategy buy signal is generated when short
period moving average crosses long period moving average from down to upside
and sell signal is generated when crosses up to down. In between moving
averages crossover, identifying the small correction in price trend
price-crossover is useful in the same manner. The Moving Average Crossover
Strategy follow the steps given below.
Stepwise Procedure followed:
·
Apply
two different period moving average with respect to timeframe.
·
Identify
the moving average crossover with direction.
·
Use
price-crossover to determine additional profitable signal in between moving average
crossover’s signal.
·
Combine
both the signals.
·
Take
either long or short position in market through Crossover’s signal.
In this work, we mainly focus
on comparing the returns of the above 4 strategies and try to explain which
strategies can be used in which market conditions. The above 4 strategies are
already described by the current authors in an earlier article using
R-Programming and Excel. In this work, we use published methods to perform
strategy on the stocks. To compare the returns of all four strategies, we plot
that return through R-Programming.
5. Research Methodology
5.1. DATA COLLECTION
|
Securities |
Index – Nifty50 and Top 50
securities of NSE |
|
Duration |
From: 15-01-2010 To: 15-01-2022 |
|
Source |
NSE website |
5.2. NOTATION
|
Name |
Notation |
|
Hybrid
Strategy of Donchian Channel and RSI |
DCRSI |
|
Hybrid Strategy of Parabolic SAR and EMA |
PSAREMA |
|
Moving
Fibonacci Strategy |
MF |
|
Moving Average Crossover |
Crossover |
5.3. COMPUTATION
We use return mapping code to calculate the return of the strategy and plot trade vs return using R-Programming. Here, we consider one trade as buying stock at a particular price and selling at a particular price and the return is the difference of the particular buying price and selling price of stock. The computation follows the steps given below.
Step-1: Identify the Buy and Sell signals using strategy.
Step-2: Calculate the number of trades over the period and record trade close date.
Step-3: Calculate the return corresponding to trade.
Steo-4: Plot the individual stock trade vs return.
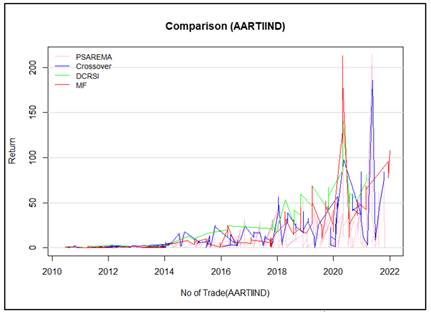
Step-5: Plot all trades of 4 strategies with respect to time for comparison.
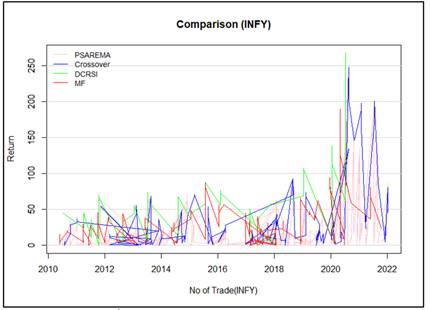
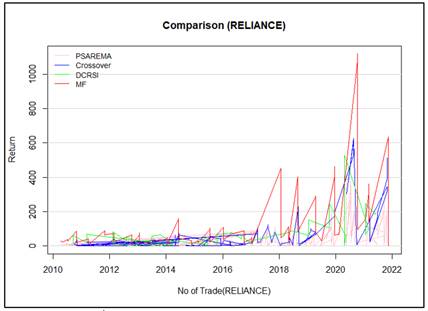
5.4. OBSERVATION
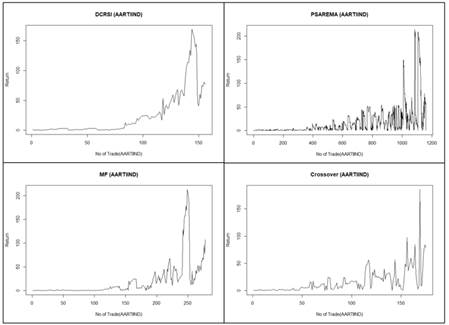
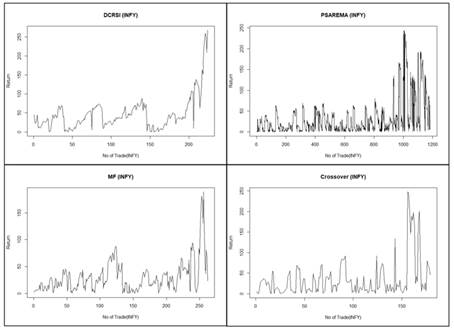
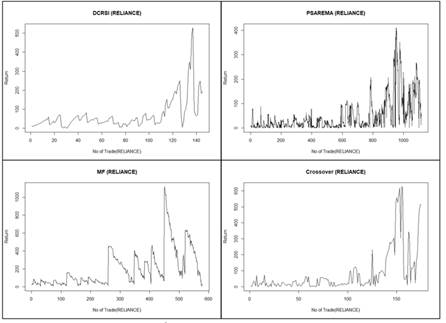
For return comparison, we use almost 12-year data of index Nifty 50 and top 50 securities of NSE. For the demonstration of this work, we use three stocks namely Reliance Industries Ltd. (RELIANCE), Infosys Ltd. (INFY) and Aarti Industries Ltd. (AARTIIND). The selection of the above stocks is random.
The Figure 1, 2, 3 are the plots of individual strategy’s trade vs return plot. And the Figure 3, 4, 5, 6 are the plots of strategy comparison time vs return plot.
|
|
|
Figure 1 AARTIIND |
|
|
|
Figure 2 INFY |
|
|
|
Figure 3 RELIANCS |
|
|
|
Figure 4 Strategy Comparison (AARTIIND) |
|
|
|
Figure 5 Strategy Comparison (INFY) |
|
|
|
Figure 6 Strategy Comparison (RELIANCE) |
|
|
6. Result AND Conclusion
From the above figures we observe that all strategies can be used in different market conditions and that all the strategies are profitable.
DCRSI Strategy: This strategy can easily identify the strong market trend and is profitable in highly buying or selling market conditions. This strategy can also be useful when a company has some fundamental event. For example, in Figure 2, INFY is the most regular company in paying dividend; this fundamental event can be captured in this strategy. In conclusion, this strategy can be useful for such a stock where sudden rise or fall is observed as well as for companies paying regular dividends.
PSAREMA Strategy: In this strategy, the number of trades is significantly higher than all others. This strategy can be useful in intraday trading. Using this strategy, we can take quick decisions in the market. Due to the large number of trades, the returns of this strategy are not very high, but the overall performance of this strategy is preserved as it takes trades at every correction of price. For example, in Figure 1, AARTIIND is the one of the high fluctuating stocks, so the performance of this strategy is best on this stock.
MF Strategy: This strategy is mainly useful in stocks which run with repetitive price patterns. In other words, MF strategy works best on the stocks that follow certain fixed patterns as this strategy is a primarily upgraded form of the Bollinger Bands and the Bollinger Bands can perform best with “M” top and “W” bottom pattern. For example, RELIANCE is one of the stocks which mostly follows the “M” top and “W” bottom pattern. This strategy is the safest strategy as compared to PSAREMA and DCRSI.
REFERENCES
Alajbeg, D., Bubaš, Z., &Vukas, J. (2012). The Effectiveness Of The 50/200 Dual Exponential Moving Average Crossover On The S&P 500. Asbbs E-Journal, 8(1), 8. Retrieved from file:///C:/Users/lenovo/Downloads/822294.alajbeg-bubas-vukas.pdf
Cory Mitchell (2022). Article on Moving Average Crossover, Retrieved from https://www.investopedia.com/articles/active-trading/052014/how-use-moving-average-buy-stocks.asp
Bollinger, J. (1992). Using Bollinger Bands. Stocks & Commodities, 10(2), 47-51 Retrieved from https://doi.org/10.1111/j.1365-2044.1992.tb03213.x
Bollinger, J. (2002). Bollinger on Bollinger bands (p. 0). New York : McGraw-Hill.
Gurrib, I. (2016). The Moving Average Crossover Strategy : Does It Work for the S&P500 Market Index ? Gurrib, I. (2016), Optimization of the Double Crossover Strategy for the S&P500 Market Index, Global Review of Accounting and Finance, 7(1), 92-107. Retrieved from https://doi.org/10.21102/graf.2016.03.71.07
Mitra, S. K. (2011). Usefulness of moving average based trading rules in India. International Journal of Business and Management, 6(7), 199-206. Retrieved from https://doi.org/10.5539/ijbm.v6n7p199
Otake, T., &Fallou, F. (2013). Can we apply Fibonacci retracement in the African market ? African Journal of Business Management, 7(24), Retrieved from https://academicjournals.org/journal/AJBM/article-abstract/2C5449721519
Panchal, M., &Gor, R. (2020) A hybrid strategy using Mean Reverting Indictor PSAR and EMA. IOSR Journal of Mathematics (IOSR-JM) e-ISSN : 2278-5728, p-ISSN : 2319-765X. Volume 16, Issue 5 Ser. III, PP 11-22.
Panchal, M., &Gor, R. (2021) A hybrid strategy using Mean Reverting Indictor Donchian Channel and RSI. IOSR Journal of Economics and Finance (IOSR-JEF) e-ISSN : 2321-5933, p-ISSN : 2321-5925. Volume 12, Issue 1 Ser. I, PP 37-45.
Panchal, M., &Gor, R. (2021) Moving Fibonacci Strategy using Bollinger Bands. IOSR Journal of Mathematics (IOSR-JM) e-ISSN : 2278-5728, p-ISSN : 2319-765X. Volume 17, Issue 6 Ser. II, PP 35-40.
Tapa, A., Yean, S. C., & Ahmad, S. N. (2016). Modified Moving-average Crossover Trading Strategy : Evidence in Malaysia Equity Market. International Journal of Economics and Financial Issues, 6(7S), 149-153. Retrieved from https://doi.org/10.15405/epsbs.2016.08.111
Welles J. Wilder. (1978) New Concepts in Technical Trading Systems Trend Research, 0894590278,978-0894590276.
Yazdi, S. H. M., & Lashkari, Z. H. (2012, November). Technical analysis of Forex by Parabolic SAR Indicator. In International Islamic Accounting and Finance Conference. Retrieved from https://d1wqtxts1xzle7.cloudfront.net/52524886/Technical_analysis_of_Forex_by_Parabolic20170407-28966-d8zcbm-with-cover-page-v2.pdf?Expires=1644222932&Signature=YP9YAsUH9q4SzzfStUvu~3wWKjPOyehBMgsdhQXaGZu5DdsHxwwoNUfE6PoJIu3Y0JRbpM9atpbQR886Qa1MOMw28HeM9Z~9zsOy6QFkr29ftbwFDhxkOgsU3INnbtWSysM~ndfsTpSfdcf0Z2ROkSlSabLA56-XCzNqKRa2AJS9em9wuK8WkUV9k-iV2gzctoLQw23~50qiJ7WbDjN-Ra-~0t1kVRJQnuqZj1Pi58ky1Tc5SOTZA3E9tjo9tot858xwq41niFxr8oczQNYT5cpdwFc~PzY5SPRNVF1ho9bK-OXp118oH8KvxsIFQTFlVIkS38SuOvltoFuEQ4L7Aw__&Key-Pair-Id=APKAJLOHF5GGSLRBV4ZA
De Souza, M. J. S., Ramos, D. G. F., Pena, M. G., Sobreiro, V. A., & Kimura, H. (2018). Examination of the profitability of technical analysis based on moving average strategies in BRICS. Financial Innovation, 4(1), 1-18. Retrieved from https://doi.org/10.1186/s40854-018-0087-z
 This work is licensed under a: Creative Commons Attribution 4.0 International License
© Granthaalayah 2014-2022. All Rights Reserved.