0BCONSTRUCTION OF AN ACCELERATED AGING TEST SYSTEM FOR SERIES CONNECTION BATTERY PACKHao
Liu 1 2B1 Assistant Professor, Department of Mechanical Engineering, Keimyung University, Daegu (42601), South Korea.1B2 Ph. D Program, Graduate School of Mechanical Engineering, Keimyung University, Daegu (42601), South Korea.3
Professor, Department of Mechanical engineering, Keimyung University, Daegu
(42601), South Korea |
|
||
|
|
|||
|
Received 15 December 2021 Accepted 30 December 2021 Published 26 January 2022 Corresponding Author Hao
Liu, liuhao@kmu.ac.kr DOI 10.29121/IJOEST.v6.i1.2022.272 Funding:
This
research received no specific grant from any funding agency in the public,
commercial, or not-for-profit sectors. Copyright:
© 2022
The Author(s). This is an open access article distributed under the terms of
the Creative Commons Attribution License, which permits unrestricted use, distribution,
and reproduction in any medium, provided the original author and source are
credited.
|
ABSTRACT |
|
|
|
Nowadays,
Lithium-ion batteries are widely used in various aspects, such as mobile
electronic devices, mobility, EVs, and so on. Exactly to estimate State of
Health (SoH) and Remaining Useful Life (RUL) becomes more and more necessary
for realistic applications. Accelerated aging test can provide reliable
experimental data for research of SoH estimation. An accelerated aging test
system for a battery pack was designed in the research, which included
hardware design and programming of test system control and monitoring. After
establishment of the test system, several test cycles were implemented, and
the acquired data indicated that the developed aging test system worked very
well and can be used for degradation experiment of the Lithium-ion battery
pack in future work. |
|
||
|
Keywords: Accelerated Aging Test, Lithium-Ion Battery Pack, Battery Internal
Resistance. Test System Design, State of Health (SoH) 1. INTRODUCTION With use of limited
fossil fuel and climate change, demand of green and renewable energy sources
is increasing greatly and continuously Hu et al. (2020). Secondary
batteries, especially Lithium-ion batteries, have been widely used in various
aspects, such as electronic devices Vetter et al. (2005), mobility, EVs Lin et al. (2015), Rezvanizanian et al.
(2012). However,
performance of Lithium-ion batteries degrades gradually with repetitive
operation of charge and discharge Hu et al. (2020), Kai et al. (2008). Many
researchers have focused on this field and developed estimation algorithms of
battery aging, such as State of Health (SoH) and Remaining Useful Life (RUL) Xu et al. (2013), Gregory (2016). It is
significantly important to use realistic battery aging data to validate those
algorithms. There are some publicized data set Saha and Goebel (2007), CALCE of Lithium-ion battery in internet,
one of which is provided by NASA Ames Prognostics Data Repository and has
been used by many researchers. Most of these datasets are relative to single
cell. However, we are going to investigate SoH prediction for a Lithium-ion
battery pack. Thus, the aim of the research is to establish a set of
accelerated aging test system for a battery pack that consists of two batter
cells in series connection. The parameters of accelerated aging test can be
set in the developed test system. During test period, voltage and current of
battery cells in charge and discharge processes can be obtained and,
meanwhile, internal resistance (IR) of the cells is acquired too. We can utilize
these data |
|
||
sets to estimate SoH of the battery pack or to predict its RUL based on some algorithm.
The layout of the paper is as below. The test system
designed includes hardware design and programming of control as well as
monitoring, which are presented in the section 2 and 3, respectively. After
establishing the test system, we did several cycle experiments and demonstrated
a typical data set in the section 4. Conclusions are given in the last section.
2. DESIGN OF HARDWARE ARCHITECTURE
Repeating charge and
discharge cycles results in accelerated aging of the batteries, meanwhile, some
parameters of batteries are measured to evaluate the batteries for the future
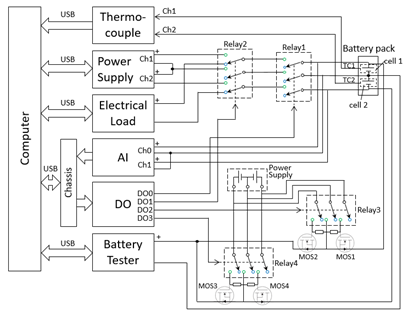
and to ensure safety of entire experiment process. Figure 1 shows the architecture of accelerated aging test system for a battery
pack, whose structure can be divided into three parts, a battery pack of two
cells with serial connection, test and measurement instruments, and electrical
circuit control part. The electrical circuit control part changes connection
between the battery pack and the instruments. The battery pack, the object in
the research, consists of two 18650 Lithium-ion batteries (cell 1 and cell 2)
connected in serial. It will be described in detail in the following contents how to design
hardware architecture. Table 1 gives typical specifications of the instruments shown in Figure 1.
|
|
|
Figure 1 Architecture of accelerated aging battery test system for a battery
pack |
|
Table 1 Typical
specifications and functions of instruments in battery aging test system |
||
|
Name |
Specifications |
Function |
|
Programmable
DC Power Supply (PPS) |
·
2Ch:
30V/3A, 30V/3A |
Charge the
batteries |
|
·
Output
mode: CV, CC |
||
|
·
USB
interface port with SCPI |
||
|
Programmable
Electronic Load (PEL) |
·
1Ch: Max
150V/10A, 200W |
Discharge the
batteries |
|
·
Working
mode: CV, CC, CR, CP |
||
|
·
USB
interface port with SCPI |
||
|
Battery
Tester (BT) |
·
1Ch |
Measure
internal resistance of the batteries |
|
·
Voltage:
0.01mV ~ 400.00V |
||
|
·
Resistance:
0.1μΩ ~ 3.2kΩ |
||
|
·
Trigger:
internal or external |
||
|
·
USB
interface port with SCPI |
||
|
Analog Input (AI) |
·
32Ch
single-ended input |
Measure voltages of
the batteries |
|
·
16Ch
differential input |
||
|
·
Input
voltage range: ±200 mV to ±10 V |
||
|
·
Sampling
rate: 250kS/s |
||
|
·
Resolution:
16bit |
||
|
Digital
Output (DO) |
·
16Ch
DO |
Control
relays on/off |
|
·
500μs
sourcing DO |
||
|
·
External
power supply voltage range: 6VDC ~ 30VDC |
||
|
Thermocouple |
·
J-type |
Measure
temperatures on battery surface |
|
·
USB
interface |
||
|
Relay |
·
4Ch NC and
NO |
Control current
direction and MOSFET on/off |
|
·
Excitation
voltage: 24VDC |
||
|
MOSFET |
·
Type:
N-channel |
Control cell 1 and
2 to connect to the battery tester |
|
·
RDS
(on): 2.0mΩ |
||
|
·
VGS
(th): 2.0V |
||
2.1. REALIZATION OF CHARGE AND DISCHARGE FUNCTIONS
A Programmable DC Power
Supply (PPS) with two output channels was used to charge a battery pack, while
a Programmable Electronic Load (PEL) was served as a load to discharge
electricity from the battery pack. Relay 1 and relay 2 control whether the
battery pack connects with PPS or PEL so as to implement charge or discharge
process. In the normal state, in which the relays 1 and 2 are off, the battery
pack does not connect with PPS or PEL. However, if switch on the relay 1 the
battery pack is connected with the PEL, and discharge can be executed for two
cells in serial connection by the same discharge current. The function of the
relay 2 is to select charge or discharge connection with the battery pack. If
the relay 2 is on the cells 1 and 2 are designed to electrically connect with
channel 1 and 2 of the programmable power supply, respectively. Note that two
channels of PPS are set as serial output mode, namely that the negative
terminal of the channel 1 is shorted with the positive terminal of the channel
2.
2.2. REALIZATION OF MEASUREMENT OF INTERNAL RESISTANCE
In order
to evaluate degree of degradation of the battery pack, a battery tester (BT)
for measurement of internal resistance (IR) for batteries was introduced in the
test system. It was found that the IR of the Li-ion battery could not be
accurately measured when the battery is in charge process. As a result,
switches between the battery pack and the BT are necessary to ensure accurate
data measurement and to change circuit in order to acquire individual IRs of
two cells. However, there are two problems which should be solved when we
design circuit connected to the battery tester. One problem is how to reduce
contact resistance in the internal resistance measurement circuit, while other
problem is how automatically to alter the connection circuit so that the BT
with only one input channel could measure IRs of two batteries by turns without
causing short of the batteries.
The
first problem is solved by using MOSFET as switch because it has very low
resistance (RDS (on)) between drain and source when the control voltage is greater than gate
threshold voltage (VGS (th)). Another reason of using MOSFET is that RDS (on) is stable and not fluctuant,
provided that the voltage at gate terminal is stable. In contrast to this,
contact resistance between contacts of a relay is not stable with repetitive on/off
operation. Moreover, the measurement branch points of the BT are not to locate
on the path between relay 1 and 2, but directly to contact with three lead
lines of the battery pack in order to reduce influence of resistance inside the
circuit.
In
order to solve the second problem, in the design as shown in Figure 1, the negative terminal of the BT
is connected with the central lead wire of the battery pack, while the positive
terminal of the BT is connected with the positive and negative terminals of the
battery pack via four MOSFETs. If MOS1 and MOS2 in on state, MOS3 and MOS4 in
off state, the positive terminal of the BT connects with the positive of the
battery pack. Thus, the BT can measure IR of the cell 1. And vice versa, if
MOS1 and MOS2 in off state, MOS3 and MOS4 in on state, the positive terminal of
the BT connected with the negative of the battery pack, which indicate that IR
of cell 2 can be measured. But the measured voltage of the cell 2 by the BT is
displayed in negative value. The reason why using two MOSFETs in one wire as a
switch is that there exists a body diode in a MOS, which can allow reverse
current to flow if the battery voltage is greater than body diode forward voltage
(VSD), yielding serious short accident. As a result, two MOSFETs are
reversely connected in serial, which can prevent short. Note that four MOSFETs
are never be switched on at the same time, otherwise short accident would
happen. One independent power supply with double voltages is utilized to
provide the gate voltages to either MOS1 and MOS2 or MOS3 and MOS4 via the
relay 3 or the relay 4.
2.3. FUNCTION REALIZATION OF CONTROL AND MONITORING
In order
to realize the functions of charge/discharge and IR measurement, four relays
are used in the battery pack aging test system. The roles of the relays 1 and 2
are to determine whether the battery pack is isolated from the PPS or the PEL
and whether it connects with the PPS or the PEL to execute charge or discharge
process. Moreover, functions of the relays 3 and 4 are to isolate the battery
pack from the BT and to establish independent connections between the BT and
the cell 1 or the cell 2. A digital output (DO) device, whose four output
channels are designated, controls the four relays. A 24VDC power should be
provided to the DO device so that it can directly drive relays.
An analogue
input (AI) device is utilized to measure voltages of the cell 1 and 2. The
measurement points are directly set at the battery pack in order to get rid of
effect of voltage drop along lead wire or across contactors of relays. Since
the AI device shares a common ground for all single-ended channels, the
positive terminals of AI channel 1 and 2 are set to connect with the positive
and negative of the battery pact, respectively. Thus, the AI channel 1 measures
voltage of the cell 1 while the channel 2 acquires that of the cell 2 but with
negative value due to inverse connection of the channel 2 on the cell 2.
Li-ion
batteries are sensitive to temperature and too high temperature easily causes
heat out of control. Therefore, it is very significantly important to monitor
temperature variation of two cells during charge and discharge processes. Two
thermocouples with USB interface are attached on surfaces of two cells,
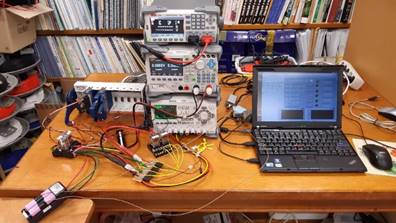
respectively. Finally, the entire accelerated aging test system for the battery
pack was set up as shown in Figure 2.
|
|
|
Figure 2 Photo of accelerated aging test system for the battery pack |
3. design of CONTROL LOGIC
According
to the test procedure of battery data set [Saha and Goebel (2007), one battery test cycle comprised two stages, charge and discharge.
Charge process was carried out in CC mode until the battery voltage reached a
certain setting voltage (4.2V) and then continued in CV mode until the charge
current reduced to a certain current (20mA). For the sake of safety, the rest
process was added after charge stage as well as after discharge in our
accelerated aging test. The control program was written based on the platform of
LabVIEW, considering convenience of interface with hardware.
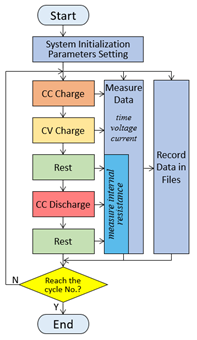
Figure 3 (a) illustrates the main flowchart
of the control program, which is made of sequential, parallel, and loop
structure. The loop structure is to execute cycle of charge and discharge
processes. In each cycle, charge and discharge stages as well as rest stage are
organized sequentially. Meanwhile, some important variables, such as time, cell
voltages, charge/discharge current, cell internal resistance, should be
simultaneously measured and recorded in data files. The cell voltages can be
measured via AI device and current in charge and discharge stages can be read
from the PPS and PEL, respectively. The BT can measure internal resistance of
two cells only in the discharge and rest processes. At the same time, these
measured data is written in an ASCII file.
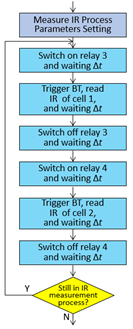
As mentioned in 2.2 section,
the relays 3 and 4 provide gate voltage to the four MOSFETs, so the BT can
separately connect to only one cell and measure its IR. Any short connection of
the cells must be strictly avoided. Therefore, the detail steps of IR
measurement process shown in Figure 3(b) indicates that a waiting time is
attached after each action of relay on/off and IR measurement to guarantee no short connection
even in an instant. These steps repeat until
discharge or rest processes finish.
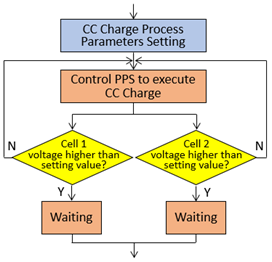
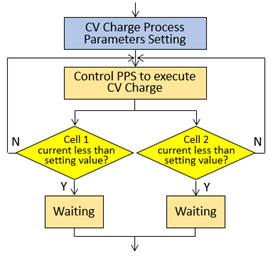
Figure 3 (c) and Figure 3 (d) illustrate flowcharts of CC and
CV charge stages. Considering difference of the two cells in the battery pack,
it is designed that independent charge is executed for them, which is like BMS
function. The setting parameters, such as voltage and current, should be sent
to the PPS before the charge processes starts. During the charge process, the
voltages across the cells and the charging currents are under continuous
monitoring. If the voltage across a cell in the CC charge process reaches the
setting voltage, its CC charge will stop and wait until another cell finishes
CC charge. Similarly, in the CV charge process, if the charge current of a cell
becomes less than the setting current, its CV charge will stop too and wait
until another cell finishes this process.
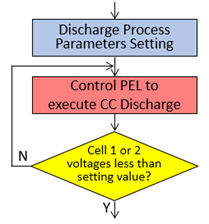
On the other hand, the
battery pack made by serial connection of two cells is designed to experience
CC discharge by the same current. The terminative condition of the process is
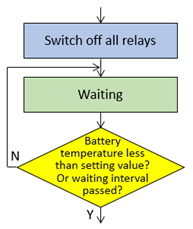
that the voltage of any cell is less than the setting value, as shown in Figure 3 (e). In the rest process, after
switching off all the relays, nothing is done but wait, and the terminative
condition depends on whether battery temperature decreases enough or whether
the designated waiting interval passes, as shown in Figure 3 (f)
|
(a) Flowchart of main program (b)
Flowchart of cell IR measurement
(c) Flowchart of CC charge (d)
Flowchart of CV charge
(e) Flowchart of CC discharge (f) Flowchart
of rest |
|
Figure 3 Program flowcharts of
accelerated aging test system for battery pack |
According
to hardware design of the test system mentioned in the section 2 and flowcharts
of test program, operation states of the PPS, PEL, BT, AI device, TC device, DO
device (relays) are summarized in Table 2. It can be seen that measurement
of cell voltages and temperature is implemented throughout all stages. In other
stages, the corresponding instruments work according to Table 2.
|
Table 2 Operation states of all components in each
stage (Note: ★:
measure, 0: OFF, 1: ON) |
||||||||||||
|
Stages |
PPS |
PEL |
AI |
TC |
DO |
BT |
||||||
|
Ch1 |
Ch2 |
Ch0 |
Ch0 |
Ch1 |
Ch0 |
Ch1 |
Ch3 |
Ch 2 |
Ch 1 |
Ch 0 |
Ch0 |
|
|
CC charge |
ON |
ON |
OFF |
★ |
★ |
★ |
★ |
OFF |
OFF |
ON |
ON |
OFF |
|
CV charge |
ON |
ON |
OFF |
★ |
★ |
★ |
★ |
OFF |
OFF |
ON |
ON |
OFF |
|
CC discharge |
OFF |
OFF |
ON |
★ |
★ |
★ |
★ |
OFF |
OFF |
OFF |
ON |
ON |
|
Rest |
OFF |
OFF |
OFF |
★ |
★ |
★ |
★ |
OFF |
OFF |
OFF |
OFF |
ON |
|
Measure cell 1 IR |
OFF |
OFF |
OFF |
★ |
★ |
★ |
★ |
OFF |
ON |
OFF |
OFF |
ON |
|
Measure cell
2 IR |
OFF |
OFF |
OFF |
★ |
★ |
★ |
★ |
ON |
OFF |
OFF |
OFF |
ON |
4. REPRESENTATION OF typical ACQUIRED DATA
The
accelerated aging test system for the battery pack was established according to
the section 2 and 3. However, before a formal aging test is implemented, we
should execute serval cycle for the battery pack in order to activate
electrochemical performance of the battery cell. The cell was Lithium-ion 18650
battery with 2600mAh. Several cycles test has been done. One typical cycle was
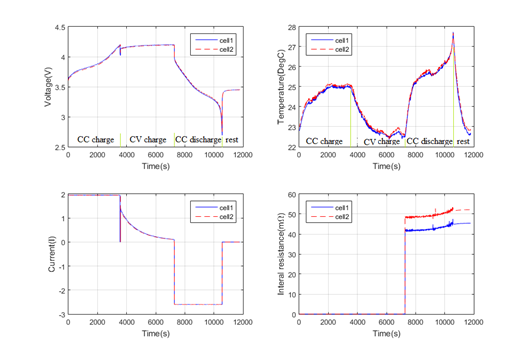
selected, and its acquired data set was plotted and shown in Figure 4. The cycle sequentially included
four stages: CC charge, CV charge, CC discharge, and rest. There was not rest
stage after charging due to temperature of the battery pack was not high. It
can be seen that it took about 2 hours to charge the battery pack and about one
hour to discharge. The charge current represents in positive value while
discharge current in negative on the figure. Cell temperature went up during CC
charge since the current is 1.95A (0.75C) and then reduced in CV charge.
However, it rapidly rose up in the beginning of CC discharge. Moreover,
temperature sharply increased again in the end of this stage, and, at the same
time, the cell voltages decreased abruptly as it lower than 3.2V. If
investigating internal resistance, we can find that it gradually increases with
increasing of depth of discharge. In addition, there exists offset value
between the internal resistance of the cell 1 and that of the cell 2 since the
two cells have different IR in initial state. Of course, more analysis can be
implemented once more aging cycle test is done. In conclusion, data acquired by
the accelerated aging test system is valid.
|
|
|
Figure 4 Typical
test results: voltage, current, temperature, and internal resistance |
5. CONCLUSIONS
The
research proposed a design of accelerated aging test system for the battery
pack, which consists of two cells in serial connection. This test system mainly
comprises a programmable power supply, a programmable electronic load, and a
battery internal resistance tester, and it can implement degradation cycle test
of charge and discharge as well as measurement of internal resistance of two
cells. Voltage, current, and temperature of two cells can be monitored
individually too. A trail run of several cycles has been done by using the
design test system and it is found that the measured data set is acceptable and
valid. Next work is to utilize the developed test system to implement aging
cycle test so that we can analyze obtained data to estimate SoH of the
Lithium-ion battery pack.
ACKNOWLEDGEMENTS
Outcomes of this research are results of a study on the “Convergence and Open Sharing System” Project, supported by the Ministry of Education and National Research Foundation of Korea.
REFERENCES
Chen, Y., & Huang, M. (2016). A Method of Battery State of Health Prediction based on AR-Particle Filter. SAE Technical Paper 2016-01-1212. Retrieved from https://doi.org/10.4271/2016-01-1212
Gregory, L. P. (2015). Battery Management Systems Volume I Battery Modeling. Artech House.
Gregory, L. P. (2016). Battery Management Systems Volume II Equivalent-Circuit Methods. Artech House
Hu, X. S., Xu, L., Lin, X. K., & Pecht, M. (2020). Battery Lifetime Prognostics. Joule, 4(2), 310-346. Retrieved from https://doi.org/10.1016/j.joule.2019.11.018
Jiang, J. C., Zhang, C. P. (2015). Fundamentals and Applications of Lithium‐ion Batteries in Electric Drive Vehicles. John Wiley & Sons. Retrieved from https://doi.org/10.1002/9781118414798
Kai, G., Bhaskar, S., Abhinav, S., et al. (2008). Prognostics in Battery Health Management. IEEE Instrumentation & Measurement Magazine, 11(4), 33-40. Retrieved from https://doi.org/10.1109/MIM.2008.4579269
Lin, C., Tang, A. H., & Wang, W. W. (2015). A review of SOH estimation methods in Lithium-ion batteries for electric vehicle applications. Energy Procedia, 75, 1920-1925. Retrieved from https://doi.org/10.1016/j.egypro.2015.07.199
Rezvanizanian, S. M., Huang, Y. X., Chuan, J., & Lee, J. (2012). A Mobility Performance Assessment on Plug-in EV Battery. International Journal of Prognostics and Health Management, 3(2), Retrieved from https://doi.org/10.36001/ijphm.2012.v3i2.1363
Saha, B., & Goebel, K. (2007). Battery Data Set, NASA Ames Prognostics Data Repository, NASA Ames Research Center, Moffett Field, CA. Retrieved from https://ti.arc.nasa.gov/tech/dash/groups/pcoe/prognostic-data-repository/
Verena, K., Mårten, B., Göran, L. (2014). A support vector machine-based state-of-health estimation method for lithium-ion batteries under electric vehicle operation. Journal of Power Sources, 270(15), 262-272. Retrieved from https://doi.org/10.1016/j.jpowsour.2014.07.116
Vetter, J., Novak, P., Wagner, M. R., et al. (2005). Ageing mechanisms in lithium-ion batteries. Journal of Power Sources, 147(1-2), 269-281. Retrieved from https://doi.org/10.1016/j.jpowsour.2005.01.006
Vasan, A. S. S., Mahadeo, D. M., Doraiswam, R., Huang, Y., and Pecht, M. (2013) Point-of-care biosensor system. Center for Advanced LifeCycle Engineering (CALCE). https://calce.umd.edu/battery-data. 39-71 january 1
Xu, J., Mi, C. C., Cao, B. G., Cao, J. Y. (2013). A new method to estimate the state of charge of lithium-ion batteries based on the battery impedance model. Journal of Power Sources, 233(1), 277-284. Retrieved from https://doi.org/10.1016/j.jpowsour.2013.01.094
 This work is licensed under a: Creative Commons Attribution 4.0 International License
© Granthaalayah 2014-2022. All Rights Reserved.