
ANALYSIS OF MOTOR BEHAVIOR AND NEUROPLASTICITY IN AN EXPERIMENTAL MODEL OF HEMIPLEGIA TREATED WITH TRANSCRANIAL THERAPY
Abstract
Stroke is one of the leading causes of death worldwide; its severity is associated with high death rates and motor, cognitive, and sensory sequelae. Several interventions have been proposed in recent years to prevent and primarily treat stroke. LED stands out as one of these interventions; it indicates promising results because it stimulates cellular metabolism, increasing the cellular regenerative potential, and promoting neurogenesis. Thus, the present study evaluated the effects of 630 nm LED in animals submitted to ischemic stroke by analyzing neurogenesis and motor behavior. This was an experimental study with a controlled qualitative and quantitative intervention, with a sample of 30 male Wistar Rattus norvegicus divided into two groups: a control group and treated group, consisting of 15 animals each. The experimental time points were 3, 7, and 21 days of treatment. All animals were submitted to stereotactic surgery for the implantation of an electrode and subsequent electrolytic lesion. The quantitative results in the three experimental time points indicate treatment superiority using the 630 nm LED compared to the control group. The histological findings also showed increased neo-formed tissue in the treated group at 3, 7, and 21 days of treatment when compared to the control group. Hence, the results suggest that the 630 nm LED guided treatment in the experimental time points of 3, 7, and 21 days was superior to those in the control group, showing animals with increased motor response according to the apprehension test, and improved neurogenesis according to the histological evaluation.
Keywords
Stroke, 630 Nm LED, Neurogenesis, Motor Behavior
INTRODUCTION
Stroke is a vascular injury that occurs in the brain and can cause damage by disrupting blood supply. This lesion becomes increasingly challenging because it remains a worldwide cause of death and severe long-term disability in the last 40 years, especially in regions with a high concentration of individuals over 65 years of age, generating great economic and social impact. (Thrift et al., 2014), (Yang et al., 2018)
Clinical and experimental studies demonstrate that both types of stroke cause permanent impairments that result from motor and sensory deficits observed in the hemibody, opposite to the site of injury, and with hemiplegia or hemiparesis characteristics, swallowing disorder (dysphasia), and a decline in cognitive functions. (Altman et al., 2007), (Liu et al., 2013)
The main goal of rehabilitation is to improve strength and functionality and minimize cognitive impairment. There are many rehabilitation methods. However, the use of the Light Emitting Diode (LED) has been studied by many researchers. (Andrabi, Parvez, & Tabassum, 2017), (Hi et al., 2017), (Yang et al., 2018)
The near red or infrared light is commonly used to stimulate or regenerate tissues in a treatment called photobiomodulation. It is a therapeutic tool used for the treatment of tissue lesions. This intervention may induce tissue healing, reduce edema and inflammation, alter pain threshold, potentiate cellular metabolism, and contribute to cellular neoformation. (Naeser et al., 2012), (Xuan, Vatansever, Huang, & Hamblin, 2014)
The physiological effects of photobiomodulation include the stimulation of mitochondria to increase the production of adenosine triphosphate (ATP) by increasing the effect of cytochrome c oxidase (CCO). CCO acts by absorbing photons and avoiding the inhibitory effect of nitric oxide (NO). Thus, there is an increase in mitochondrial membrane potential, oxygen consumption, and metabolized glucose, with more ATP produced. (Wong-Riley et al., 2005) Another important contribution of photobiomodulation is the inhibition of microglial activation, acting as a strong antioxidant and promoting an anti-inflammatory effect (increased mitochondrial superoxide dismutase). (Sompol, Xu, Ittarat, Daosukho, & Clair, 2006)
Photobiomodulation may be responsible for increased local blood flow, especially in the brain tissue, potentiating protein expression through signaling mediators and transcription activation, which in turn may promote neurogenesis and synaptogenesis. (Naeser et al., 2012), (Xuan et al., 2014)
LED is a promising tool in the treatment of several diseases, and can act beneficially in the pathological state of several neurological disorders, including stroke because it can modulate reactive oxygen species, activate mitochondrial DNA replication, increase early response genes, increase growth factor expression, and induce synapses. Several animal studies have shown satisfactory results when investigating neurogenesis. (Henderson, Morries, & Cassano, 2015), (Hi et al., 2017), (Yang et al., 2018)
Neurogenesis is the biological process that involves coordinated proliferation, differentiation, and migration of cells for the formation of neural brain tissue; neurogenesis may be involved in targeting the repair of damaged tissues in ischemic stroke. Animal studies using LEDs as a treatment method in neural lesions demonstrated increased neurogenesis and tissue repair. (Ta, 2016), (Wang, Yang, & Wang, 2015), (Baptista & Andrade, 2018), (Shohayeb, Diab, Ahmed, & Ng, 2018)
Thus, this study evaluated the effects of 630 nm LED as a treatment method in animals submitted to ischemic stroke through the analysis of neurogenesis and motor behavior.
METHODOLOGY
This was an experimental study with a controlled qualitative and quantitative intervention.
Sampling
All experiments were carried out according to the Ethics Committee on Animal Use - CEUA from the Midwest State University – UNICENTRO and according to protocol 034/2017.
Characteristics of the sample
The sample consisted of 30 Wistars Rattus Norvegicus males, weighing approximately 200 grams, and acquired from the animal facility of the State University of Londrina – UEL. The experiments were performed in the Laboratory of Neuroanatomy and Neurophysiology at UNICENTRO, where animals were kept in groups of 5 per cage with water and food ad libitum. They food fasted for 8 hours and were water restricted for 4 hours before surgery. They were submitted to a controlled light/dark cycle of 12 hours (lights on from 7 a.m. to 7 p.m.) and room temperature of 23 ± 1 °C.
Experimental Groups
The 30 animals were divided into two groups:
The Control Baseline (CBL) within 15 animals was divided equally into three subgroups: 3-day positive control group (GC3), with euthanasia on the fourth day; 7 days positive control group (GC7), with euthanasia on the eighth day; and 21 days positive control group (GC21), with euthanasia on the twenty-second day. There was no LED irradiation intervention in the animals in these groups.
Experimental Group treated with 630 nm LED (GT6) with 15 animals divided equally into three subgroups: 3 days treated group (GT6-3), with euthanasia on the fourth day; 7 days treated group (GT6-7), with euthanasia on the eighth day; and 21 days treated group (GT6-21), with euthanasia on the twenty-second day.
Both groups were measured before lesions; baseline measurements were established as Control Baseline (LBC) and Treated Baseline (LBT).
Surgical Procedures
The animals were anesthetized intra-abdominally with a solution containing 80 mg/kg of Ketamine Hydrochloride (10 ml vial) and 15 mg/kg of Xylazine Hydrochloride (10 ml vial), and transferred to a stereotaxic device (model David Kopf, USA) where their heads were fixed by the external auditory canal and upper incisors.
A portion of the tissue overlying the skull was cut out, leaving the skull cap exposed; this area was cleaned with 2% hydrogen peroxide and the bregma was located and used as a reference point. The skull was drilled with a 2 mm dental drill to implant the electrode in the calvaria bone in order to reach the internal capsule.
The implant site was determined from the stereotactic coordinates from the Paxinos and Watson atlas (Gc, 1986). The stereotactic coordinates used were AP = -1.72 mm, ML = -3.4 mm, and DV = 4.4 mm, respectively, taking the bregma as the reference with the lambdoid and bregmatic sutures in the same horizontal plane. After implantation, the electrodes were fixed to the calvaria by an auto - polymerizing acrylic prosthesis using the VIPIFLASH Auto - Polymerizable® Acrylic Resin Kit.
The animals rested in cages with water and food ad libitum for five days. They were subsequently anesthetized with the same solution described above, taken back to the stereotaxic device where they received an electric current passage of 20 mA for 45 seconds using the DC POWER SUPPLY MPS-3005 equipment. The electrodes were made with enamel wire number 34 with a length of 10 millimeters.
Procedures for conducting the tests
A pilot testing was conducted in one Wistar Rattus Norvegicus to evaluate the safety and applicability of the test.
Apprehension Test
The Apprehension Test was performed to evaluate the animal’s functional recovery or motor behavior. This test was conducted in an illuminated environment, free of noise, and with controlled temperature at 23 ± 1 ºC; a portable multipurpose digital scale and a metal grid measuring 7x7 cm, connected to the scale, were used.
The test was performed by the examiner hanging the animal by the tail, allowing it to grasp the grid connected to the electronic scale with the front legs; therefore, the force exerted by the animal was recorded in grams on the scale display. The test was repeated three times with each animal in the treated and control groups: post-injury and post-treatment in the treated groups, or pre-euthanasia in the control group. The average of the highest values recorded in the scale was taken. (Bertelli & Mira, 1995)
Open Field Evaluation Protocol
Motor behavior was analyzed by placing each animal in the center of an exposed Open Field for a period of 5 minutes, during which the behaviors were recorded by a camcorder and later analyzed manually. The ethological analysis of behaviors considered the number of elevations (standing up position) and freezing (stillness). The elevation position was considered only when the animal was supporting the body on its hind legs. The freezing behavior was considered when the animal remained static. The floor of this arena was cleaned with 70% alcohol between exposure of each animal, it was allowed to dry well with air circulation before using it again. (Sestakova, Puzserova, Kluknavsky, & Bernatova, 2013), (Al et al., 2017)
LED Treatment Protocol
The LED used in this study was made of PVC material (Polyvinyl chloride), and consisted of seven LEDs, each with a 5 mm diameter encapsulation and geometrically positioned 1 mm apart from each other. The set of lights focused in one single area, resulting in an intensity value compatible with the clinical application using the "photobiomodulation" technique, starting at one-centimeter distance. The LEDs emitted light in the red at λ = 630 nm with a potency of 70 mW measured with the Thor Labs model: PM100D equipment. The used LED has RL5-R12008 as the part number and is from the Superbright LEDs company.
The application was punctual and of contact, thus optimizing the use of the biophysical properties of the LED in the region of the brain. The applications in the experimental period of each treated group lasted for 104 seconds, once a day. The dose used was 7 J/cm² in the experimental groups, totaling an energy density of 21 J/cm² in the 3-day treatment group; 49 J/cm2 in the 7-day treatment group; and 147 J/cm2 in the 21-day treatment group. (Kerppers, Lima, Fernandes, & Villaverde, 2015)
Use of Analgesics
The sample was separated, and Tramadol 2 mg/kg diluted in 0.2 ml of water was gavaged 12/12 hours.
Neurological evaluation
Neurological examination was performed after the animal returned from anesthesia, according to a scale of 0 to 5. (0) Zero: no neurological deficit; (1) one: loss of movement in the right front paw; (2) two: it circulates to the right in an inconstant way; (3) three: circulates to the right steadily and/or falls to the side; (4) four: sensory depression; and (5) five: death.
Animals that had scores between two (2) and five (5) were discarded from the groups and replaced to complete the group with 15 animals, and five animals per subgroup. Remaining only animals that had a score of one (1).
Euthanasia
The animals were carefully separated before euthanasia in order to avoid stress. Each animal was immobilized and infused intraperitoneally with 80 mg/kg of ketamine and 15 mg/kg of xylazine; once anesthesia was verified, they received 175 mg/kg of Thiopental intraperitoneally.
Histological Analysis
The brains were initially cut close to the electrodes’ path based on the Paxinos and Watson atlas (Gc, 1986) and placed in 15% formaldehyde. They were taken to the Histocenter® pathology laboratory and included in paraffin; 2 micrometers slices were stained with Hematoxylin and Eosin (HE).
Analysis of Histological Slides
HE stained slides were analyzed in the Laboratory of Neuroanatomy and Neurophysiology, linked to the Department of Physical Therapy (DEFISIO), at the Universidade Estadual do Centro Oeste - UNICENTRO. The MIPro Standard v1.1 software was used capturing up to 10 images per each slide under the 4X and 40X microscope objectives.
Statistical Analysis
The data was initially tabulated in Microsoft Excel spreadsheets and subsequently entered in the Graph Pad Prism 5.1 program to analyze means and standard deviations. The Shapiro Wilk normality test was used; the statistical Kruskal-Wallis and Duns tests were used considering values of p < 0.05.
RESULTS
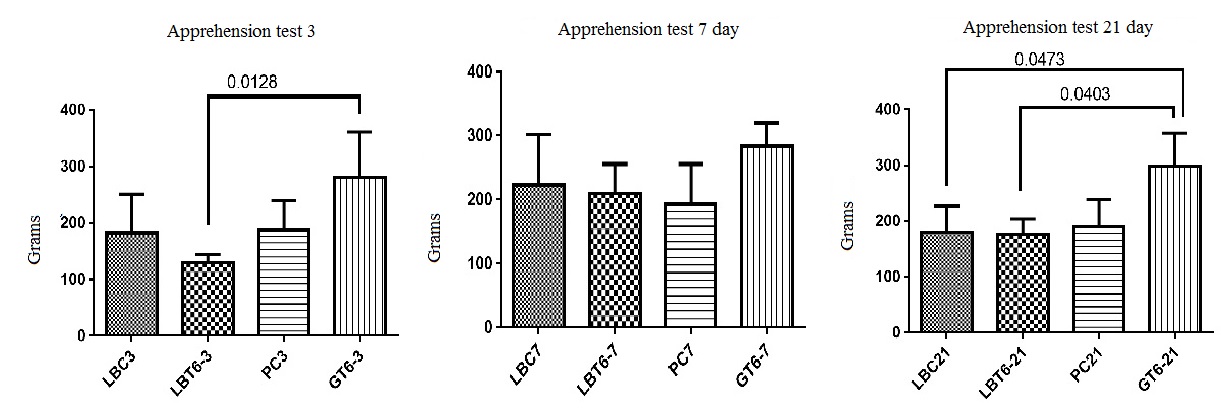
Apprehension test
Figure 1 shows the means and standard deviations of the results in the apprehension test in the 3-, 7-, and 21-days treatment groups. A statistically significant increase was observed in apprehension force on the third day in GT6-3 when compared to LBT6-3. Figure 1 shows the means and standard deviations in groups days 3, 7, and 21 in the apprehension test. On the third day, an increase in the apprehension strength was observed in GT6-3 when compared to LBT6-3 with a statistically significant difference. On the seventh day after the lesion, it was observed that GT6-7 maintained the mean of apprehension strength, and on the twenty-first day, the mean apprehension strength was 299.3 grams in GT6-3. On the twenty-first day, the mean apprehension force was 299.3 grams in GT6-3.
Analysis of the Open field Test
Figure 2 presents the means and standard deviation according to the number of events in the variable ‘elevation behavior’ in animals in the 3-, 7-, and 21-days treatment groups. The mean values at day 3 were 18.8 ± 10.03 in LBC3; 21.2 ± 8.92 in LBT3; 11.4 ± 7.98 in PC3; and 15.4 ± 10.38 in GT6-3. A reduction of 72% in the numbers of elevations was observed between LBT6-3 and GT6-3. On day 7, the mean values in LBC7, LBT6-7, PC7, and GT6-7 were 19.6, 25.4, 9.8, and 11.2, respectively. A statistically significant difference of 44% was observed between LBT6-7 and GT6-7. On day 21, the mean values were 17.6, 18, 18.6, and 21.6, respectively in LBC21, LBT21, PC21, and GT6-21. The number of elevations was increased by 20% between LBT21 and GT6-21, and in 14% between PC21 and GT6-21. Thus, when comparing GT6-3 and GT6-21, the number of elevations increased by 40%. However, this difference was not statistically significant.
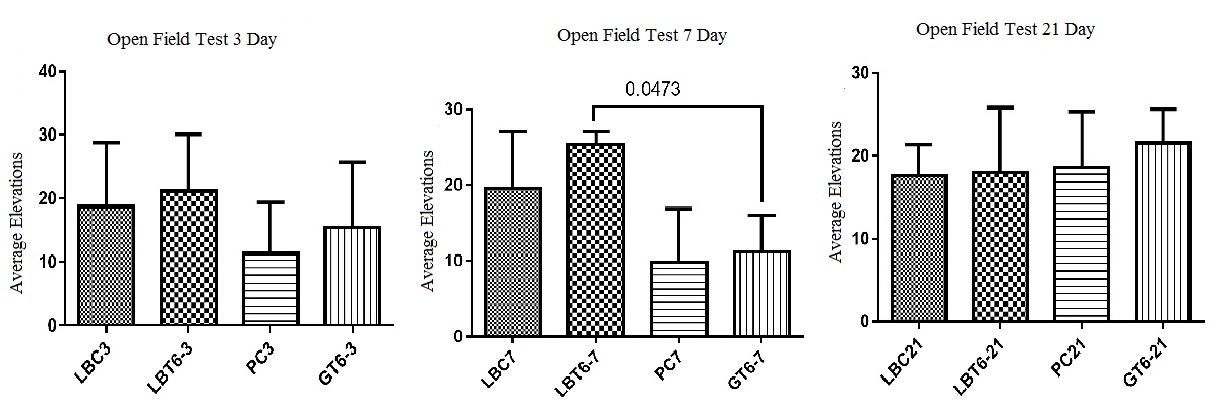
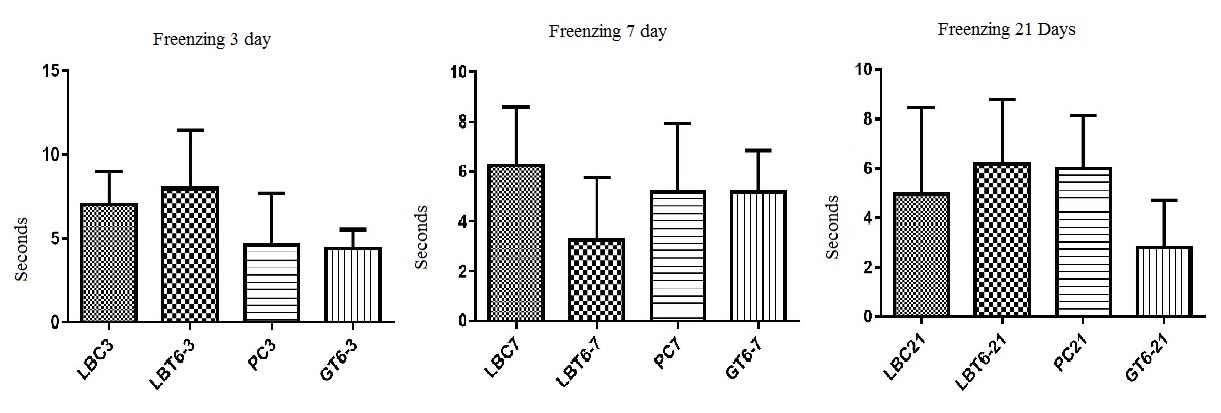
Figure 3 shows the mean and standard deviations of the freezing behavior variable in the open field test in animals in the 3-, 7-, and 21-days treatment groups. The average time of ‘freezing’ on the third day was 4.6 seconds and 4.4 seconds in the PC3 and GT6-3, respectively, when compared with LBT6-3 when the values were 3.4 e 3.6 seconds. These values were higher after the lesion when compared to the baseline values. On day 7, increased values were observed in all the groups concerning baseline values. On day 21, GT6-21 showed a mean of 2.8 ± 1.94 seconds, and LBT6-21 showed a mean of 6.2 ± 2.58 seconds, which represents a difference of 45.16%.
Histological Evaluation
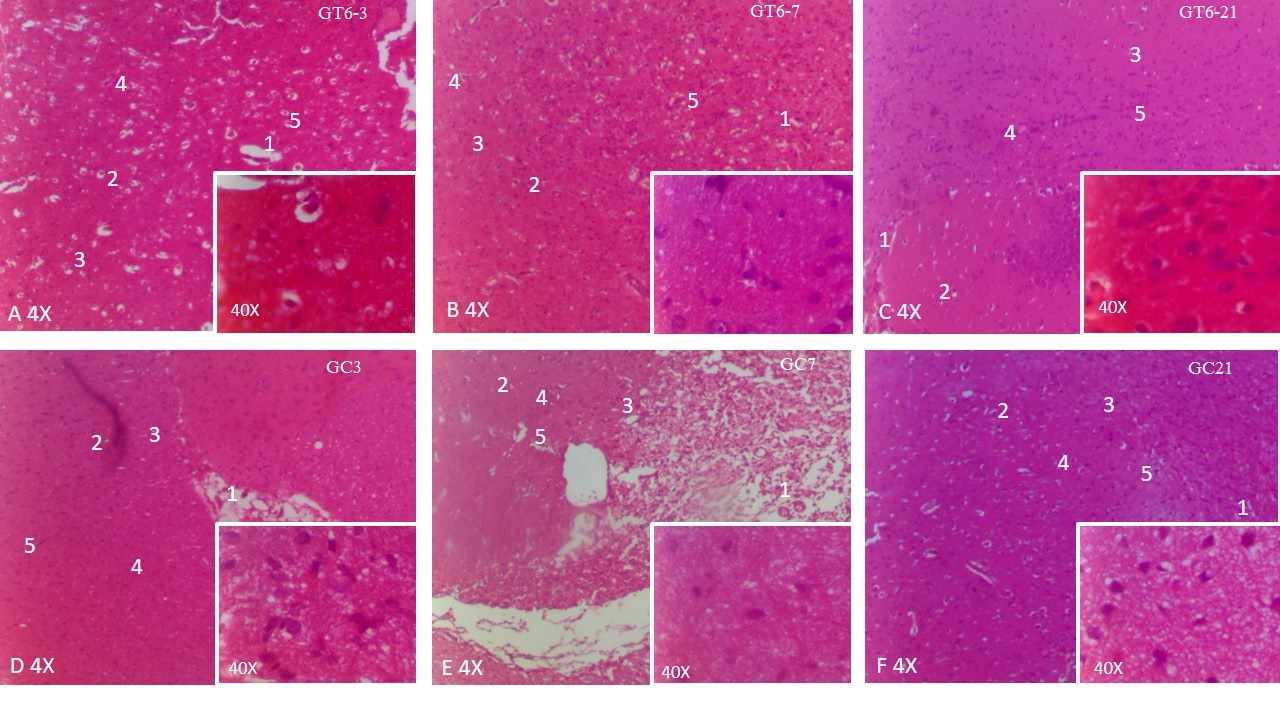
Figure 4 shows the histological analysis of HE-stained nervous tissue slides in 4X and 40X magnification to describe the cellular aspects in the 3-, 7-, and 21-days treatment groups and control groups.
Images 4A and 4D represent GT6-3 and GC3, respectively, and shows few foci of edema (represented by 1) in GT6-3 compared to GC3. There is a significant presence of fibrous astrocytes in GT6-3 (represented by 2) while these are lightly present in GC3. Oligodendrocytes (represented by 3) are more present in GT3 compared to GC3. When inflammation of the nervous tissue occurs, the microglia cells are rounded and have phagocytic capacity, receiving the nomenclature of granule-adipose cells (represented by 4). These cells indicate necrosis/inflammation and are present in greater quantity in GT3 compared to GC3. The cerebral parenchyma showed higher density in GT3 compared to GC3.
Images 4B and 4E represent GT6-7 and GC7, respectively; GC7 shows a severe presence of edema while GT-6-7 shows a mild presence of edema. Astrocytes are reduced in GC7 compared to GT6-7. Oligodendrocytes are moderately noticed in GT6-7 and mildly in GC7. A larger manifestation of granule-adipose cells is observed in GT6-7 compared to GC7. The parenchyma of GT6-7 presents higher density compared to GC7. The signs of neurogenesis were more evident in GT6-7.
Images 4C and 4F represent GT6-21 and GC21, respectively, and shows reduced edema in both compared to samples from the day-3 and day-7 treatments. However, the reduction in GT6-21 was more evident compared to GC21. A greater presence of astrocytes was observed in GT6-21 compared to GC21. Oligodendrocytes are moderately more present in GT6-21 compared to GC21. Granule-adipose cells are mildly present in GT6-21 and moderately present in GC21. There is a marked increase in neuronal proliferation in GT6-21 compared to GC21. The cerebral parenchyma shows notably higher density in GT6-21 compared to GC21. Thus, the signs of neurogenesis are more evident in GT6-21 compared to CG.
DISCUSSION
The present study used photobiomodulation for 104 seconds as a treatment in different experimental time points. The results found in the evaluation of motor behavior (Apprehension Test) demonstrate increased resistance in the animals in the 3-, 7-, and 21-days treatment groups compared to their control groups. These results were significantly different from the positive control in the 3 and 21 days timepoints. These findings corroborate the results reported by Meyer (Meyer, Chen, & Zivin, 2016), who investigated the effect of transcranial phototherapy with 808 nm Laser on the clinical improvement of ischemic stroke. This study demonstrated a significant improvement in the behavior of animals, evaluated through the Dichotomized Behavioral Score, indicating a reduction of neurological damage with the use of phototherapy. However, the optimal time and optimal radiation dose were not defined by those authors.
Similar results were found in a study conducted by Detaboada (DeTaboada et al., 2006) when analyzing the effects of photobiomodulation on the neurological deficits in stroke-induced rats; function was evaluated by a neurological test and indicated an increase in neurological function in the 21-day period of treatment. In the present study, the behavioral tests with Open Field presented differences between animals in the treated and control groups, demonstrating improved behaviors of elevations, decreased times of freezing, and increased numbers of elevations. The histological analysis did not show significant tissue remodeling in GT6-3 compared to GC3, which is discordant to the findings reported by Lee (Hi et al., 2017), who shows a significant reduction in the size of infarction in the treated group compared to the control, in addition to demonstrating the prevention of lesion spread by inhibiting inflammatory mechanisms.
GT6-7 presents a significant edema reduction in the animals in the treated group compared to those in the control group, in addition to increased cell proliferation. These results are in agreement with those reported by Yang (Yang et al., 2018), who investigated the effects of the photobiomodulation treatment at 808 nm on induced-stroke mice, including neurogenesis and edema reduction. Moreover, that study’s results showed that the mitochondrial dynamic restoration treatment showed edema reduction and neurogenesis in a greater proportion in treated animals compared to those in the control group.
Oron (Oron et al., 2006) investigated the effects of photobiomodulation on stroke-induced rats initiated 24 hours after injury, similarly to the present study, and found a higher number of cells per area in animals in the treated group compared to the control group in a 21-day treatment period. That author concluded that photobiomodulation is a therapeutic potential for stroke, confirming the findings of the present study in the 21 days treatment period.
Finally, animals in the GT6-21 group presented a significant cell proliferation and decreased edema compared to those in the GC-21 corroborating the results reported in another study by Lee (Hi et al., 2017), which demonstrated neuroprotective effects leading to proliferation of neurons and astrocytes, facilitating neovascularization, and concluding that the LED treatment is a promising tool for treatment after stroke.
CONCLUSIONS
Considering the histological and quantitative results in this study, it is concluded that the 630 nm LED treatment applied after stroke is superior to no intervention. The quantitative findings in the animals in the 3, 7, and 21-days treatment groups indicate improvement in motor behavior (strength). Furthermore, the histological results demonstrate superior cell proliferation in the treated groups compared to the control groups.
CONFLICT OF INTERESTS
The authors declare no conflict of interest.
ETHICAL CONSIDERATIONS
All experiments were carried out according to the Ethics Committee on Animal Use - CEUA from the Midwest State University – UNICENTRO and according to protocol 034/2017.
