
ADMINISTRATIVE FUNCTION OF LOCAL GOVERNANCE IN GODAWARI MUNICIPALITY, LALITPUR, NEPAL
Abstract
This study explains administrative functions of local governance in Godavari municipality of Lalitpur district. For that purpose, the quantitative research approach and instrumental case study in multi-site research design has been applied. The required data were collected from 234 respondents (Administrative staffs 12 elected representatives and local intellectuals 30 and service receivers 192) through institutional survey and exit poll survey techniques selected by purposive, cluster and stratified random sampling methods. This study found that average value of administrative functions related variables was 1.88 to 2.14 or perceptions of the respondents over studied variables felled between "strongly agree and agree". And the average value of quality of administrative functions related variables also found 1.96 to 2.76 (strongly agree and nearer to neutral" with 0.60 to 1.44 standard deviation and 0.15 standard errors for the skewness. However, Pearson correlation coefficient between administrative function index (maximum 35, minimum 7, mean 24.08 and standard deviation 3.41) and quality of administrative function index (maximum 28, minimum 4, mean 14.26 and standard deviation 2.57), r= 0.88, > r2= 0.05 and p=0.00 found significant (strong positive correlation).
Keywords
Governence, Local Governance, Local Government, Administrative Functions, Quality of Administrative Functions
INTRODUCTION
The acceptable meaning of governance is decentralization of state power for inter-sectoral management of administrative functions. Governence is thus regarded as complex set of institutions, actors and stakeholders; governance recognizes the blurring of boundaries and responsibilities for tackling social and economic issues; governance identifies the power dependence involved relationships between institutions’ collective action; governance is about autonomous self-governing networks of actors and governance also recognizes the capacity to get things done by using its authority (Stoker, 1998).
Governance can be used in several contexts such as corporate governance, international governance, national governance and local governance. Under local governance system, citizens are treated as agents by empowering their ability to receive quality services under administrative functions. Administrative function is a set of institutional arrangements adopted by the government to provide public goods and services to the citizens. Administrative functions of local government have been adopted after the failure of centralized government practices. Therefore, it is the specific institutional arrangements that critically influence the performance of quality administrative functions. Otherwise, the poor capacities of local government in many countries, the administrative services delivery functions to the local people are significantly hampered (Hamil & Ali-A, 2007).
For the long-term sustainability of the administrative services delivery functions, UNDP developed four basic models of public service delivery such as direct service delivery, indirect service delivery, and alternative service delivery and decentralized service delivery (, 1999). In direct service delivery model, the central government hires staff, produces and distributes services, invests either directly operating from the headquarters or through de-concentrated line agencies. In indirect service delivery model, the central government transfers the delivery of public services to the private companies for mobilizing private sector investment in the public service sector. In alternative service delivery model, the central government retains the power to provide public services whereas the private parties make the actual delivery. It establishes cooperation between government and private sector (Public-private Partnership) with different contractual arrangements. And finally in decentralized service delivery model, the central government provides power jurisdictions to the local government for providing service delivery to the local people for ensuring citizens' greater accountability for service quality.
However, quality of any service delivery model depends on appropriate constitutional and legal frameworks, sufficient and competent human resources, adequate financial resources, accountability and transparency governance system (Ekpo, 2008) as well as principles of responsive, responsible and accountable governance functions (Shah & Shah, 2006). The responsive governance principle aims for governments to do the right things—that is, to deliver services consistent with citizen preferences. The responsible governance aims to do it right—that is, manage its fiscal resources prudently. It should earn the trust of residents by working better and costing less and by managing fiscal and social risks for the community. It should strive to improve the quality and quantity of and access to public services. The accountable governance aims to become accountable to its electorate. It should adhere to appropriate safeguards to ensure that it serves the public interest with integrity. Legal and institutional reforms may be needed to enable local governments to deal with accountability between elections—reforms such as a citizen’s charter and a provision for recall of public officials.
In practice, the problems of governance and government is said to involve four distinct issues such as poor public service management, lack of accountability, the absence of legal framework for development and problem of information availability or transparency (Dahal & Heinz, 1996). Even in Nepalese context, during tenure of Kirant and Lichchhavi, Panchali served as the lowest local body and Thum served as Ilaka level local body. The Malla rulers practiced three types of local units-Bhukti, Bishaya and Gramkeshtra. There was provision of Panchali and Panchaa samuchchaa as for local development and justice. In 1960, King Mahendra provisioned "National Guidance" system based on local panchayats led directly by the king till 1990. King Mahendra introduced 14 zones and 75 districts as administrative units of the country. After the promulgation of new constitution 1990, the local bodies namely- District Development Committee (DDCs), Village Development Committees (VDCs) and Municipality were established and operated under Local Self Governance Act, 1999 and its Regulation, 2000 (, 1999). Again, new constitution of Nepal (2015) has provisioned three tired governance mechanism (Federation, Province and Local Level) operating by 90000 civil servants (, 2015). In the case of local governance, the administrative function provisioned in devolved power/jurisdiction number 5 (LGOA, 2017) has been operating by 17000 administrative staffs (, 2017). This fact indicates that there is an issue of quality administrative functions that is not only hampering quality service delivery practices of local government but also resulting poor rural development practices in Nepal. It is because rural development process seeks to alleviate poverty, mass utilization of resources, commercialization of agriculture, food security, creating opportunities, infrastructural development of rural community and modernization of the society (Chaudhary & Pasa, 2015). Hence, in this background this study has analyzed administrative functions of local governance in Godavari municipality of Lalitpur district.
LITERATURE REVIEW
LOCAL GOVERNANCE IN NEPAL
In Hindu religion there is an assumption of good governance. The king of Ayodhya, India, who is also known as an Ideal god of Hindu's religion, Ramchandra provide an example of Good Governance. His regime called as RAMRAJYA. During tenure of Kirant, there were Thum, and Panchali as form of local government. Panchali served as the lowest local body and Thum served as Ilaka level local body. Elected person by locals called Paantimyanga was regarded as chairperson of the local bodies. Likewise, during Litchhabi tenure, there were Gram, Tal and Dranka local bodies. We can relate to Gram as village level, Tal as communal unit of villages and Drank was as for high populated area’ governing unit. Similarly, in Malla ruling tenure, there were three categorized local units – Bhukti, Bishaya and Gramkeshtra. There was provision of Panchali and Panchaa Samuchchaa as for local development and justice. The members for these bodies were appointed from Centre. Likewise, the king of Gorkha Ram shah (1663-1690 BS) was also popular from the point of view of rule of law. The quote of “Nyaaya Napaye Gorkha Jaanu” is very famous till now. Similarly, king Pratap Malla used to have meal after all citizen had had their meal.
The period of 1950-1960, the first democratic era remained transitional phase in the history of democratic practice in Nepal. In 1960, King Mahendra overthrew the first democratically elected government, and, in 1961, he set up a "National Guidance" system based on local panchayats led directly by the king. Under his regime, the Panchayats were a party-less system created to provide a semblance of decentralization. Government remained incapable to create a favorable environment in the field of people's participation in governance and also in the local development. The Nepalese political environment of the time reflected the lack of political commitment and unnecessary conflict between the political parties and the monarchy. During this period, the King introduced 14 zones and 75 districts as administrative units of the country. During the Panchayat polity the government led by Krishna Prasad Bhattarai declared VDC, Municipality and DDC Act 1971. The Panchyat political system ran till 1990. People Movement 1990 re-established multiparty democracy with constitutional monarchy in Nepal.
After the promulgation of new constitution 1990, the local bodies namely- District Development Committee (DDCs), Village Development Committees (VDCs) and Municipality were established under separate DDC, VDC and municipality Act adopted in 1991. Local Self Governance Act, 1999 and its Regulation, 2000 provided comprehensive and integrated legislative platform for the local government for marching more autonomous local bodies with capacity to mobilize financial resources and human resource management in their own way. Despite these initiatives and practice, the local governments were undermined by the armed conflict (1996-2006) between the Government and Maoist insurgents in 2000s (, 2014).
In November 2005, the leaders of the seven political parties in the dissolved parliament signed a 12-point agreement with the Maoists and jointly led the mass protest that forced the king to step down and reinstate parliament. The reinstated House of Representatives adopted a declaration stripping the King of all powers granted to him by the Constitution of Nepal 1990, and committed to elect a Constituent Assembly (CA) to write a new constitution (, 1990). The new government also began negotiations with the Maoists, which culminated in the signing of the Comprehensive Peace Accord in November 2006. After the peace process in 2006 a renewed focus was given, both from the Government of Nepal and the international development partners, to engage the development of local governance institutions.
At present, under new constitution of Nepal (2015) federal structure of local governance mechanism has got full flagged power/jurisdictions in local levels (, 2015). There is a provision of participation of eight different local stakeholders (i.e., legislative, executive, judiciary, private sector, media, community organization, political parties, and civil society) during planning and implementing local projects. It pursued and implemented decentralization principles like; devolution of power and responsibilities in local levels that required for making local levels capable, building and development of institutional mechanism, people's participation in local development activities. Constitution has clearly enlisted power/jurisdictions of three tired government (i.e., federation, provinces and local levels) at the same time there is also provision of concurrent power/jurisdictions between federation and provinces as well as among federation, provinces and local levels (Appendix B ).
The management of administrative public service function has been provisioned in devolved power/jurisdiction number 5 (LGOA, 2017). Owing to this provision, the government approved employee’s adjustment Act as per the major function outlined in the constitution to functionalize the federalization competently, government employees will be needed to functionalize the federalism from bottom to top level of the government. However approximately 90000 civil servants have been currently employed into different ministries, department’s district Rural/Municipalities and wards office and 17000 staffs were engaged in the local government Units. To manage the current practice of federalization and devolution a huge volume of budged to the local levels of the basis of size of administration area, size of population and a poverty indicator is required to accomplish the service. Central government is also working for improving institutional capability of local levels. Institutional development, management of human resources and their career development, use of information and communication system, promotion and regulation of information and communication system for the proper management of regulatory administrative functions are major areas for development of institutional capability. Additionally, formulation of laws and regulation including tax collection local legislation social security development planning administration work division regulation among other several affairs are needed to be formulated based on 22 devolved power/jurisdictions (, 2015) (Appendix A ).
REVIEW OF FOUNDATIONAL WORK
Nepal National Governance Survey (2017/18) developed major foundations of governance dimensions and parameters of governance (Dhungana, Pokharel, Sigdel, Dahal, & &upadhyaya, 2018). The voice and participation, integrity and accountability, justice and social inclusion and rule of law are regarded as foundation of governance. The elections, constitution and constitutional provisions, realization of constitutional freedoms, provincial and local government, political institutions, social association and civic awareness, information and communication as well as security and protection are regarded as infrastructure of governance. The experience of public service, support for receiving services, attempts made to receive services, source of information about services, service fee and additional expenses and public service environment are regarded as service delivery functions.
MoFAGA reports (2017) on governance argues that Local Governance and Community Development Program (LGCDP II) was successfully implemented to address the commitment of GoN towards ensuring quality and transparent services, strengthening downward accountability, and economic and social transformation of marginalized groups. The programme remained instrumental in strengthening linkage between local government and citizens through social mobilization process. This program was effective in promoting good governance practices, quick and efficient service delivery, enhanced transparency and accountability of local governments. The programme successfully bridged the gap between the government and citizens, especially at the local level in absence of elected local representatives (, 2017).
The World Bank report (2014) on "Local Service Delivery in Nepal'' highlights public benefits from outcomes of any particular service, not merely inputs of that service. The study found that Nepal had increased six-fold revenues in local bodies (LBs) over the past six years without corresponding changes in the institutional framework for local government. Disparities in geography and demography are not reflected in LBs’ institutional framework or operations. The intergovernmental finance framework does not stimulate local revenue effort. There is significant scope for strengthening the management systems at the local level. Relations of local bodies and citizen are not qualitatively different from other public institutions in spite of their greater proximity. And the report recommended government to address LB human resource constraints and adjust planning processes like simple need assessment and project management (, 2014).
Gayawali (2008) provided framework of seven principles aligned with “Democracy and Accountability” for the purpose of micro-managing service delivery activities (Hamil et al., 2007). First, consultation users and consumers of public services should be consulted about the level and quality of the services they receive and wherever possible, to be given a choice about services that are offered. There are many ways to consult users of services, including consumer surveys, interviews with individual users, consultation groups, and meetings with consumer reprehensive bodies and community groups. Second, service standards users and consumers of public service should be treated with courtesy and consideration. Service standards will be approved by the minister or relevant department, who is ultimately responsible for the services being provided. The service standards should be demanding but realistic. This means that they should reflect a level of service which is higher than that currently offered but which can be achieved with dedicated effort, and by adopting more efficient and customer-focused working practices. Service standards must then be published and displayed at the point of delivery and communicated as widely as possible to all potential users so that they know what level of service they are entitled to expect, and can complain if they do not receive it. Third, information must be provided which meet the varying needs of different users. This is essential to ensure that those who are disadvantaged by physical disability, language barriers, and geographical distance or in any other way are included. Where customers have little or no choice about the services they receive, information is one of the most powerful tools-sometimes the only tool-that they have to exercise their rights to good service openness and transparency are the hallmarks of democratic government and are fundamental to the public service transformation process. In terms of public service delivery, their importance lies in the need to build confidence. The users and consumers of public services should expect full, accurate information about the service they are entitled to receive.
Fourth, openness and transparency the public should expect to be told how the public sector departments and agencies are run, how much they cost, and who is in charge. Improving public service delivery can only be achieved within the resources available to the nation. The service delivery programme must go forward in the context of a transformation programme that is also aimed at reducing public expenditure and creating a leaner public service. Fifth, courtesy users and consumers of public services should be treated with courtesy and consideration. Under the principles of public service delivery, the concept of courtesy goes much wider than asking public servants to give a polite simple and saying 'Please' and 'thank you', though these are certainly required. The principles of public service delivery require that the behavior of all public servants' is raised to the level of the best. Service delivery and customer care must be included in public service training programmers and formal training given to all those who deal directly with the public. Sixth, responsiveness users and consumers of Public service should expect that when the promised standard of service is not delivered, they will be offered an apology, a full explanation and a speedy and effective remedy and that any complaint will produce a sympathetic, positive response. Responsiveness is a core value of the transformed public service. Its application in practice will have a profound effect on the way. The capacity and willingness to take action when things go wrong are the necessary counter parts of the standard setting process. The key to implementing the responsiveness principle lies in being able to identify quickly and accurately when services are falling below the promised standard and having procedures in place to remedy the situation. This needs to be done at the individual level in transactions customers, and at the organizational level, in relation to the entire service delivery programme. Seventh, value for money the public should expect that public services will be provided as economically and efficiently as possible. It is not only the public who would like to see public services improve. Many dedicated public servants, particularly those who serve the public directly, are frustrated by systems and procedures which are often a barrier to good service rather than a support for it. Performance appraisal will in future include an assessment of the performance of individual staff in contributing to improving service to the 101 public. This will be particularly important in the case of staffs who serve the public directly, where a key indicator will be how they rate in their dealings with the public. The effective public service delivery demands strong and citizen responsive government, capable and neutral administrative system, active civil society, organized and capable consumer group and above all effective follow-up of standards practices.
Adhikari and Pasa (2019) revealed that the chaos of bureaucratic hurdles to receive the development budgets from the Metropolitan office is demoralizing the community volunteers (consumer committee members) at local levels (Adhikari & Pasa, 2019). Local government should facilitate the fund releasing process to the consumer committees by easing the rules and regulations. There must be a shared governance system between the local government and beneficiaries so that both parties feel a shared responsibility to achieve any development goals. Likewise, the government should have the lead governance towards the banking institutions. Banks are the mediators between the government and the consumer to make the fund-releasing process becomes swifter and less complicated.
Kharel (2020) research on “Service Delivery Practices of Local Government in Nepal” found that people living around Mountain, Hill and Tarai regions of Mechi zone are expecting some larger expectations of improved service delivery in the changed perspectives of federal governances. After local elections, the local government units are working effectively and efficiently through the reformative administrative functions for offering good networking of regulatory administrative functions including agriculture service delivery practices. As a result, the management of information flow and creation of capacities to produce goods and services to people are becoming crucial to the success of federal government (Kharel, 2020).
OBJECTIVES
-
To access social demographic characteristics of the respondents (elected representatives, administrative staffs and service receivers).
-
To analyze administrative functions of local governance.
-
To understand quality of administrative functions of local governance.
-
To establish the relationships between respondents’ characteristics and administrative functions.
METHODOLOGY
RESEARCH DESIGN
Under quantitative research approach, this study applied instrumental case study in multi-site research design for explaining research issues through one or more participants within a bounded system, setting or context. Case as “a bounded system or Godavari Municipality” and inquire into it “as an object rather than a process”. It is a specific or a complex functioning thing like; boundary and working parts and purposive social interactions (Yazan, 2015). The purpose was to explain multiple bounded system (participants belonging to three different wards of the municipality) in different ground reality through analyzing governance process and linking causes and outcomes of phenomenon (Yazan, 2015). An advantage of the case study approach is that it can fit well with the needs of small-scale research through concentrating effort on one research site. Case study method helps a researcher to directly examine the data within a specific context (Denscombe, 1998). It is clear that different people do have different background so the diverse behavior, manners and actions based on specific context. The more the people the more the behaviors. Each and every individual do perceive the reality with their own prospective. Inherited and acquired characters both plays vital role for the development of an attitude of 234 individuals that help to explain administrative function of local governance in Godavari Municipality.
POPULATION AND SAMPLE SIZE
|
Wards No. |
Sample Respondents |
|||||||
|
|
Administrative Staff |
Members of Village Assembly and local intellectuals |
Service Receivers |
Total |
||||
|
Pop |
Sample |
Pop |
Sample |
Pop |
Sample |
Pop |
Sample |
|
|
2: Godawari |
8 |
4 |
30 |
10 |
150 |
69 |
188 |
83 |
|
5: Lele |
6 |
4 |
30 |
10 |
120 |
63 |
156 |
77 |
|
6: Devichour |
6 |
4 |
30 |
10 |
80 |
60 |
116 |
74 |
|
Total |
20 |
12 |
90 |
30 |
350 |
192 |
460 |
234 |
The study site, Godawari municipality is located in Lalitpur District in Bagmati Pradesh of Nepal. It was established on 2 December 2014 by merging the former Village development committees Godawari, Badikhel, Bisankhunarayan, Godamchaur and Thaiba of Lalitpur District of Bagmati Zone. The municipality has total area 96.11 square kilometer. The municipality has total 18262 households and 116045 populations (female 58302 and male 57743) (Municipality Profile, 2075). For the management of public administrative functions, the municipality is divided into 14 administrative wards. As it is not always possible to reach to the population of the study, samples are proportionate subset of the population. Sample is a small representative proportion of population that will select for observation and analysis of data information (Best & Kahn, 2004). Under quantitative approach, this study identified 460 sample populations. Out of that only 234 sample numbers or respondents (51%) were selected by applying purposive, cluster and stratified random sampling methods. The study populations are elected representatives, administrative staffs, and service receivers (Table 1 ).
RELIABILITY AND VALIDITY
|
|
Intraclass Correlationb |
95% Confidence Interval |
F Test with True Value 0 |
||||
|
Lower Bound |
Upper Bound |
Value |
df1 |
df2 |
Sig |
||
|
Single Measures |
.004a |
-.001 |
.011 |
1.184 |
192 |
7680 |
.043 |
|
Average Measures |
.155c |
-.024 |
.317 |
1.184 |
192 |
7680 |
.043 |
For achieving consistency in measurement of the study variables, this study has developed reliable tool (survey questionnaires) and representative sampling procedures. The reliable tool was developed by applied internal consistency measure among the studied variables or cronbach alpha measurement. Further, out of total 234 cases, valid cases are 201 (85.9%) and excluded cases are 33 (14.1%). The numbers of items are 33 and cronbach's alpha based on standardized items is 0.79 with mean 234.43, variance 6022.56 and standard deviation 77.60 (Taber, 2017) and Table 2. Similarly, validity refers to apply valid process during whole research process. Validity can be improved through content, construct and criterion validity that are employed in this study (Cohen, Manion, & Morrison, 2007). The content validity helped researchers to attempt careful sampling and statistical analysis. The construct validity helped researchers to triangulate literatures, field data information and statistical tools and the criterion validity helped researchers to use reliable tools during data collection.
METHODS OF DATA ANALYSIS
For the purpose of data analysis and interpretation, this study adopted descriptive and inferential statistical methods. The SPSS version 20 was used to manage data organize which are presented according to the objectives of the study. For the purpose of descriptive analysis, the statistical tools such as frequency table, cross tabulation and central tendency have been applied in tabular form. Likewise, for the purpose of interferential analysis statistical tools like; likert scale, composite index, correlation, ANOVA, chi square and binominal distribution are applied (Chakrabartty, 2014) (Field, 2009) (Gupta & Gupta, 2015) (Pasa, 2020). Similarly, this study also applied description, analysis, and interpretation methods of data analysis (Yazan, 2015) (Pasa, 2020). Description method helped to understand the meaning of the data. Analysis method helped to identify underlying meanings of data to make a systematic description. Interpretation method helped to understand processes and meanings in the theoretical context.
RESULT AND DISCUSSIONS
CHARACTERISTICS OF THE RESPONDENTS
The information about types of respondents shows that 5.12 percent are administrative staff, 12.82 percent, elected representatives and local intellectuals, and 82.05 percent Service receivers. Respondents ward wise information shows that 35.50 percent respondents are from ward number 2, from ward number 5, 32.9 percent respondents and 31.6 percent respondents from ward number 6. Information about respondents age group shows that 16.70 percent respondents are belonging to age group <24 years, 14.10 percent respondents are belonging to age group 25-30, and 14.10 percent respondents was belonging to age group 31-35 and 50.80 percent respondents was belonging to age group >36 year. Out of total 234, majorities (69.23%) are male and remaining 30.76 percent are female. The cross-tab information shows that there are 12 administrative staffs (4 female and 8 male), 30 elected representatives and local intellectual (11 female and 19 male) as well as 192 service receivers (57 female and 135 male). The numbers of female are comparatively less than male in all types of respondents’ category. This does not mean that women belonging to the study area are not only involving in household chores but also involving in administrative, financial and institutional activities. Rimal and Pasa (2018) also found that employment status of Nepalese women particularly in Vyas Municipality located in Tanahun District of Gandaki province found satisfactory. Out of total 72 respondents, 44 (61.11 %) were working in government institution and remaining 28 (38.89%) were working in non-government institutions. The respondents’ attitude towards women employability is gradually becoming positive due to the intrinsic and extrinsic motivational factors that are positively contributing to the women employment (Rimal & Pasa, 2018).
Likewise, the highest 66.20 percent respondents are Hindu whereas lowest 5.60 percent are Christian and 28.20 percent are Buddhist. Similarly, the highest 44.40 percent Janjati, caste group lowest 8.50 percent Dalit, 22.60 percent Chhetri and 24.40 percent respondents are Brahimin. The social and economic status of the Dalits found comparatively poor that those of so-called upper caste groups in this Municipality. Pasa and Bishwokarma (2020) also argued that Dalit are still far behind to be cooperated with so-called non-Dalit into the frame of caste-based social structure. Thus, suggested to implement 5Es approach (envisioning-educating-empowering-ensuring-encouraging) for promoting Dalit in national mainstreaming (Pasa & Bishwakarma, 2020).
Information about family type shows that among total respondents there are highest 59.80 percent nuclear family and 40.20 percent joints family. Information about occupational status shows that highest 80.80 percent respondents are involved in agriculture and lowest 2.10 percent are involved in private job and similarly 2.10 percent respondents are wage labour. In the case of socio-economic status of the respondents, the highest 88.00 percent have medium, 10.30 percent have low the lowest 0.40 percent have high and 1.30 percent have poor socio-economic status. The educational information about respondents, the 82.50 percent respondents are literate and 17.50 percent respondents are literate. Out of total 193 educated respondents, most of them (31.60%) have completed higher education level that is followed by primary level (26.42%) and secondary level (23.83%) as well. The highest 31.60 percent respondents passed secondary level of education, lowest 6.00 percent respondents have passed Higher education, 31.20 percent respondents passed lower secondary education and 13.7 percent respondents passed secondary level education. The information also shows that the trend of involving educated local politicians in governance system is increasing.
The highest frequency for the study variables types, age, gender, religion, caste, family structure, family occupation, social status, economic status, educational status and level of education of the respondents found 3.00 (service receiver), 4.00 (.36 years), 2.00 (male), 1.00 (Hindu), 3.00 (Janjati), 1.00 (nuclear family), 1.00 (agriculture), 2.00 (medium), 2.00 (medium), 1.00 (literate) and 1.00 (primary) respectively. Similarly, the mean value for types, age, gender, religion, caste, family structure, family occupation, social status, economic status, educational status and level of education of the respondents found 2.85; 3.06; 1.73; 1.90; 2.44; 1.40; 1.67; 2.12; 2.12; 1.17; and 2.40 respectively. The standard deviation for all the variables (0.37 to 1.54) with standard errors for the skewness (0.159 to 0.175) indicates that the data are normally distributed
ADMINISTRATIVE FUNCTIONS
The average value of seven different variables related to administrative functions; administrative function is becoming accessible, service receivers are getting administrative services in the village, administrative functions become informative, elected representatives are becoming accessible, administrative staffs are becoming accessible, flow of administrative service receivers have been increased and working efficiency of staffs have been increased found 2.00, 2.14, 2.08, 1.97, 2.02, 1.88 and 1.97 respectively. This indicates that perception of the respondents over these statements lies between "strongly agree and agree". The standard deviation for all the variables (0.60 to 0.80) with standard errors for the skewness (0.15 for each) indicates that the data are normally distributed.
Likewise, the average value of four different variables related to quality of administrative functions. The mean values for the variables; time for administrative services have been reduced, cost for administrative services have been reduced, physical resources available in administrative office seems sufficient and human resources available in administrative office seems sufficient found 1.96, 2.76, 2.26 and 2.17 respectively. This indicates that perception of the respondents over these statements also lies between "strongly agree and agree". The standard deviation for the respected variables (0.60 to 1.44) with standard errors for the skewness (0.15 for each) indicates that the data are normally distributed.
The composite index is also calculated for developing single construct administrative function by computing seven variables (Pasa, 2020). The variables are administrative staffs are becoming accessible in the offices, service receivers are getting administrative services in own village, public information system on administrative functions also becoming accessible, elected representatives are becoming accessible in the administrative offices, administrative service, delivery mechanism is becoming accessible, the flow of regulatory public administrative service receivers have been increased at present and cost for administrative services have been reduced at present. The index value (maximum 35, minimum 7, mean 24.08 and standard deviation 3.41) shows that the most of the respondents’ views falls over agree statement with data inconsistency.
Similarly, the composite index is also calculated for developing single construct quality of administrative function by computing four variables (Pasa, 2020). The variables are time for administrative services have been reduced at present, cost for administrative services has been reduced at present, and there is a greater physical resource available in administrative office for the quality services and major affecting factors for quality public administrative functions. The index value (maximum 28, minimum 4, mean 14.26 and standard deviation 2.57) shows that the most of the respondents’ views falls over agree statement with data inconsistency.
The Pearson correlation coefficient between administrative function index and quality of administrative function index, r= 0.88, level of significance, p=0.00 (Probability of happening of null hypothesis), and population, N= 234. While testing at the 0.01 significance level, it was found that r =0.88 > r2= 0.05 and p=0.00. This implies that the null hypothesis is rejected and the relationship between indexes is significant (strong positive correlation).
The partial correlation coefficient between variables; elected representatives seemed to be more accessible and administrative staffs seemed to be more accessible with control variables respondents’ types, r= 0.34, level of significance, p=0.000 (Probability of happening of null hypothesis), and population, N= 231. While testing at the 0.01 significance level, it was found that r =0.34 > r2= 0.05 and p=0.00. This implies that the null hypothesis is rejected and the relationship between indexes is significant (weak positive correlation).
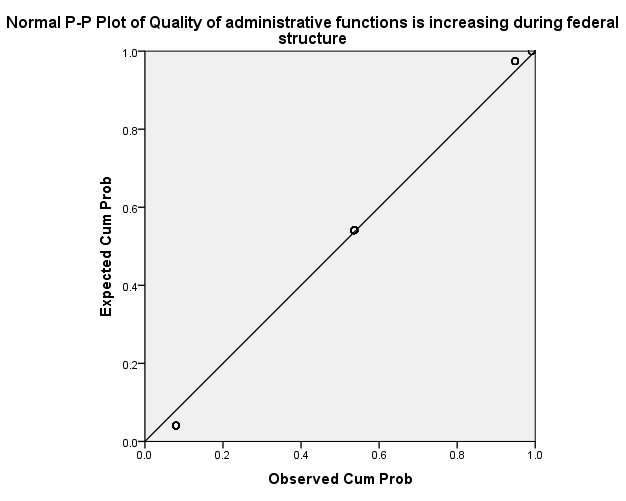
The table 15 illustrates partial correlation coefficient between variables; satisfaction level of service receivers’ is increasing and quality of administrative functions is increasing with control variables respondents’ types, r= 0.50, level of significance, p=0.000 (Probability of happening of null hypothesis), and population, N= 231. While testing at the 0.01 significance level, it was found that r =0.50 > r2= 0.05 and p=0.00. This implies that the null hypothesis is rejected and the relationship between indexes is significant (moderate positive correlation). This information is again checked whether the satisfaction level of the respondents and increasing quality of administrative are normally distributed or not? The estimated distribution parameters for satisfaction level (location value 1.94 and scale value 0.60) and quality administrative functions (location value 1.94 and scale value 0.54) indicates that the data are normally distributed (Figure 1 ).
INFERENCE STATISTICAL ANALYSIS
Characteristics of the Respondents: The dependent variables like; age group, caste group, family occupation and level of education of the respondents are statistically analyzed by applying ANOVA that shows the statistics used to test hypotheses about the population means.
Regarding the hypothesis, does the age group, caste group, family occupation and level of education of the respondents matters with different types of respondents? Hereof, the alternative hypothesis was set as there is significant difference between studied variables. Upon this analysis, regarding age group of the respondents, the test statistics F value found 0.24. Using α value of 0.05, the test statistic is larger than the critical value. Hence, null hypothesis is rejected at equal population means and conclude that there is a (statistically) significant difference among the population means. For the caste group of the respondents, the test statistics F value found 0.54. Using α value of 0.05, the test statistic is larger than the critical value. Hence, null hypothesis is rejected at equal population means and conclude that there is a (statistically) significant difference among the population means.
For the family occupation group of the respondents, the test statistics F value found 54.86. Using α value of 0.05, the test statistic is larger than the critical value. Hence, null hypothesis is rejected at equal population means and conclude that there is a (statistically) significant difference among the population means. Regarding the level of education of the respondents, the test statistics F value found 8.93. Using α value of 0.05, the test statistic is larger than the critical value. Hence, null hypothesis is rejected at equal population means and conclude that there is a (statistically) significant difference among the population means.
Administrative functions: Regarding the hypothesis, does the having public relationships with elected representatives of the respondents matters with their increasing satisfaction level of administrative service receiving? Hereof, the alternative hypothesis was set as there is significant difference between the studied variables. Upon this analysis based on table 18, this study got p value = 1.64.17 and 451.51, which is more than alpha value = 0.00. Hereof, the alternative hypothesis accepted and can interpret that there is a dependent relationship between these variables that means respondents having public relationships with elected representatives are seemed to be more satisfied while receiving administrative service delivery. Regarding the hypothesis, does the increasing satisfaction level of administrative service receivers matters with having public relationships with administrative staffs? Hereof, the alternative hypothesis was set as there is significant difference between the studied variables. Upon this analysis based on table 19, this study got p value = 42.73 and 451.51, which is more than alpha value = 0.00. Hereof, the alternative hypothesis accepted and can interpret that there is a dependent relationship between these variables that means respondents having public relationships with administrative staffs are seemed to be more satisfied while receiving administrative service delivery. Pasa (2018) also found that due to the accessible and quality service delivery mechanism of local government the livelihoods of local farmers or service receivers have been improving in Lele village of Godawari Municipality (Pasa, 2018).
Regarding the hypothesis, does the accessible administrative service matter with reducing time for administrative services? Hereof, the alternative hypothesis was set as there is significant difference between the studied variables. Upon this analysis based on table 20, this study got p value = 329.29 and 313.38, which is more than alpha value = 0.00. Hereof, the alternative hypothesis accepted and can interpret that there is a dependent relationship between these variables that means time taking for administrative service have been reduced due to accessible administrative staffs. Regarding the hypothesis, does the having comfortable office building infrastructure matters with spatial location of different wards? Hereof, the alternative hypothesis was set as there is significant difference between the studied variables. Upon this analysis based on table 21, this study got p value = 396.208 and 0.53, which is more than alpha value = 0.00. Hereof, the alternative hypothesis accepted and can interpret that there is a dependent relationship between these variables that means comfortable waiting area and office building infrastructure are available in core ward and vice versa.
Regarding the hypothesis, does the increasing satisfaction level of administrative service receivers matters with spatial location of the wards? Hereof, the alternative hypothesis was set as there is significant difference between the studied variables. Upon this analysis based on table 22, this study got p value = 451.51 and 0.53, which is more than alpha value=0.00. Hereof, the alternative hypothesis accepted and can interpret that there is a dependent relationship between these variables that means satisfaction level of administrative service receivers have been increased in core ward only.
Regarding the hypothesis, does the increasing quality administrative functions matters with spatial location of the ward? Hereof, the alternative hypothesis was set as there is significant difference between the studied variables. Upon this analysis based on table 23, this study got p value = 329.29 and 0.53, which is more than alpha value=0.00. Hereof, the alternative hypothesis accepted and can interpret that there is a dependent relationship between these variables that means quality of administrative service have been increased in core ward only.
Regarding the hypothesis, does the proportion of the respondents’ matters with the respondents’ responses falls under yes and no category for the studied variables? Hereof, the alternative hypothesis was set as there is significant difference between the studied variables. Upon this analysis based on the statement ‘do you have good public relationships with elected representatives”, the test statistics observed proportion test for “Yes” and “No” categories found 0.92 and 0.08 respectively. Using α value of 0.05 and 0.00 “Exact Significance-2 tailed test” the test statistic is larger than the critical value. Hence, null hypothesis is rejected and concludes that there is a (statistically) significant difference among proportion of the respondents’ response falls under on “Yes” or “No” for this variable. For the statement “do you have good public relationship with administrative staffs”, the test statistics observed proportion test for “Yes” and “No” categories found 0.71 and 0.29 respectively. Using α value of 0.05 and 0.00 “Exact Significance-2 tailed test” the test statistic is larger than the critical value. Hence, null hypothesis is rejected and concludes that there is a (statistically) significant difference among proportion of the respondents’ response falls under on “Yes” or “No” for this variable.
Similarly, for the statement citizen charter is visible to the service receivers, the test statistics observed proportion test for “Yes” and “No” categories found 0.59 and 0.41 respectively. Using α value of 0.05 and 0.00 “Exact Significance-2 tailed test” the test statistic is larger than the critical value. Hence, null hypothesis is rejected and concludes that there is a (statistically) significant difference among proportion of the respondents’ response falls under on “Yes” or “No” for this variable. For the statement “service receivers are getting information form citizen charter”, the test statistics observed proportion test for “Yes” and “No” categories found 0.55 and 0.45 respectively. Using α value of 0.05 and 0.17 “Exact Significance-2 tailed test” the test statistic is larger than the critical value. Hence, null hypothesis is rejected and concludes that there is a (statistically) significant difference among proportion of the respondents’ response falls under on “Yes” or “No” for this variable.
CONCLUSION
This study concludes that the federal structure of local governance has opened the door for decentralized model of administrative service delivery functions. In this model the service receivers are successfully establishing public relationships with elected representatives and administrative staffs that is must for quality administrative functions. Because of that administrative functions are becoming accessible and efficient to the service receivers. The administrative staffs seem capable for offering efficient administrative service delivery but they are not sufficient. The local elected representatives are also becoming accessible, accountable and responsible. In fact, elected representatives, local intellectuals and administrative staffs are collectively implementing administrative functions according to the spirit of the expectation of the local people. However, physical facilities or building infrastructures of ward offices are still need to upgrade. Even the building of ward office and municipal office was not sufficient and not friendly for people with disabilities. The sufficient administrative staffs also need appointed as they are fulfilling their administrative functional role with limited physical and human resources. Hence, this study suggested establishing better center local relationship between and among federation, provincial and local governments for the effective implementations of 22 devolved power/jurisdictions of the local government.
CONFLICT OF INTEREST
The authors have declared that no competing interests exist.
ACKNOWLEDGMENT
The authors wish to acknowledge local elected representatives, administrative staffs and service receivers (right holders) for their moral and constructive support during the study.
