MICRIBIOLOGICAL ASSESSMENT OF DRINKING WATER AND PERVASIVENESS OF WATER BORN DISEASES IN DUNGARPUR, RAJASTHAN
Yogita Ninama 1![]()
1 Assistant
Professor, Zoology, S.B.P. Government College, Dungarpur, Rajasthan, India
|
|
|
ABSTRACT |
|
|
Introduction: This study examined E. coli numbers in drinking water from different water bodies and illustrates the high prevalence of gastrointestinal diseases in Dungarpur districts of southern Rajasthan, India. Methodology: The microbiological parameters studied were pathogen detection, total coliform count, and total viable count. Microbiological examination of sampling water was described as in APHA (2005) Standard Methods for the Examination of Water and Wastewater Chhabra (2008). Total coliform count performed by the Most Probable Number (MPN) method, which is commonly used as an indicator of potability of water. Presence of the Enterobacteriacae was confirmed by urease analysis. Waterborne disease patients (Indoor and Outdoor patients) figures were collected. Result And Discussion: Seasonal fluctuation in coliform counts was found to be prominent and varied from over 200 MPN/ 100 ml in winter to more than 1600 (over the measurable limit) in rainy season in three water bodies. E. coli numbers growth from 17 to 500 MPN/100 ml in the selection site Total coliform, fecal coliform and E. coli were highest in rainy season. Results of IMViC test indicates that in rainy season except for Margia Dam all the water bodies were laden with all five categories of enteric bacteria namely E. coli, Shigella, Citrobacter and Klebsiella/ Enterobacter. Increase in pathogens numbers were excessive during the rainy season compared to summer season, because of WBD patients does exhibit a trend that in late summer and rainy month’s incidence of the disease symptoms intensifies. Conclusion: Dungarpur district was analyzed and same pattern of seasonal
variation in microbial counts of water samples and similar hospital data
trend was observed. So, somehow the microbial contamination of surface water
and run-off reaches the ground-water table. Therefore, hospital data confirms
that the source of drinking water plays a strong, positive and significant
association with waterborne diseases. |
|||
|
Received 29 May 2023 Accepted 29 June 2023 Published 14 July 2023 Corresponding Author Yogita Ninama, yogita.ninama@yahoo.com DOI 10.29121/granthaalayah.v11.i6.2023.5186 Funding: This research received no specific grant from any funding agency in
the public, commercial, or not-for-profit sectors. Copyright: © 2023 The Author(s). This work is licensed under a Creative Commons
Attribution 4.0 International License. With the license CC-BY, authors retain the
copyright, allowing anyone to download, reuse, re-print, modify, distribute,
and/or copy their contribution. The work must be properly attributed to its
author.
|
|||
|
Keywords: Drinking
Water, Microbial Load, MPN (Most Probable Number), Escherichia Coli,
Klebsiella Pneumoniae, Imvic (Indole, Methyl-Red, Vogus-Proskauer, And
Citrate Utilization), Citrobacter Freundii, Shigella |
|||
1. INTRODUCTION
The
availability of freshwater especially for purpose of drinking will be a one of
the most serious resource and environmental issue for long time to come. Poor water
quality spreads disease, causes death and affects socio-economic progress. We need water every day for
drinking, agriculture and in other activities. Pathogenic microorganisms contaminate the water and are now a major
global problem. The main causes of bacteria in the aquatic environment are the
disposal of human waste and municipal wastewater through sewage and drainage
discharge systems. Human pathogenic bacteria, particularly members of the
coliform can inhabit on fishes and thrive in aquatic environment Saha et al. (2012).
Water
become unsafe for human consumption or usage when it contains pathogenic or
diseases causing microorganisms. The consumption of unhygienic drinking water
and uses of unsafe water for daily purposes lead to the prevalence of diseases
among the population Moe and Rheingans (2006). Total coliforms (TC) comprise bacterial species of faecal
origin as well as other bacterial groups (e.g., bacteria commonly occurring in
soil). Consumption of water with high TC counts in water are usually manifested
in the form of diarrhoea and sometimes as fever and other secondary
complications.
Dungarpur
district population is increased every year but water sources are not much
enough. However,
microbial contamination in the drinking waterbodies is districts problem that
warrants a proper attention. It is evident from hospital data and its
correlation with microbial burden of water that the issue is of prime health
concern in district and elsewhere. In view of this, an attempt has been made to assess the
impact of drinking water on human health in prevailing conditions of its
availability and contamination in this district.
2. MATERIAL AND METHODS
2.1. Sampling
Samples were collected in sufficient volumes from five
sites in early hours of the day during every season sterile sample bottles in
the pre-monsoon (February to May), post-monsoon (October to January) and
monsoon (June to September) seasons in year 2015-2016.
2.2. Microbiological analysis
MPN
for Coliform Bacteria
Escherichia
coli are
isolated by inoculating the sample in Bismuth green bile broth. Enteric
bacteria isolated on respective selective or differential media were identified
on the basis of their colonial, morphological and Biochemical properties Table 1 following Bergey’s Manual of
Determinative Bacteriology, 1994.
This
is the test for differentiate between related genera or between species within
a genus and get information about particular species.
Table 1
|
Table 1 Biochemical Test |
|||
|
S. No. |
Biochemical Testing |
Inferences |
Type of Bacteria |
|
1 |
Indole test |
Appearance of pink coloured
ring positive |
E.coli. present |
|
2 |
Methyl red test: |
positive |
E.coli and Citrobacter freundii
present |
|
3 |
Citrase utilization test: |
green colour or blue colour Green
Negative. Blue- Positive |
Absence or presence of
Citrobacter freundii. |
|
4 |
Urease test: |
yellow colour - negative. pink colour - positive. |
Citrobacter freundii. and Klebsiella pneumoniae present |
|
5 |
Oxidase reaction: |
Appearance of purple colour
within 30 minutes. |
P. aeruginosa. |
|
6 |
Fermentation and gas production test: |
Change of colour from blue
to yellow. |
Presence of fermenting and gas producing bacteria. |
Escherichia
coli were
identified using MacConkey and Brilliant green blue broth as total coliform
units in the samples.
IMViC Test
Differentiation of principal groups of enteric
bacteria can be accomplished on the basis of their biochemical properties and
enzymatic reactions in presence of specific substrates. So, the IMViC test was
adopted for discerning the types of bacterial contaminants in water.
Characteristic based on IMViC pattern
|
Organism |
Indole |
Methyl Red |
Voges Proskauer |
Citrate |
|
Escherichia coli |
+ |
+ |
- |
- |
|
Shigella sp |
+ or - |
+ |
- |
- |
|
Citrobacter freundii |
- |
+ |
- |
+ |
|
Citrobacter diversus |
+ |
+ |
- |
+ |
|
Klebsiella, Enterobacter and Aerobacter group |
+ or - |
- |
+ |
+ |
The IMViC tests stands for four different tests: a)
Indole test; b) Methyl-red test; c) Voges-Proskauer test; and d) Citrate
utilization test. The letter “i” included for pronunciation. For this test,
methodology suggested by Cappuccino and Natalie (2004) was adopted.
3. RESULT AND DISCUSSION
In this study
two indicators of the microbial contamination were analyzed. Total Coliform
organism and E. coli count per 100 ml
of sample was estimated. so high microbial load can already be expected in
data. Total coliform value as illustrated in Figure 1 was the
real matter of concern. It was from over 200 MPN/ 100 ml in winter to more than
1600 (over the measurable limit) in rainy season in three water bodies. Least
coliform value was measured in winter and highest in rainy season.
3.1. Total Coliform
Figure 1

|
Figure 1 Graphical Representation of Total Coliform in the Water Bodies in Three
Seasons |
Total Coliform - In
Adward samand total coliform was >1600 in rainy season, 500 in winter and
900 in summer. This count in Dimia talab was 900, 280 and 300 in Gapsagar 1600,
900 and 900, in Sabela pond >1600, 900 and 1600 and in Margia dam 900, 220
and 900 in respective seasons. So, there was difference in the microbial load
of different water bodies, and drastic seasonal variation is also apparent.
Coli Count
The count was dependent on the location of reservoirs,
waste and sewerage entry and the inflow of the water during rains from surrounding
area. The count of > 1600 / 100 ml is maximum measurable and this value
virtually indicates any count above 1600. So, in rainy season coliform count of
Adward samand and Sabela may appear same, but their actual microbial burden may
be different.
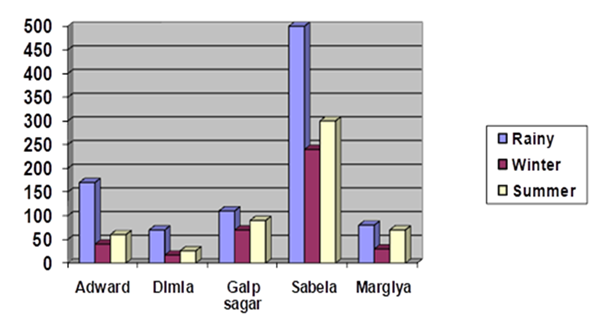
Figure 2
|
Figure 2 Graphical Representation of E. Coli Organism in the Water Bodies in Three Seasons |
In rainy season
the coliform count in Adward samand may be the result of the inflow of runoff
water from surrounding area. Gap sagar and Sabela are polluted from city
wastage (as mentioned in previous section of this chapter), so in these two
water bodies high bacterial count is owing to incessant contamination. Margia
dam exhibited lowest bacterial count in all seasons, still it is very high. As
far as seasonal variation is concerned coliform counts were lowest in winter
and highest in rainy months. This explains the high coliform count during
monsoon months. The temperature also influences the trend in variation of
density of bacterial population Patralekha (1992). Hence, coliform burden during summer was also high.
The result of the seasonal variation and counts of total coliform in this study
matches with the work of Latha and Ramachandra (2013) conducted in Bangalore, Karnataka. Identical pattern
of seasonal variation has been recorded in reports of Paille et al. (1987), Ouma et al. (2016) and Pande et al. (1983). Guideline of water quality standard BIS (2012) stipulates that there should be no detectable
coliform in water sample. Therefore, proper treatment of these reservoirs water
before using it for drinking purpose is inevitably required. The surge of
microbial count in rainy season reflects in hospital data and socioeconomic
survey also as the incidences of gastrointestinal infections.
E. coli organism – Faecal contamination magnitude could be ascertained by
E. coli estimation Figure 2 in water sample. In our samples data repeat pattern
with Coliform counts. E. coli value
as illustrated in Figure 2 count was highest in rainy month, lesser in summer and
least in winter in all five water bodies. The count in three seasons (in rainy,
winter and summer season) as organism/ 100 ml was 170, 40 and 60 in Adward
samand; 70, 17 and 26 in Dimia talab; 110, 70 and 90 in Gap sagar; 500, 240 and
300 in Sabela pond; and 80, 30 and 70 in Margia dam. Hence, though the coliform
count was high in Adward samand actual faecal contamination is low, and it is
same with Dimia Pond and Margia dam. It is evident that despite the high counts
of total coliform the faecal contamination level in these three reservoirs is
low. Sabela pond is explicitly the most polluted among all and after that Gap
sagar is also highly contaminated. Actually, the E. coli count produces the real picture of faecal and sewage
contamination of reservoirs.
3.2. IMViC Test
Table 2
|
Table 2 Result
of IMViC Test Reactions of Water Samples in Different Seasons of Year |
||||||
|
S. No. |
Water body |
Date/ Season of Collection |
IMViC test reaction |
|||
|
Indole |
Methyl -red |
Voges-Proskauer |
Citrate utilization |
|||
|
1. |
Adward samand |
05/10/2015; Rainy season |
+ |
+ |
+ |
+ |
|
02/02/2016; Winter season |
+ |
+ |
– |
– |
||
|
07/05/2016; Summer season |
+ |
+ |
– |
+ |
||
|
2. |
Dimia Talab |
05/10/2015; Rainy season |
+ |
+ |
+ |
+ |
|
02/02/2016; Winter season |
+ |
– |
– |
– |
||
|
07/05/2016; Summer season |
+ |
+ |
– |
– |
||
|
3. |
Gap Sagar |
05/10/2015; Rainy season |
+ |
+ |
+ |
+ |
|
02/02/2016; Winter season |
+ |
+ |
– |
– |
||
|
07/05/2016; Summer season |
+ |
+ |
– |
+ |
||
|
4. |
Sabela Talab |
05/10/2015; Rainy season |
+ |
+ |
+ |
+ |
|
02/02/2016; Winter season |
+ |
+ |
+ |
– |
||
|
07/05/2016; Summer season |
+ |
+ |
+ |
+ |
||
|
5. |
Margiya Dam |
05/10/2015; Rainy season |
+ |
+ |
– |
+ |
|
02/02/2016; Winter season |
– |
+ |
– |
+ |
||
|
07/05/2016; Summer season |
+ |
– |
+ |
– |
||
Perusal
of the results of IMViC test Table 2 reveals that all the surveyed
water-bodies were categorically contaminated with enteric bacteria. And, as
exhibited data calculated to previous table coli and Total coliform
contamination was highest in rainy season. But, in other seasons of year also
microbial load of enteric pathogen existed with severe magnitude. This kind of
microbial load indicates the influx of sewer line or other kind of
contaminating drainage into the water body. Open defecation in around and in
catchment area may also be a reason of this kind of contamination burden.
3.3. Hospital data of the patients registered with waterborne disease symptoms
in Dungarpur
The
data of patients registered with symptoms of water-borne disease was collected
from Community or Primary health Centers (CHC or PHC) and hospitals from all
blocks of Dungarpur district. There are
two major Hospitals, seven Community Health Centre (CHC), forty-two Primary
Health Centre and 302 Sub Centers in the District. The data was compiled
block-wise from health-centers and sub-centers. Altogether there are five
blocks in district and named as Dungarpur, Simalwara, Bicchiwara, Aaspur and
Sagwara. Hospital, health centers and sub centers of all the blocks were
covered in data collection. Only the figure of the patients registered or
admitted with symptoms of water-borne disease (WBD) was collected. Since, the
problem being addressed in this study is related to drinking water, so other
types of water-borne disease like Malaria etc. was not taken into account. Number of the patients reporting common
symptoms of WBD like nausea & vomiting, acute Diarrhoea, Gastroenteritis,
Dysentery, Abdominal pain & cramps, Typhoid etc. were noted and compiled.
Patients with hepatitis A were not reported in hospital during the period of
data collection. The data of Indoor patients admitted in hospitals and those
who reported in OPD both were collected.
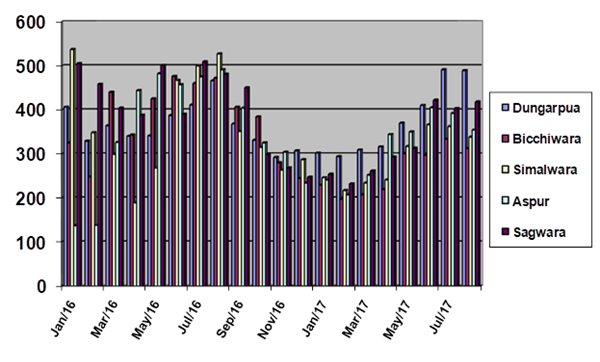
3.4. Out Patient Department (OPD) registration Data
It
may be noted that in the span of November 2016 to April 2017 the maximum
registered patients in any given month were 1413 (in April, 2017), and minimum
was recorded the month of February 2017 that was 1147. Maximum number of OPD
patients was registered in the month of August, 2016. Surprisingly in the month
of January, 2016 to April, 2016 the figure of OPD patients is 1910, 1521, 1833
and 1704 respectively. These figures are substantially higher than the
corresponding months of 2017.
However,
the general trend noted in the data of all five blocks and the entire district
is that the number of patients suffering from the said symptoms was lesser in
the months of winter, more in the latter half of summer and maximum during
rainy season. Data of January 2016 seem aberrant from that trend. Besides, it
was also observed that in all the months of 2016 the number of patients were
higher than corresponding months of 2017.
Figure 3
|
Figure 3 Graphical Representation of the Number of OPD Patients in Different Blocks of Dungarpur District During January 2016 to Aug 2017 |
3.5. Indoor Patient Admission Data
Perusal
of indoor patients’ data also exhibits a seasonal pattern in the upsurge of
common WBD symptoms in the population. From November 2016 to February 2017 the
number of admitted patients was minimal. Maximum admission was again recorded
in summer and rainy months. Figures of months January-February 2016 is again
deviant from the general pattern. This is because of the recorded admissions
more than in corresponding months of 2017 in Sagwara, Simalwara and Aaspur
blocks. With onset of the month of summer reports of WBD symptoms starts
increasing it reaches to maximum in months of June to August.
Graphical
illustration of the indoor patient’s data from all the five blocks in district
is being given in Figure 4. The graph clearly indicates a
seasonal pattern of upswing in the number of patients with WBD symptoms in
summer and rainy months. In the graphical presentation, it also appears that
there is maximum registration of patients in Dungarpur block. As the main
district hospital is located in Dungarpur city, so many referral cases from
health centers of other blocks of district are also registered there.
Figure 4

|
Figure 4 Graphical Representation of the Number of Indoor Patients in Different Blocks of Dungarpur District During January 2016 to July 2017 |
3.6. Total number of OPD and Indoor patients Data
The
trend of seasonal variation in WBD patients registering in hospital is similar
to the indoor and outdoor patients’ data shown earlier. Data of Simalwara,
Dungarpur, Sagwara and even in Bicchiwara blocks in the month of January 2016
is much higher in comparison to that of January 2017. This drastic difference
in the number of patients in the same month of consecutive two years is
something intriguing. It may be associated with some other reason that affected
the surge in the number of patients in the month of January 2016. In the month
of April 2016 again the number of Simalwara block was lowest in the entire
duration of data collection and much lower in comparison to the numbers from
other blocks too.
It is
apparent from the scrutiny of hospital data that seasonal variation in the
number of WBD patients does exhibit a trend that in late summer and rainy
month’s incidence of the disease symptoms intensifies and figures in the month
of winter are lower. Needless to mention that in late
summer the source of drinking water dries up enhancing the chance of consuming
contaminated water by the rural populace. It has been noted already that
microbial load of water bodies goes up and this attribute of rainy season
contamination of water seem to be associated with the trend that appears in
hospital data.
The
graphical representation of the data of total WBD patients in different blocks
and in entire district of Dungarpur Figure 5 presents a distinct picture of
the seasonal variation in numbers.
Figure 5

|
Figure 5 Graphical Representation of the Total Number of Indoor and Outdoor Patients in Different Blocks of Dungarpur District During January 2016 to July 2017 |
The
experimental and field survey data presented in this chapter signifies some
interesting findings related to the sources of drinking water with physico-chemical
cum microbial properties, their contamination potential and correlation of the
incidence of water-borne disease with socio-economic and educational profile of
the community in study area. In the graphs depicted in Figures III -IV this
data trend is clearly discernable. Therefore, the hospital data confirms the
assumption that upsurge in microbial load in water-bodies is reflected in
escalation of gastro-intestinal problems in the community.
This
problem of microbial contamination of drinking water and consequential symptoms
of GI epidemic gets more compounded when the sanitary conditions are poor due
to economic backwardness and unawareness towards observing proper hygiene in
daily life, and Dungarpur district falls in such a category. Hence, studying
the problem of microbial assessment in this district is very relevant
particularly in socio-economic prospective.
4. CONCLUSION
The aspects
of the problem as discussed above are upsurge in microbial contamination during
late summer and monsoon in waterbodies of the district. For the rise of
microbial load in water resources rainfall and runoff may be the reason but it
is compounded by reckless and unrestrained sewage, fecal waste and garbage
dumping in the waterbodies and open defecation. Local population particularly
people from lower economic strata are compelled to use unsafe water and ignore
sanitation or hygiene. Hence Awareness
campaigns Monitoring the water-sources in disease-prone season and
strengthening and maintaining the filtration system by PHED is
recommendable.
CONFLICT OF INTERESTS
None.
ACKNOWLEDGMENTS
None.
REFERENCES
APHA, AWWA, WEF. (2005). Standard Methods for the Examination of Water and Wastewater, 21st Edition. Washington, DC.
BIS (2012). Indian Standard: Drinking Water- Specification, 2nd revision. IS10500:2012; 1-18.
Cappuccino, James G. and Sherman Natalie (2004). Microbiology- A laboratory Manual. Pearson Education (Singapore) Pvt. Ltd., Indian Branch, 482 FIE Patparganj, New Delhi. pp. 153-156.
Chhabra, V. K. (2008). A manual on Water, Waste Water and Material Analysis, Indian Water Works Association (IWWA), Jaipur.
Latha, N. and Ramachandra Mohan, M. (2013).
Microbial Pollution – Total Coliform and Fecal Coliform of Kengeri Lake,
Bangalore Region, Karnataka, India. Int. J. of Scientific and Res. Pub. 3(11),
1-3.
Moe,
C.L. and Rheingans, R.D. (2006). Global Challenges in Water, Sanitation
and Health. J Water Health. 4:41-57. https://doi.org/10.2166/wh.2006.0043
Ouma, S. O., Ngeranwa, J. N., Juma, K. K. and Mburu, D. N. (2016). Seasonal Variation of the Physicochemical and Bacteriological Quality of Water from Five Rural Catchment Areas of Lake Victoria Basin in Kenya. J. Environ. Anal. Chem. 3(1), 1-7.
Paille, D., Hackney, C., Cole, L. R. M. and Kilgen, M. (1987).
Seasonal Variation in the Fecal Coliform Population of Louisiana Oysters and
its Relationship to Microbiological Quality. J. Food Protec., 50 (7), 545-549.
https://doi.org/10.4315/0362-028X-50.7.545
Pande,
J., Das, S. M. and Misra, D. S. (1983). Studies on Bacteriological
Quality of Nainital Lake water in Different Seasons. Water, Air and Soil
Pollution. 19, 149-154. https://doi.org/10.1007/BF00211801
Patralekha, L. N. (1992). Bacterial Density in the Ganges at Bhagalpur, Bihar. J. Eco. Bio. 3(2), 102-105.
Saha, M.L., Nessa, M., Khan, M.R., Islam, M.N., Hoque, S. (2012). Bacteriological and Physicochemical Water Quality of Four Ponds of Dhaka Metropolis. Bangladesh J. Bot. 41:55-60. https://doi.org/10.3329/bjb.v41i1.11083
 This work is licensed under a: Creative Commons Attribution 4.0 International License
© Granthaalayah 2014-2023. All Rights Reserved.