MID CRETACEOUS SUBSURFACE CARBONATE DEPOSIT AND RESERVOIR DEVELOPMENT OF THE MFAMOSING LIMESTONE CALABAR FLANK
Selema, S.B. 1, Acra, E.J. 2, Ideozu, R.U. 3![]()
1, 2, 3 Department of Geology, University of
Port Harcourt, Port Harcourt, Nigeria
|
|
|
ABSTRACT |
|
|
This research
analyzed the reservoir quality of the Mfamosing Limestone with a view to
classifying it as a potential reservoir rock within the Calabar Flank.
Materials used in this research are processed seismic data acquired around
the Calabar flank and well logs of three wells (A, B, C) drilled at different
periods within the study area, core as well as mud log data. The procedure
used involved prospect identification and mapping, structural and
stratigraphic analysis, reservoir quality and classification of the carbonate
rock in the study area. The results
were analyzed and classified the Mfamosing Limestone using hydrocarbon
storage capacity and deliverability potential. Wells A and B was drilled
0.8km apart and well C drilled 4.7km from well B which encountered the
Mfamosing Limestone with logs indicating hydrocarbon in Well A which had a
shallower sandstone lenses. The sandstone lens in
Well A was tested for hydrocarbon and flowed briefly and stopped. Wells B and
C were planned and drilled using Well A as reference amongst other parameters
to evaluate the hydrocarbon potential of the Mfamosing Limestone. Wells B and
C were found completely dry. Two
conventional coring runs at depths 10,490ft-10,552.5ft and 10,552.5ft-10,614ft
in Well B indicated that the cored intervals are light grey, moderate to very
hard, and fossil rich limestone with no direct fluorescence. The core
analysis results suggest that limestone is dry and highly indurated with no
evidence of physical porosity. This suggest that the Mfamosing Limestone
penetrated by all three wells though massive has no hydrocarbon storage
capacity and deliverability potential typical of a reservoir rock. This
research therefore suggests that the Mid Cretaceous subsurface Mfamosing
Limestone is more of a mineral carbonate deposit than a hydrocarbon reservoir. |
|||
|
Received 18 April 2023 Accepted 20 May 2023 Published 20 June 2023 Corresponding Author Ideozu, R.U., richmond.ideozu@uniport.edu.ng DOI 10.29121/granthaalayah.v11.i5.2023.5175 Funding: This research
received no specific grant from any funding agency in the public, commercial,
or not-for-profit sectors. Copyright: © 2023 The
Author(s). This work is licensed under a Creative Commons
Attribution 4.0 International License. With the
license CC-BY, authors retain the copyright, allowing anyone to download,
reuse, re-print, modify, distribute, and/or copy their contribution. The work
must be properly attributed to its author.
|
|||
|
Keywords: Conventional Coring, Hydrocarbon Storage
Capacity and Deliverability, Fluorescence, Hydrocarbon Reservoir |
|||
1. INTRODUCTION
This research takes into account two
different phases of analysis in the development of this work – the pre drill analysis and the post drill analysis phases. The pre drill analysis considers all the historical backgrounds
of the study area, the geologic and geophysical studies carried out as well as
data from satellite fields and a reference well (well A) drilled in same area
(Calabar Flank) in making some geologic inferences. The post drill analysis
explains the findings from the outcome of the wells drilled (Well A and B) on
the basis of the pre drill analysis earlier carried
out. The reference well and all other wells drilled subsequently were all
drilled, south central of the Calabar Flank which encountered the Mid
Cretaceous Mfamosing Limestone. The structure is a stratigraphic play which was
tested for hydrocarbon bearing shallow sand lense in
Well A drilled at the flank of the structure down dip the carbonate platform,
however Well B and C was drilled through the crest and updip
of the same platform to appraise well A and the deeper end of the structure
respectively did not encounter hydrocarbon Selema
et al. (2022). This makes it geologically gratifying to classify the
carbonate structure as either hydrocarbon reservoir or a carbonate mineral
deposit using the information provided by the pre drill
analysis and post drill (well data) analysis collated in this research work. Ekpo et al. (2013) for a better
understanding of the hydrocarbon generation potential of the Calabar Flank,
carried out a detailed geochemical and organic petrographic studies with the
aim of reconstructing paleoenvironmental control on the deposition of
organic-rich shales in the Calabar Flank. Previous studies on the Cretaceous
sediments in outcrops of the Calabar Flank are mostly limited to geological
descriptions Adeleye and Fayose (1978), Petters (1982), Reyment (1965), Petters et al. (1995). Other
geochemical studies in the Calabar Flank include organic geochemical appraisal Essien and Ufot (2010), geochemical
studies of subsurface limestone Ekwere (1993) and geochemistry and organic petrography Ekpo et al. (2012). The Calabar Flank is that
part of the southern Nigerian sedimentary basin characterised by crustal block
faulting and is bounded by the Oban Massif to the north and the Calabar Hinge
Line delineating the Niger Delta Basin in the south Figure 2. It is also separated from the Ikpe Platform to the west by a NE–SW
trending fault in the eastern part, extending up to the Cameroon Volcanic
Ridge. The Cretaceous shales exposed in the Calabar Flank are unique in Upper
Cretaceous sequence Ekpo et al. (2013). The study area is located
Cross River State, within the southern part of the Benue Trough. The study area is one of the most folded and
mineralized sediments in Nigeria. The area is low lying and appears physiographically well defined, relating perfectly with the
Cross-river drainage area. Its eastern boundaries are the basement complex
province of the Obudu Plateau and the Oban Hills both
of which are extensions of the Cameroonian mountains about 1800m above sea
level Figure 1.
Figure 1
|
Figure 1 Map Showing Structural Elements of the Calabar Flank and Adjacent Areas (Redrawn from Nyong and Ramanathan (1985). |
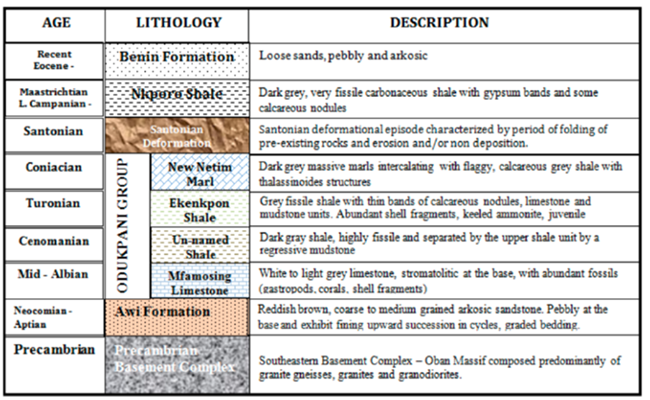
2. Stratigraphy
The associated
transgressive and regressive cycles, this region experienced made sediments of
varying composition to be deposited Nyong and
Ramanathan (1985). The
sedimentary succession in this region comprises Cretaceous sequences - the Awi Formation,
the overlying marine Odukpani Group and Nkporo Shale and Tertiary sediments – the Benin Formation
(see Figure 2a). The main
geologic and stratigraphic units that underlie this region includes the arkosic sandstones of the Awi Formation, Mfamosing
Limestone, the Ekenkpon Shale (organic shale, calcareous mudstones, and oyster
beds), New Netim Marlstones, Nkporo
Shale (carbonaceous shales, mudstones and gypsum) and
the Benin Formation Offiong and Edet (1998). The
Cretaceous sedimentary rocks range from the Aptian to Campo-Maastrichtian
whereas sedimentation began with the deposition of the Awi formation Sandstones
interbedded with shales uncomformably overlain by fossilifereous Mfamosing Limestone which continued with the
deposition of the Ekenkpon shale and New Netim Marlstone. A period of
non-deposition was recorded during the Late Coniacian to Early Campanian such
that sedimentation in the Cretaceous ended with the deposition of the Nkporo Shale - Late Campano-Mastrichtian
Figure 2.
Figure 2
|
Figure 2 Stratigraphic Chart of the Calabar Flank (Modified after Petters et al., 2010). |
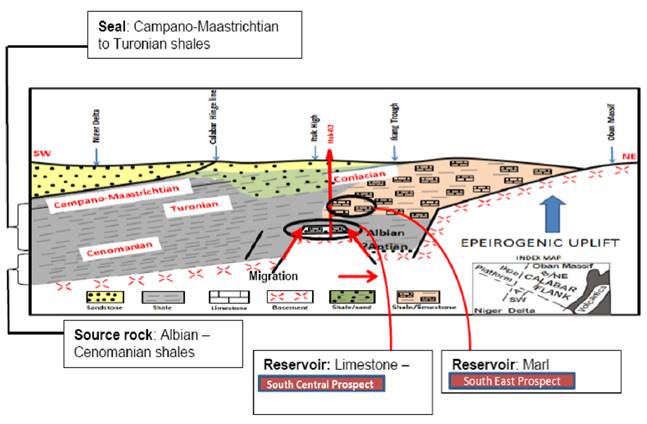
3. Petroleum System and Play in the Calabar Flank
The late Albian
to Cenomanian Shale is believed to be the possible source rocks within the
Calabar Flank while the main reservoir rock is the Mfamosing Limestone
deposited Mid Albian. The trapping mechanisms may be predominantly
stratigraphic features. While the migration pathways are macrofractures
which may have been enhanced by the Santonian orogeny. The Nkporo
Shale may act as the seal to the reservoir rock - Mfamosing
Limestone Figure 3 - Figure 4. According to Reijers and Petters (1997), Well A was
drilled within the limestone sequence of the Mfamosing Limestone and coupled
with observed oil seepages within the study area to the surface further
confirms a functional petroleum system in place. Ekpo et al. (2013), showed from
their work that the bulk geochemical data such as TOC and SOM, of most of the
samples except those at the basement boundary have TOC contents higher than
0.5wt.% with high extractibility >500 ppm,
the minimum requirements for source rocks. The TOC content of Mfamosing samples
is < 0.5wt.% and the extractability is <125 ppm while the
Ekenkpon Shale has TOC content > 0.5 wt.%, hence classified
as non-source rocks.
Figure 3
|
Figure 3 Possible Migration Pathway (Modified after Nyong, 1995, Reijers and Petters, 1997). |
Figure 4

|
Figure 4 Typical Stratigraphic Traps in Study Area |
4. Materials and Methods
Materials used for this research includes:
1) Seismic
2) Amplitude data
3) Well logs
4) Location and
structural Maps
5) Mud log data
6) Core data
Methods
The procedure
adopted in carrying out this research involves prospect identification and
mapping, structural and stratigraphic analysis, reservoir quality and
classification of the carbonate structure in the study area.
5. Results and Discussions
The
results of this research is presented in Figure 5, Figure 6, Figure 7, Figure 8, Figure 9, Figure 10, Figure 11, Figure 12, Figure 13, Figure 14, Figure 15, Figure 16 and Table 1, Table 2, Table 3, Table 4, Table 5, Table 6.
Figure 5
|
Figure 5 Cross line 1426 Through South Central Prospect Structure. UT1 – UT4 and Near Base |
Figure 6

|
Figure 6 Near Base (Carbonate) Depth Structure Map |
Figure 7

|
Figure 7 South Central Prospect Map and Sweetness Seismic Attribute Extract Highlighting the Stratigraphic Prospect Area |
Figure 7a
|
Figure 7a Amplitude
Supported Prospect Identification and Mapping |
Figure 7b

|
Figure 7b Near Base
(Carbonate) Prospect |
Figure 8

|
Figure 8 Time Slice at 2834ms and Inline 5316 Showing RMS Amplitude Extraction at South Central Prospect Location. |
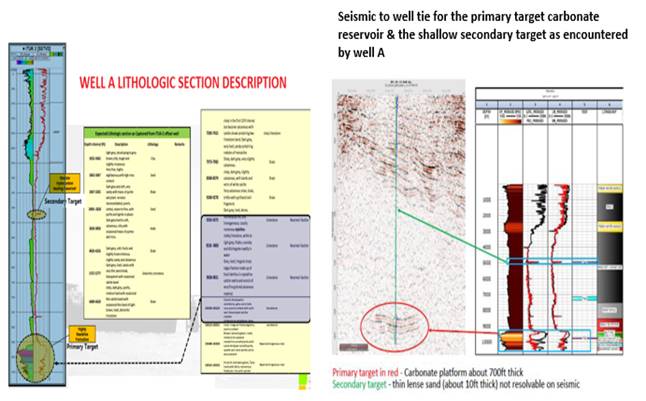
The generated seismic attributes shows the relationship between the encountered hydrocarbon interval in Well A at the flank of the stratigraphic play structure and Well B updip of the carbonate platform identified by bright amplitude anomaly - direct hydrocarbon indicator Figure 8. The reservoir levels were interactively inferred from descriptions of the ditch cuttings and log signatures Figure 9, Figure 10, Figure 11, Figure 12. Well B was drilled as a deviated exploration/appraisal well to target the Near Base prospect structure. The well was drilled to a total depth of 11277ftMD in 2018. The well was drilled from a two well cellar where well A (drilled earlier) currently exists. The hole was however, plugged as analysis of evaluation logs showed no indication of hydrocarbon. The objective was to penetrate and appraise the near base carbonate at the crest and also appraise the updip section of the structure. However, when penetrated the Mfamosing Limestone (carbonate rock) was found completely dry and highly indurated. Well C was drilled with the objective of penetrating the Mfamosing Limestone (carbonate rock) at the flank updip to investigate the near deep of the structure was found completely dry with highly indurated carbonate as observed in Well C, two (2) conventional coring runs was carried out - Core 1: 10,490ft–10,552.5ft and Core 2: 10,552.5–10,614.25ft respectively. See Figure 13 – Figure 14 and Table 1 - Table 2. Lithologic descriptions of the cored sections showed that the cored interval within the primary target showed a light grey, moderate to very hard, and fossil rich limestone with no direct hydrocarbon fluorescence. However, some oil stains with direct fluorescence were observed in the secondary target (shallow reservoir - sandstone), further confirming the presence of hydrocarbon and validating the submission of Well B – Ekpo et al. (2013) classified the Mfamosing Limestone as a non-reservoir rock.
Figure 9
|
Figure 9 Seismic Section Showing the Seismic to Well tie for the Primary Carbonate Platform Target Near Base (NB) Reservoir and the Shallow Secondary Target as Encountered by Well A. |
Figure 10
|
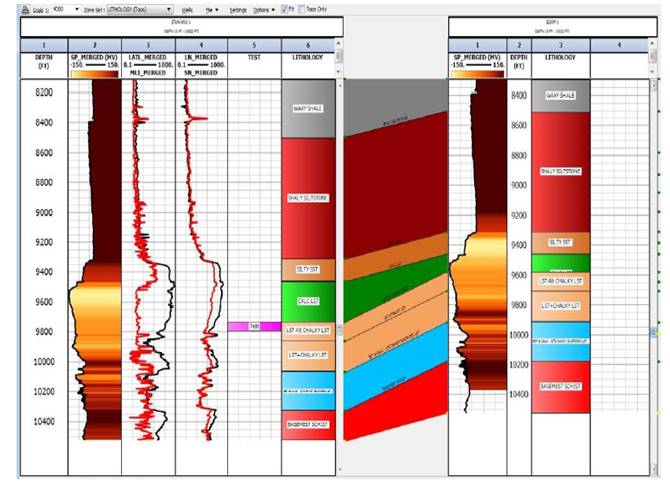
Figure 10 Lithostratigraphic Correlation Between Well A and Prognosed Well B Highlighting Near Base Reservoir Level. |
Figure 11

|
Figure 11 Lithostratigraphic Correlation Between Well a and well b. well a was Drilled to Target the Flank of the Near Base Reservoir Encountered Gas/Condensate. |
Figure 12

|
Figure 12 Lithological Description of Ditch Cuttings in Well A – the Carbonate Platform |
Geologic Chance of Success
The geologic chances of success for development of the study area was analyzed and based on this, the two planned wells (Well A and B) were drilled and tested for hydrocarbon. Table 1, Table 2, Table 3, Table 4.
Table 1
|
Table 1 Volumetrics for Target Reservoir |
||
|
Geologic
Factor |
Probability
(0.1) |
Comment/Reasoning |
|
Source
Rock Presence and Maturity |
0.1 |
Source
Rock seen by Well A |
|
Migration
from Mature Kitchen/Preservation |
0.8 |
Well
A found condensate |
|
Presence
of Reservoir Facies |
0.85 |
Stratigraphic
trap – Carbonate platform with a higher relief target |
|
Seal
Integrity |
0.2 |
Prospect
overlain by Netim Marl/Nkporo
Shale |
|
Geologic
Chance of Success |
0.61/61% |
|
Table 2
|
Table 2 Oil Case Volume |
||||
|
|
Percentile
Forecast Values (MMBbl) |
|||
|
Prospect |
Reservoir
horizon |
P10 |
P50 |
P90 |
|
South
Central Prospect |
Near Base |
20.2 |
45.6 |
83.6 |
Table 3
|
Table 3 Gas Case Volume |
||||||
|
Reservoir Horizon |
Prospect |
Cases (ft) |
GRV (MMCF) |
GRV (MMCF) Base Case |
GIIP (MMCF) |
GIIP (MMCF) Base Case |
|
NEAR BASE |
South Central Prospect |
High D-1-9310 |
5257.9 |
5217.2 |
444.0 |
440.7 |
|
High D-2-9310 |
4744.2 |
400.9 |
||||
|
Low -9170 |
433.2 |
36.5 |
||||
Table 4
|
Table
4 Petrophysical Parameters |
||
|
NTG (V/V) |
Porosity (V/V) |
Hydrocarbon Saturation (V/V) |
|
0.65 |
0.2 |
0.65 |
Figure 13a

|
Figure 13 a Well B Cored and lithologic Interval Description |
Figure 13b

|
Figure 13 b Well B Core
Photos of Carbonate Target Reservoir |
Figure
14

|
Figure 14 Well A Core Photos of Carbonate Target Reservoir |
Figure 15

|
Figure 15 Seismic Section Through South Central Prospect Structure Showing the Position of Well A and Well B. |
|
Table 5 Stratigraphic and Lithologic
Sequence of the Calabar Flank with Wells that Penetrated Each Section. |
|||
|
Age |
Formation |
Depositional
Environment |
Wells That
Penetrate Formations |
|
Campanian-
Maastrichtian |
Nkporo Shale |
Shallow - Marine |
Wells A, B, C
penetrated this formation |
|
Santonian |
Santonian
Episode |
No Deposition |
No Record |
|
Coniacian |
New Netim Marl |
Marine |
Only Well C
penetrated |
|
Cenomanian -
Turonian |
Ekenkpon Shale |
Marine |
Wells A, B. C
penetrated this formation |
|
Albian |
Mfamosing |
Marine |
A, B, C
penetrated Formation |
|
Aptian |
Awi Formation |
Fluvio-Deltaic |
A, B, C
penetrated Formation |
|
Precambrian |
Oban Basement |
|
|
Figure 16

|
Figure 16 Correlation of Stratigraphic Units Penetrated by Three Wells in This Work |
Table 6
|
Table
6 Wells
that Penetrated the Mfamosing Limestone in the Calabar Flank. |
||
|
WELL A |
WELL B |
WELL C |
|
§ Encountered Mfamosing Limestone. |
Encountered Mfamosing Limestone. |
Encountered Mfamosing Limestone. |
|
§
Logs indicate presence of
HC – shallow sandstone reservoir. |
Logs indicating no presence of HC of
the Mfamosing Limestone. |
Logs indicating no presence of HC of the Mfamosing Limestone. |
|
§
Shallow sandstone lenses of Well A tested for flow. |
Cores shows Mfamosing Limestone highly
indurated with no visible porosity. |
Cores shows Mfamosing Limestone highly indurated with no visible porosity. |
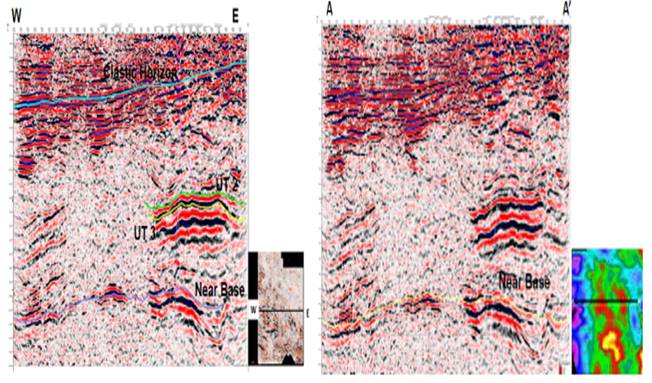
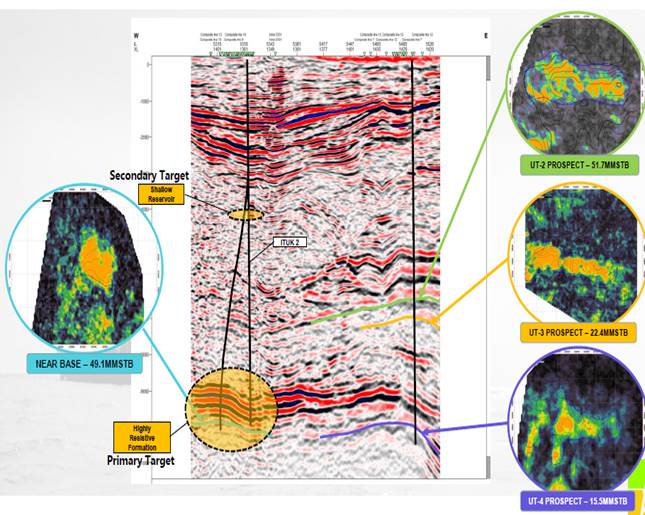
6. Pre-drill Interpreted Seismic Sections/Attributes
A
block-wide seismic horizon interpretation was carried out for the near basement
Carbonate platform (Mfamosing Limestone) (Figure 4and Figure 4b). Structural
maps were generated based on the results of the interpreted horizons which
revealed prospective locations (see Figure 5 - Figure 6). Seismic
horizon interpretations of the study area carried out with amplitude anomaly
support produced series of prospects which were selected for exploration. UT-2,
UT-3, UT-4 and the near base carbonate prospects were
identified and mapped based on their structural configuration (see Figure 7a and Figure 7b). Seismic
attributes indicated that UT-2 exhibited a moderate degree of conformity to the
structural configuration while UT-3 and Ut-4 showed poor conformity to
structure suggesting that the lithological imprint could provide some
enablement for hydrocarbon accumulation. The near base carbonate prospect was
identified and selected for exploration due to its monoclinal structural
configuration Figure 7b. Additionally,
Well A that penetrated same region encountered some hydrocarbon in the sand
lenses. This prospective structure is not a fault dependent closure
and it is conformable to seismic attribute extract. The South
Central prospect stratigraphic play exists at seismic time window of
about 2700ms to 3000ms delineated by series of stacked bright amplitude anomaly
(see Figure 8). Based on the
identified, selected and mapped near the base carbonate platform, Wells B and
C) were planned for development. The primary target for this well was the Near
Base carbonate platform which occurred at 9186.3 ft. TVDSS. The target
structure was tested by well A and traces of hydrocarbon found at the flank of
the structure down dip of the play. Well B was to encounter the structure near
the crest NW of the existing Well A identified by the bright seismic amplitude
anomalies that conformed to the identified structure for possible hydrocarbon
accumulations. Well C was drilled to encounter the structure updip to investigate the near deep structure Figure 7b.
7. Conclusion
The Mfamosing Limestone in the subsurface is a massive carbonate rock with no hydrocarbon storage capacity and deliverability potential typical of a reservoir rock. This research therefore suggests that the Mid Cretaceous subsurface Mfamosing limestone is more of a carbonate mineral deposit than a reservoir. It is one of the largest carbonate rock subsurface.
CONFLICT OF INTERESTS
None.
ACKNOWLEDGMENTS
None.
REFERENCES
Adeleye, D. R., and Fayose, E. A. (1978). Stratigraphy of the Type Section of Awi Formation. Journal of Mining and Geology, 15, 30–57.
Akpan, E. B. (1985). Ichnology of the Cenomanian–Turonian of the Calabar Flank, S.E. Nigeria. Geologie en Mijnbouw, 64, 365–372.
Akpan, E. B. (1992). Peruviella Dolium (Roemer) and the Age of the Mfamosing Limestone, SE Nigeria. Journal of Mining and Geology, 28, 191–196.
Boboye, O. A., & Okon, E. E. (2014). Sedimentological and Geochemical characterization of the Cretaceous Strata of Calabar Flank, Southeastern Nigeria. Journal of African Earth Sciences, 99, 427–441. https://doi.org/10.1016/j.jafrearsci.2014.04.035
Dessauvagie, T. F. J. (1974). Geological Map of Nigeria. (1 :1,000,000). Nigeria Mining and Geological Society.
Edet, J. J., & Nyong, E. E. (1993). Depositional
Environments, Sea Level History and Paleobiogeography of the Late
Campanian–Maastrichtian on the Calabar Flank, SE Nigeria. Palaeogeography,
Palaeoclimatology, Palaeoecology, 102(1–2), 161–175.
https://doi.org/10.1016/0031-0182(93)90010-G
Ekpo, B. O., Essien, N. U., Fubara, E. P., Ibok, U. J., Ukpabio, E. J., & Wehner, H. (2013). Petroleum Geochemistry of Cretaceous Outcrops from Calabar Flank, Southeastern Nigeria. Marine and Petroleum Geology, 48, 171–185. https://doi.org/10.1016/j.marpetgeo.2013.08.011
Essien, N. U., & Ufot, D. O. (2010). Age of Mfamosing Limestone, Calabar Flank, southeastern Nigeria. International Journal of Basic and Applied Sciences, 10(5), 8–19.
Fayose, E. A. (1987). Depositional Environments of Carbonates of Calabar Flank, South Eastern Nigeria. Nigerian J. Min. Geol., 15, 1–13.
James, N. P., & Kendall, A. C. (1992). Introduction to
Carbonate and Evaporite Facies Models. In R. G.
Walker & N. P. James (Eds.), Facies Models. Response to sea level changes. Geol. Association of Canada Sec. Publishing.
Kogbe, C. A. (1989). The Cretaceous
Palaeocene Sediments of Southern Nigeria. In C. A. Kogbe
(Ed.), Geology of Nigeria. Jos Rock View Ltd, 320–325.
Murat, R. C. (1972). Stratigraphy and Paleogeography of the Cretaceous and Lower Tertiary in Southern Nigeria.
Nair, K. M., Ramanathan, R. M., & Ukpong, E. E. (1981). Sedimentology and Stratigraphy of Cretaceous and Associated Rocks of Calabar Flank, Nigeria. Nigerian J. Min. Geol., 18, 120–129.
Nyong, E. E. (1995). Cretaceous sediments in the Calabar Flank. In B. N. Ekwueme, E. E. Nyong & S. W. Petters (Eds.). Geological excursion guidebook to Oban Massif, Calabar Flank and Mamfe Embayment, Southeastern Nigeria. Nigeria Mining and Geosciences society 31st Annual Conference, Calabar, March 12-16, 14–25.
Oti, M. N., & Koch, R. (1990). Mid-Cretaceous shelf carbonates: The Mfamosing Limestone, lower Benue Trough (Nigeria). Facies, 22(1), 87–101. https://doi.org/10.1007/BF02536946
Petters, S. W. (1978). Mid-Cretaceous
Paleoenvironments and biostratigraphy of the Benue Trough, Nigeria. Geological
Society of America Bulletin, 89(1), 151–154.
https://doi.org/10.1130/0016-7606(1978)89<151:MPABOT>2.0.CO;2
Petters, S. W., & Reijers, T. J. A. (n.d.). (In prep.). Karst in the Mfamosing Limestone, South-Eastern Nigeria.
Petters, S. W., Nyong, E. E., Akpan, E. B., & Essien, N. U. (1995). Lithostratigraphic Revision for the Calabar Flank. 31st Annual Conference Nig. Min. Geosci. Soc. Abs. 54.
Petters, S. W., Zaborski, P. M. P., Essien, N.
U., Nwokocha, K. D., & Inyang,
D. O. (2010). Geological Excursion Guidebook to the Cretaceous of
the Calabar Flank, Southeast
Nigeria 46th Annual Conference
‟Calabar. Nigerian Mining and Geosciences Society”. Grafitech,
S. Studio.
Reijers, T. J. A., & Petters, S. W. (1987).
Depositional Environment and Diagenesis of Albian Carbonates on the Calabar
Flank, SE Nigeria. Journal of Petroleum Geology, 10(3), 283–294.
https://doi.org/10.1111/j.1747-5457.1987.tb00947.x
Reijers,
T. J. A., & Petters, S. W. (1997). Sequence Stratigraphy Based on
Microfacies Analysis: Mfamosing Limestone, Calabar Flank, Nigeria. Geologie en
Mijnbouw, 76(3), 197–215. https://doi.org/10.1023/A:1003089529914
Reyment, R. A.
(1965). Aspects of the Geology of Nigeri, Ibadan University, 145.
 This work is licensed under a: Creative Commons Attribution 4.0 International License
© Granthaalayah 2014-2023. All Rights Reserved.