A Spatio-temporal Study of Land Use Land Cover analysis in Maniyari Basin Using GIS and Remote Sensing Techniques
Dipak Bej 1![]()
![]() ,
Dr. N K Baghmar 2
,
Dr. N K Baghmar 2![]()
1 Ph.D. Scholar, SOS in Geography, Pt. Ravishankar Shukla University, Raipur, India
2 Retd. Professor, SOS in Geography, Pt. Ravishankar Shukla University, Raipur, India
|
|
|
ABSTRACT |
|
|
Land is the
only valuable resource of the earth which separate the earth other planet.
Land is the base of life, the changing pattern of uses of land has been seen
over time from the Stone Age to modern time. On that way the present study
area of Maniyari basin has also been noticed
remarkable changes. Digital change detection methods used to identify changes
related with land use and land cover features using multi temporal remote
sensing data. The objectives of the paper analyze the changes of land uses over
time as well as the factor which is responsible for the transformation of the
land. LANDSAT ETM+ for the time frame of 2010 and Sentinal
2 data for the time frame of 2020 has been used for this present study. Total
area of the study region approximately 3700 sq. km. LULC Mapping has
consisted of basically four steps: Data acquisition, Data processing,
interpretation/classification, post verification through ground truth. NRSC
LULC Classification schema 2019 has been used for Land use Land cover mapping.
Agriculture Cropland. LULC classes which has been identified in this present
study are Barren Rocky, built up, Rural Built up, Urban, Canal, Dense scrub,
Forest, Forest Plantation, Gullied/Ravines, Industrial/Mining, Lake/Pond,
Open Scrub, Reservoir/Tank, River/Stream, Waterlogged. It has been found that
145 ha. Open scrub and 98 ha forest land converted into agricultural land.70
ha. of outer reservoir land converted into agricultural land. Significant
changes in the outer forest ecosystem have occurred in the study region, and
it must be reconstructed for tribal community who were relying heavily on
natural resources. |
|||
|
Received 20 April 2022 Accepted 19 May 2022 Published 21 June 2022 Corresponding Author Dipak Bej, DOI 10.29121/granthaalayah.v10.i6.2022.4635
Funding: This research
received no specific grant from any funding agency in the public, commercial,
or not-for-profit sectors. Copyright: © 2022 The
Author(s). This work is licensed under a Creative Commons
Attribution 4.0 International License. With the
license CC-BY, authors retain the copyright, allowing anyone to download,
reuse, re-print, modify, distribute, and/or copy their contribution. The work
must be properly attributed to its author.
|
|||
|
Keywords: LULC, Digital Change Detection NRSC,
Remote Sensing, Sentinal |
|||
1. INTRODUCTION
The most significant natural resource is land, which includes soil and water as well as the associated flora and wildlife, including the entire ecosystem. For the sustainable planning and management of land surface understanding the geographical distribution over time and current situation is plays an important role. Land use is the characterized by the anthropogenic activities and inputs by the people over natural land cover which undertake in a certain land cover type to produce change or maintain it. There are so many studies have been conducted in the different part estimation of LULC change analysis of watershed using specific methods. They are important to develop effective management strategies for watersheds worldwide Ashraf, A. (2013). Changing Hydrology of the Himalayan Watershed. Current Perspectives in Contaminant Hydrology and Water Resources Sustainability. Intech, Islamabad. Bazgeera et al. (2008) Caruso, G. Rounsevell, M. D. A. Cojacarus, G. (2005). Exploring a spatiodynamic neighborhood-based model of residential behaviour in the Brussels peri-urban area. Int. J. Geograph. Inf. Sci. 19, 103- 123. Dietzel, C. Herold, M. Hemphill, J. J. Clarke, K.C. (2005). Spatialtemporal dynamics in California's central Valley : empirical links to urban theory. Int. J. Geograph. Inf. Sci. 19, 175-195. Fortin, M. J. Boots, B. Csillag, F. Remmel, T. K. (2003). On the role of spatial stochastic models in understanding landscape indices in ecology. Oikos 102, 203-212. Gajbhiye, S. Sharma, S. K. (2012). Land use and land cover change detection of Indra river watershed through remote sensing using multi-temporal satellite data. Int. J. Geomatics Geosci. 3, 89-96. Hu et al. (2012) Kearns et al. (2005) Parker and Meretsky, (2004) Stewart, T. J. Janssen, R. van Herwijnen, M. (2004). A genetic algorithm approach to multiobjective land use planning. Comput. Oper. Res. 31, 2293-2313. Wang et al. (2004). Data framework and thematic change information that can lead to more tangible discernment to underlying process involved in upbringing of land cover and land use changes Ahmad, F. (2012). Detection of change in vegetation covers using multi-spectral and multi-temporal information for District Sargodha, Pakistan. Sociedade Natureza, 24, 557-572. Remote Sensing (RS) has been used to classify and map land cover and land use changes with different techniques and data sets. Landsat images in particular have served a great deal in the classification of different landscape components at a larger scale Ozesmi, S. L. Bauer, M. E. (2002). Satellite remote sensing of wetlands. Wetlands Ecol. Manage, 10, 381-402. Analyse the land use land cover change detection and the possible cause and sustainable management of the study of Raipur city, Chhattisgarh Using multi temporal remote sensing data (LANDSAT of year 1999 and 2016). The use of Geoinformatics has enabled us to assign spatial connotations to land use land cover changes, namely, population pressure, climate, terrain, etc which drive these changes. Roy, P. S. and Roy, A. (2010). Land use and land cover change in India : A remote sensing & GIS perspective, Journal of the Indian Institute of Science, 9(4), 489- 502. Human factor like population distribution, population growth, economic condition as well as various physical conditions such as relief, topography, geology, soil type, and climatic condition influences on Land use Land cover. Skole, D. and Tucker, C. (1993). Tropical deforestation and habitat fragmentation in the amazon : a Satellite data from 1978 to 1998, Science, 260, 1905-1910.. Many a civilization has perished in the past when its people misused and over and over exploited the land and interfered with the environment. Land use refers to ‘man’s activities on land, which are directly related to land’ Anderson et al. (1976) Building, lakes, forest, trees, and glacial ice are all examples of land cover types. The term land use relates to the human activity associated with specific place of land. Land use can also be described as urban use, residential use, or single-family residential use.
2. STUDY AREA
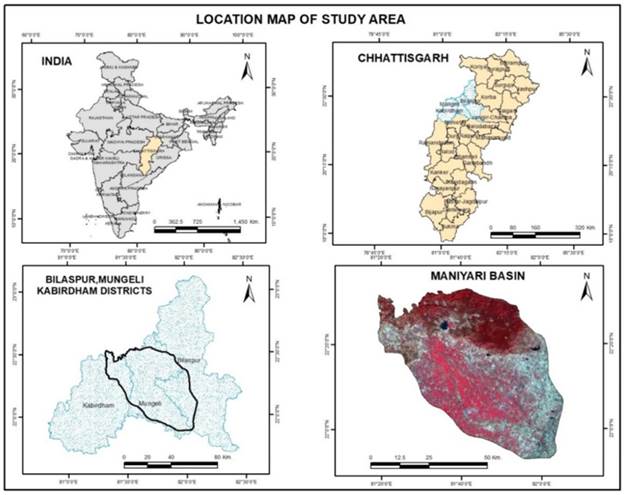
The Maniyari River is the tributary of Shivnath (tributary of Mahanadi) rises from Satpura Maikal hill, in the region Northwest of the Central plateau. The river flows from north, roughly through the central part of Mungeli district. The Maniyari river basin is a part of Shivnath catchment. The river Maniyari originated from Satpura Maikal Range. So, the Maniyari basin included all the three-ideal part of basin like hilly, plateau and plain. The study area consists of under the district of Kabirdham, Mungeli and Bilaspur, shown in Figure 1 Latitude and Longitude of the study area 21°55' 0" N to 22° 32'0" N and 81°15' 0" E to 82° 5' 0" E. Total area of the study region approximately 3700 sq. km. and the total population of the study area approximately 10 lakhs.
Figure 1
|
Figure 1 Location map of the study area |
3. DATA USED
Database is very important parameter to complete a study. This research work is based both primary and secondary data. there are two types of data has been used in this present study one is secondary which has been collect from survey of India and USGS Earth Explorer w, another primary data for ground truth survey has been conducted for Land use Landcover verification. Data would be collected from following sources shown in Table 1
Details of primary and secondary are given below the table:
Table 1
|
Table 1 Data sources and details |
||
|
Data types |
Data sources |
Details |
|
Satellite
Imageries |
NRSC,
ISRO |
LANDSATR
ETM+ (15 mt. resolution) and Sentinal 2 (10 mt.
resolution) |
|
Topographical
sheet |
Survey
of India |
64F06,64F07,64F10,64F11,64F12,64F14,64F15,
64F16,64G13, 64J03,64J04, 64K01 |
|
Ground
truth data |
Field
Survey |
LULC
information temporal data |
And other secondary data like map and administrative data will be collected from block development offices and from Panchayat and National Atlas and Thematic Mapping Organization (NATMO), Chhattisgarh Council of Science and Technology (Raipur) and Regional Remote Sensing Center- Central, Nagpur (ISRO).
4. METHODOLOGY
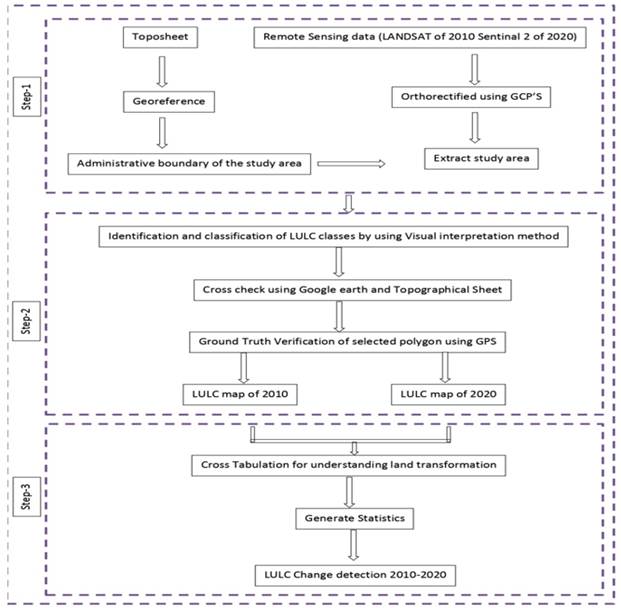
Methodology which has been adopted as follows-
1) Preparation of satellite data
2) Land use Land cover classification and Ground truth verification
3) Land use Landcover Change Detection
Figure 2
|
Figure 2 Flow chart of methodology |
5. RESULT AND DISCUSSIONS
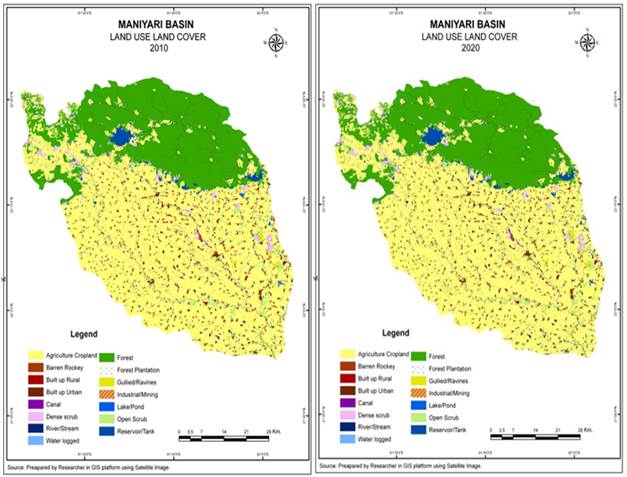
The present study and analysis which presented in Table 1 and Figure 3 Figure 4 shows that there is a drastic change of Land use and land cover over time from 2010 to 2020.The LULC changes has been seen in three classes firstly agricultural land which has been converted from open forest and open scrub, some open scrub and agriculture land converted to settlement. The causes of changes of open forest and open scrub to agriculture land that is the facility of irrigation and as well as increase the man land ratio.
The cultivated land which are used for paddy, vegetables, sugarcane, and other mixed varieties are increased, in the year 2020 it is 251 ha and. In year 2020 built up area was increased 50 ha approximately whereas scrubland has decrease 171 ha in the year 2020. Reservoir or tank area also decreases because of agricultural activity. Settlement mainly encroaches over the cultivation land and open scrub. Figure 3 shows the Land use/land cover map respectively year 2010 and 2020 and change analysis also given in Table 1
Figure 3
|
Figure 3 Land use Land cover map for the time frame 2010 and 2020 |
The present study area which contains amarkantak biosphere reserve, outer open forest of amarkantak biosphere reserve has been highly affected by soil erosion, gully, and ravenous erosion as well as sheet erosion has also demarcated in the study area. It has also been found that the agriculture portion under forest area converted in to agricultural by the local tribal people, some small pond/tank also be found in 2020.The outer portion of reservoir has been converted seasonally into agriculture due to availability of water, some of the places this was permanently converted into agriculture in 2020.
In 2020 the population density of the basin increase 38.29 percent which means the man land ration also increase so the built-up land which encroach or occupied the scrubland and agricultural land surrounding village or City. And so many small lands use transformation has been seen over the area heterogeneously but still the management of land use regarding wetland and land degradation is happened. Ground truth has proven the relevant transformation.
Table 2
|
Table 2 Land use Land cover for the time frame 2010 and 2020 |
||||
|
Sl.
No. |
LULC
Classes |
Area
(2010) |
Area
(2020) |
Changes |
|
1 |
Agriculture
Cropland |
228279.57 |
228495.46 |
215.89 |
|
2 |
Forest |
105265.1 |
105154.78 |
-110.32 |
|
3 |
Open
Scrub |
12486.37 |
12314.9 |
-171.47 |
|
4 |
Built
up |
11082.46 |
11128.59 |
46.13 |
|
5 |
Dense
scrub |
7192.3 |
7152.33 |
-39.97 |
|
6 |
Lake/Pond |
5506.2 |
5485.31 |
-20.89 |
|
7 |
Reservoir/Tank |
3916.4 |
4099.21 |
182.81 |
|
8 |
River/Stream |
2870.25 |
2869.73 |
-0.51 |
|
9 |
Gullied/Ravines |
618.85 |
769.85 |
151 |
|
10 |
Canal |
666.46 |
715.46 |
49 |
|
11 |
Built
up Urban |
646.72 |
686.06 |
39.34 |
|
12 |
Barren
Rocky |
404.43 |
404.43 |
0 |
|
13 |
Industrial/Mining |
356.68 |
366.52 |
9.84 |
|
14 |
Forest
Plantation |
84.11 |
34.11 |
-50 |
|
15 |
Waterlogged |
24.34 |
23.49 |
-0.85 |
|
Total
Area |
379400.24 |
379500.24 |
- |
|
Ground truth verification has been conducted for accuracy assessment, the area which has been not properly interpret by satellite image as well as topographical sheet that’s has been identify through high resolution imageries and field survey. There was approximate 170 ground truth point has been collected through GPS. Some of the glimpse has been shown below the Figure 4
Figure 4
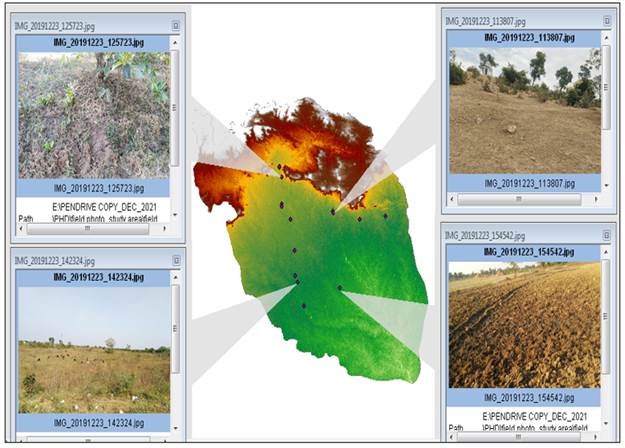
|
Figure 4 Land use Land cover map for the time frame 2010 and 2020 |
Table 3
|
Table 3 Cross section table
for Land Transformation |
|||||||||||||||||
|
|
2020 |
||||||||||||||||
|
2010 |
Row/ Labels |
Agriculture |
Barren rocky |
Built up
Rural |
Built up
Urban |
Canal |
Dense scrub |
Forest |
Forest
Plantation |
Gullied/Ravines |
Industrial/Mining |
Lake/Pond |
Open Scrub |
Reservoir/Tank |
River |
Water
logged |
Grand Total |
|
Agriculture
|
228065.6 |
|
39.40 |
30.35 |
|
|
|
|
|
2.52 |
32.59 |
17.49 |
91.56 |
|
|
228279.57 |
|
|
Barren
Rocky |
|
404.4 |
|
|
|
|
|
|
|
|
|
|
|
|
|
404.43 |
|
|
Built
up Rural |
|
|
11082.46 |
|
|
|
|
|
|
|
|
|
|
|
|
11082.46 |
|
|
Built
up Urban |
|
|
|
646.72 |
|
|
|
|
|
|
|
|
|
|
|
646.72 |
|
|
Canal |
|
|
|
|
666.46 |
|
|
|
|
|
|
|
|
|
|
666.46 |
|
|
Dense
scrub |
23.87 |
|
|
1.91 |
|
7152.33 |
|
|
|
1.15 |
13.04 |
|
|
|
|
7192.30 |
|
|
Forest |
98.04 |
|
|
|
|
|
105154.7 |
|
|
|
11.28 |
|
1.01 |
|
|
105265.10 |
|
|
Forest
Plantation |
|
|
|
|
|
|
|
84.11 |
|
|
|
|
|
|
|
84.11 |
|
|
Gullied/Ravines |
|
|
|
|
|
|
|
|
668.85 |
|
|
|
|
|
|
668.85 |
|
|
Industrial/Mining |
|
|
|
|
|
|
|
|
|
356.6 |
|
|
|
|
|
356.6 |
|
|
Lake/Pond |
|
|
|
|
|
|
|
|
|
|
5400.49 |
|
105.70 |
|
|
5506.20 |
|
|
Open
Scrub |
144.49 |
|
6.73 |
7.09 |
|
|
|
|
|
6.17 |
27.06 |
12284.1 |
10.70 |
|
|
12486.37 |
|
|
Reservoir/Tank |
13.40 |
|
|
|
|
|
|
|
|
|
|
13.28 |
3889.72 |
|
|
3916.40 |
|
|
River/Stream |
|
|
|
|
|
|
|
|
|
|
|
|
0.51 |
2869.73 |
|
2870.25 |
|
|
Water
logged |
|
|
|
|
|
|
|
|
|
|
0.85 |
|
|
|
23.49 |
24.34 |
|
|
Grand
Total |
228495.46 |
404.43 |
11128.59 |
686.06 |
666.46 |
7152.33 |
105154.7 |
84.11 |
668.85 |
366.52 |
5485.31 |
12314.90 |
4099.21 |
2869.73 |
23.49 |
379450.2 |
|
6. CONCLUSION
The study area is an ideal land scape unit which has unique terrain characteristics which include hilly, plateau, plain area. The junction of plain and plateau also suffer soil erosion due to high degree of slope whereas upper basin amarkantak plateau and hilly area suffered by land degradation that’s why the agriculture practice has been affected but its ultimate total agriculture gross crop area has been increased. and also, this land scape the present study demonstrates the application Geographic Information Technology technique to analyse the change detection in Land use Landcover by using satellite image of year 2011and 2020. In the present study agriculture and scrub land is converted in to built-up. It increases 90 ha. in the year 2020. Agricultural land in the study area has been increased 250 ha in year 2020, due to the encroachment of forest and scrub land. Land degradation and soil erosion has been found which impact the soil texture and fertility. Therefore, Sustainable Land uses land cover planning management is needed to reduce the undesired impacts on environment.
Acknowledgement
Authors are highly thankful to the Chhattisgarh Council of Science and Technology (CGCOST) Raipur for providing technical support research work. Also express sincere thanks to all Professor of S.o.S in Geography, Pt Ravishankar Shukla University, Raipur for their help and encouragement to carried-out this work.
REFERENCES
Ahmad, F. (2012). Detection of change in vegetation covers using multi-spectral and multi-temporal information for District Sargodha, Pakistan. Sociedade Natureza, 24, 557-572. https://doi.org/10.1590/S1982-45132012000300014
Ashraf, A. (2013). Changing Hydrology of the Himalayan Watershed. Current Perspectives in Contaminant Hydrology and Water Resources Sustainability. Intech, Islamabad. https://doi.org/10.5772/54492
Ashraf, M. Kahlown, M. A. Ashfaq, A. (2007). Impact of small dams on agriculture and roundwater development : a case study from Pakistan. Agric. Water Manage. 92, 90-98. https://doi.org/10.1016/j.agwat.2007.05.007
Butt, A. Ahmad, S.S. and Aziz, N. (2015). Land use change mapping and analysis using Remote Sensing and GIS : A case study of Simly watershed, Islamabad, Pakistan, The Egyptian Journal of Remote Sensing and Space Science, 1-10. https://doi.org/10.1016/j.ejrs.2015.07.003
Caruso, G. Rounsevell, M. D. A. Cojacarus, G. (2005). Exploring a spatiodynamic neighborhood-based model of residential behaviour in the Brussels peri-urban area. Int. J. Geograph. Inf. Sci. 19, 103- 123. https://doi.org/10.1080/13658810410001713371
Dietzel, C. Herold, M. Hemphill, J. J. Clarke, K.C. (2005). Spatialtemporal dynamics in California's central Valley : empirical links to urban theory. Int. J. Geograph. Inf. Sci. 19, 175-195. https://doi.org/10.1080/13658810410001713407
Fortin, M. J. Boots, B. Csillag, F. Remmel, T. K. (2003). On the role of spatial stochastic models in understanding landscape indices in ecology. Oikos 102, 203-212. https://doi.org/10.1034/j.1600-0706.2003.12447.x
Gajbhiye, S. Sharma, S. K. (2012). Land use and land cover change detection of Indra river watershed through remote sensing using multi-temporal satellite data. Int. J. Geomatics Geosci. 3, 89-96.
Khan, R. and Jhariya, D. C. (2016). Land Use Land Cover Change Detection Using Remote Sensing and Geographic Information System in Raipur Municipal Corporation Area, Chhattisgarh, International Journal of Geo Science and Geo Informatics, 3(1), 1-04.
NRSC, (2019). Natural Resource Census Land Use / Land Cover Analysis- Third Cycle, Hyderabad.
Ozesmi, S. L. Bauer, M. E. (2002). Satellite remote sensing of wetlands. Wetlands Ecol. Manage, 10, 381-402. https://doi.org/10.1023/A:1020908432489
Roy, P. S. and Roy, A. (2010). Land use and land cover change in India : A remote sensing & GIS perspective, Journal of the Indian Institute of Science, 9(4), 489- 502.
Skole, D. and Tucker, C. (1993). Tropical deforestation and habitat fragmentation in the amazon : a Satellite data from 1978 to 1998, Science, 260, 1905-1910. https://doi.org/10.1126/science.260.5116.1905
Stewart, T. J. Janssen, R. van Herwijnen, M. (2004). A genetic algorithm approach to multiobjective land use planning. Comput. Oper. Res. 31, 2293-2313. https://doi.org/10.1016/S0305-0548(03)00188-6
 This work is licensed under a: Creative Commons Attribution 4.0 International License
© Granthaalayah 2014-2022. All Rights Reserved.