Detecting and Displaying Energy from Skin Cancer Lesions Comparison of Post Biopsy Skin Cancer Scabs with Normal Skin Injury Scabs. A Biophysics Approach
Abraham A. Embi 1 ![]()
![]()
1 BS MBA,13442 SW 102 Lane Miami, 33186,
Florida, United States
|
|
|
ABSTRACT |
|
|
The purpose of this manuscript is to introduce via an established tabletop microscopy technique a comparison between electromagnetic energy (EMR) emitted by skin squamous cell carcinoma (SCC) tumors scab tissue and their normal counterparts. The same methodology was used for both groups. Mature scab samples of post biopsy SCC lesions and normal skin scabs were exposed to liquid Potassium Ferricyanide (K3Fe) on a glass slide. K3Fe has the
property of “full absorption” of incoming EMRs there is a temporary delay in the advancing
evaporation while forming crystals
resembling periodic organized semicircles delineate the incoming energy.
Living tissue, whether normal or diseased has metabolism that entails
electron transfers in both plants (photosynthesis) and animals (cellular
respiration) involving movement of electrons from donor to acceptor along the
electron transfer chain thus inducing a current within each cell and from cell to cell. This energy is
totally absorbed by K3Fe crystals. In Vitro experiments are presented showing
disrupted energy emitted
by SCC scabs failing short
of reaching the tissue sample; a visual “Gap” in EMR was documented in both
SCC samples. Conversely in scabs from normal tissue no “Gap” in continuity
was seen. Based on results from duplicate experiments supports erratic EMR
emissions from SCC scabs when compared with normal tissue scabs.
Additionally, small-detached cancer scabs fragments demonstrated energy
emissions not seen in normal tissue. |
|||
|
Received 10 May 2022 Accepted 15 June 2022 Published 30 June 2022 Corresponding Author Abraham
A. Embi, DOI 10.29121/granthaalayah.v10.i6.2022.4627 Funding: This research
received no specific grant from any funding agency in the public, commercial,
or not-for-profit sectors. Copyright: © 2022 The
Author(s). This work is licensed under a Creative Commons
Attribution 4.0 International License. With the
license CC-BY, authors retain the copyright, allowing anyone to download,
reuse, re-print, modify, distribute, and/or copy their contribution. The work
must be properly attributed to its author.
|
|||
|
Keywords: Cancer Tissue Energy, Tissue
Electromagnetic Energy, Post Biopsy Tissue, Skin Scabs, Squamous Cell
Carcinoma, Anisotropy DEFINITIONS OF TERMS Anisotropy: “(of an
object or substance) having a physical property that has a different value when measured in different directions. A simple example is wood,
which is stronger along the grain than across it”. (Oxford Dictionary). EMR: Electromagnetic Radiation. K3Fe: Acronym
for Potassium Ferricyanide K₃ [Fe (CN)₆].
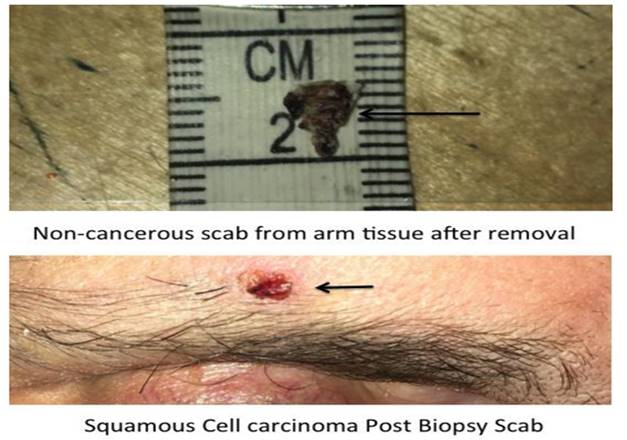
crystals. Scab: Protective tissue covering those forms after your
skin has been damaged as shown in Figure 1 SCC: Squamous Cell Carcinoma. SSP: Single Slide
Preparation. Sample placed
in center of glass slide and covered by two drops K3Fe.
Allowed to evaporate (REF X |
|||
1. INTRODUCTION
This manuscript introduces a comparison of electromagnetic energy emitted by similar in size healthy human skin tissue scabs with post biopsy cancer tissue counterparts. Ever since the development in 2015 and introduction in 2016 Scherlag et al. (2016) of a tabletop methodology able to display living plants and animal tissue emission of EMRs; numerous papers were published. They rank form demonstrating properties of living biological tissue EMRs penetrating glass barriers to quantitatively measuring the human hair follicle EMR vertical range. A variety of papers could be obtained by searching Embi AA in Google Scholar A typical normal hair follicle EMR emission patterns is shown below (Exhibit I). Worth noting that the information herein reported is of a qualitative nature, in other words cancer and normal tissue EMR energy are absorbed by the anisotropic K3Fe, and images recorded Figgis et al. (1969)
2. MATERIALS AND METHODS
2.1. MATERIALS
1) Tissue samples. Control post normal skin tissue injury dry scabs (n=2); and post Squamous Cell Carcinoma (SCC) biopsy sites (n=2). Examples in Figure 4 below.
2) 25x75x1mm clean glass slides
3) Potassium Ferricyanide K₃ [Fe (CN)₆]. crystals.
4) Demineralized bottled water
5) Celest Ron Video Microscope Model # 44348
6) MacBook Pro Apple computer with Photo Application software.
2.2. METHODS
Normal skin arm tissue scab was placed on a glass slide containing two drops of liquid K3Fe. This preparation was dubbed a Simple Slide Preparation or SSP. The same approach was used with SCC post biopsy scabs. Images and video recordings during and post evaporation were downloaded onto an Apple computer photo application program for both safekeeping and interpretation.
3. RESULTS
After careful revision of the stored images, the normal skin tissue samples showed a smooth uninterrupted advance of the K3Fe crystallization (Exhibit I). This lack of delay and distortion in crystals formation had been previously seen emitted by undisturbed healthy tissue. On the other hand. changes in tissue metabolism would induce delays and irregular periodic crystals formations Embí (2020)
The images obtained from cancer tissue scabs, show an irregular pattern in crystallization energy (read energy), especially in the immediate edges of the actual sample Figure 1 Small scab tissue fragments from the SCC samples were recorded surrounded by very fine K3Fe filamentous structures (Exhibit II). This could be attributed to an increased energy emission when compared to the normal tissue small tissue fragment (Exhibit II). Duplicate experiments (n=2) in both the cancer and normal tissue scabs irregular EMR emissions are herein reported. As final note the findings presented are qualitative.
4. DISCUSSION
The difference between cancer and normal tissue has been widely described in the literature, for example:
“Cancer cells keep dividing. Cancer cells ignore the body’s signals to stop dividing. Your body has a built-in process, called apoptosis or programmed cell death, that tells the body to get rid of cells it doesn’t need anymore. Normal cells are better at listening: They listen to the body’s cues and stop reproducing when enough cells are present” Bradford (2022)
Another salient characteristic is the increased metabolism of cancer cells when compared normal. The results presented in this manuscript are in support of a concept of cancer cells irregular, as well as increased energy emission Figure 2 as documented by both the interrupted energy emission, and the presence of herein introduced energy emission by sma ll scab tissue fragments adjacent to normal samples. Additionally, there is a void or “gap” in K3Fe large crystals presence in the immediate outer edges of cancer scabs; where in one sample unexplained small tissue fragments detached from the sample are energized.One may ask: Where is the energy stored in tissue scabs? Scabs are mainly composed of a fibrin network, platelets and collagen, previous work by this author described “ENERGY DETECTION IN THE FORM OF LIGHT RADIATION AT END OF HUMAN BLOOD COAGULATION CASCADE” Abraham (2019) It could be theorized that this type of stored energy in the scabs of cancer and normal tissue are detected in the SSPs as presented in this manuscript.
5. MEDICAL IMPLICATIONS
The introduction of a tabletop optical microscopy technique able to display emitted energy by normal and diseased human tissue samples could have implications in medicine, why? Perhaps the effect of drug therapy on tissue energy could be simplified by a table- top microscopy technique.
EXHIBIT 1 Control Experiment I
Undisturbed Normal Hair Follicle Tissue Concentric EMRs Waves Absorbed by the Paramagnetic Potassium Ferricyanide in Solution.
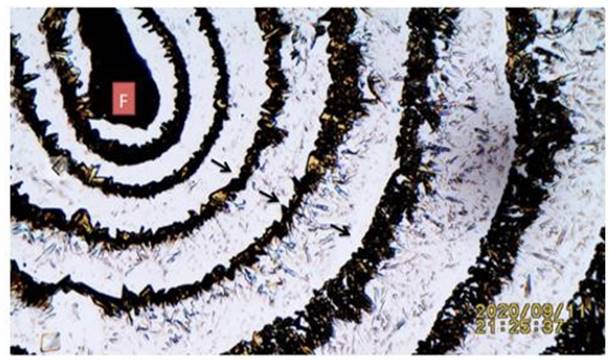
Figure 1
|
Figure 1 Human Hair in SSP K3 Fe after Evaporation Showing F=Follicle Black Arrows Pointing at Organized Concentric K3 Fe Crystallization Due Full Absorption of the Follicle’s EMR Note Reproduced
From: Article Citation: Embí Abrahám A. Bs. (2020). The Drunken Hair:
Introducing In Vivo Demonstration of Increased Blood Alcohol Concentration
Temporary Disrupting Human air Follicles Emission of Electromagnetic
Radiation. International Journal of Research -Granthaalayah, 8(10), 123- 130.
Https://Doi.Org/10.29121/Granthaalayah.V8.I10.2020.1568
|
Isolated Video Frame Showing Interrupted Energy
Emission Near Cancer Tissue
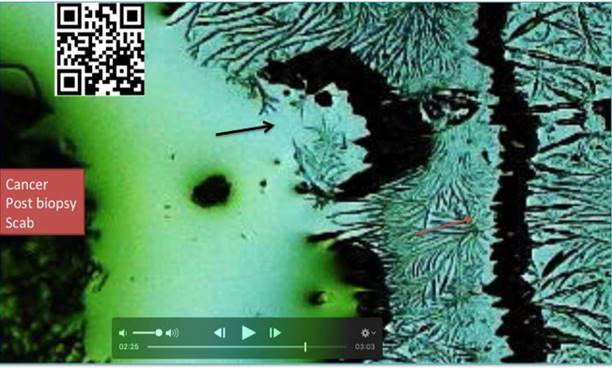
Figure 2
|
Figure 2 Cancer scab in SSP K3Fe showing fractionated EMR emissions near tissue. Black Arrow: Fragmented energy emission Orange Arrow: Pointing at undisturbed energy emission pattern. For details link to: https://youtu.be/XtDMtXWjfTc ……Or Scan QR Code in image. Compare Orange arrow pattern with Exhibit I EMRs undisturbed pattern |
Cancer vs Normal Very Small Scabs Energy Emissions
EXHIBIT 2
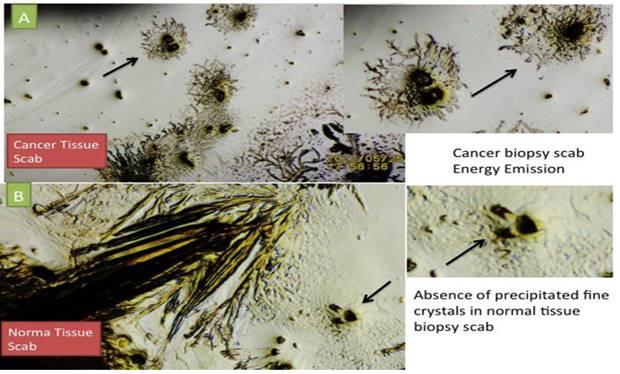
Figure 3
|
Figure 3 Showing A: SCC scab fragment near main scab sample showing very fine K3Fe crystals indicative of energy emission. B: Normal Tissue scab fragment also near main scab sample showing absence of K3Fe crystals emissions. Indicative of a less energetic state |
Additional Cancer Tissue Scab Irregular Energy Emission
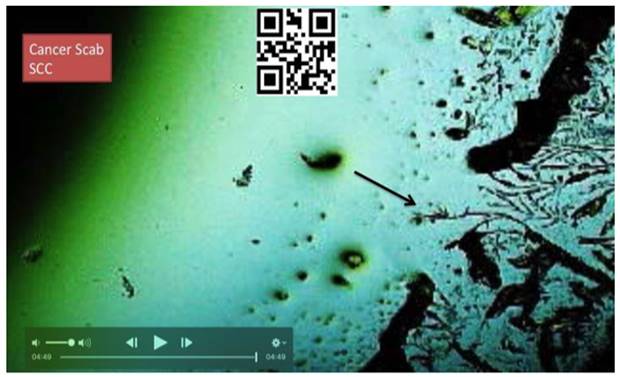
Figure 4
|
Figure 4 SCC post biopsy skin scab in SSP K3Fe showing: Black Arrow: Uneven and fractionated emissions of EMRs as demonstrated by a gap in K3Fe crystals. Please compare to Figure 1 For additional details link to: https://youtu.be/dDTeOYYh9tQ.or Scan QR Code in image |
6. SUPPLEMENTAL MATERIAL
Size of Normal and Cancerous Scabs Selected for this
Manuscript
Figure 5
|
Figure 5 Showing comparable size of healthy and post biopsy squamous skin carcinoma scab |
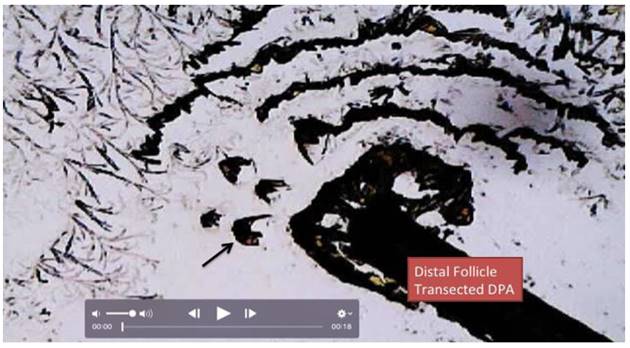
K3Fe Fractionated Energy Emission Pattern from Injured
Distal Hair Follicle Bulb.
Figure 6
|
Figure 6 Black Arrow: Fractionation K3Fe crystallization due to damage to distal follicle dermal papilla. Disturbed energy emission by injury to distal hair. Please compare with Figure 1 in text |
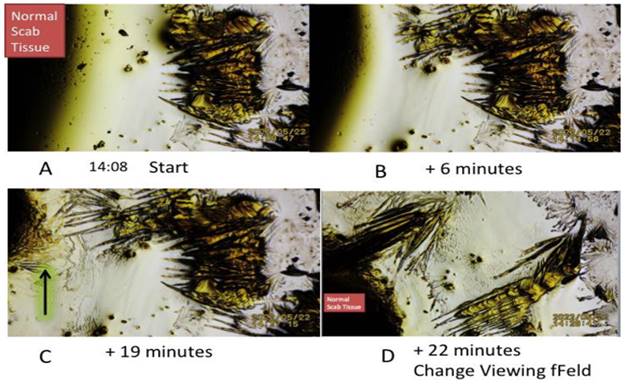
Normal Tissue Uninterrupted Crystallization Pattern Observed
in Two Samples Tested
EXHIBIT 3
Figure 7
|
Figure 7 Sequential images in lieu of video recorded every 3 minutes of the uninterrupted advance of K3Fe crystallization from a normal scab tissue sample |
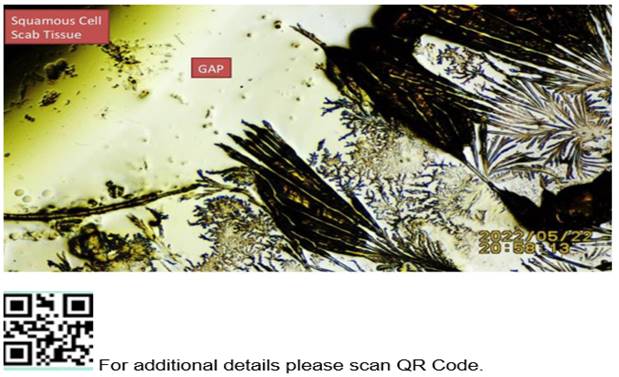
Cancer Tissue Scab Interrupted Crystallization Pattern;
The Gap
Figure 8
|
Figure 8 Amplified
image in figure showing scab tissue fragment of SCC showing interrupted K3Fe
crystals advance towards (cancer scab) Please compare with S3 where the
crystals reach the scab tissue. |
CONFLICT OF INTERESTS
None.
ACKNOWLEDGMENTS
None.
REFERENCES
Abraham A. (2019). Energy Detection in The Form of Light Radiation At End of Human Blood Coagulation Cascade- The Optical Absorption of Water Vs. Fibrin Burst Energy Release. International Journal of Research - Granthaalayah, 7(9), 200-212.
Bradford, T. M. (2022). Cancer Treatment Centers of America.
Embi, A. A. (n.d.). Google Scholar Citations.
Embí A. B. S. (2020). The Drunken Hair : Introducing in Vivo Demonstration of Increased Blood Alcohol Concentration Temporary Disrupting Human Hair Follicles Emission of Electromagnetic Radiation. International Journal Of Research -Granthaalayah, 8(10), 123-130. https://doi.org/10.29121/granthaalayah.v8.i10.2020.1568
Figgis, B. N. Gerloch, M. Mason, R and Sydney, R. (1969). Nyholm the crystallography and paramagnetic anisotropy of potassium ferricyanide. https://doi.org/10.1098/rspa.1969.0031
Scherlag, B. J. Sahoo, K. Embi, A. A. (2016). Novel and Simplified Method for Imaging the Electromagnetic Energy in Plant and Animal Tissue. Journal of Nanoscience and Nanoengineering. 2(1), 6-9.
 This work is licensed under a: Creative Commons Attribution 4.0 International License
© Granthaalayah 2014-2022. All Rights Reserved.