OVERALL OBESITY AND OVERWEIGHT, TREND FROM 2016 TO 2022 WITH A FORECAST FOR 3 YEARS AHEAD IN EASTERN LIBYA
Tawfeg A. Elhisadi 1![]()
1 Department of Public Health, Branch of
Nutrition, College of Medical Technology, Derna, Libya
|
|
|
ABSTRACT |
|
|
The article
investigates the prevalence of obesity among Libyan's women aged from 15 to
59 age years. The study estimated trends between 2016 and 2022 in overweight
and obesity prevalence A total of 1288 women were included in the analysis,
of which 662 (51.4%) were aged 15-30 years old and 626 (48.6%) were aged
31-59 years old recruited from 2016 to 2022. The sample was divided into two
groups, group 1- female age from 15-30 years and group 2- female age 31-59
years. Between 2016 and 2022, the prevalence of obesity increased 10.4%,
whereas there were increases forecast up to 2025 increased 10.3%. The study
shown that body weight, body fat, waist circumference, visceral fat, and body
mass index increase with aging except of fat free mass, decreased with aging.
Women with higher age have higher chances of being obesity and lower chances
of being underweight compared with lower age. The results from our study
showed that the prevalence of obesity continues to rise, with age increased,
with 10.3% increases occurring in the forecast next three year's 2023-2025.
The results showed that the risk of gaining overweight and obesity starts at
the age of 31 years. |
|||
|
Received 05 May 2022 Accepted 08 June 2022 Published 29 June 2022 Corresponding Author Tawfeg A.
Elhisadi, drelhisadi@yahoo.com DOI 10.29121/granthaalayah.v10.i6.2022.4599 Funding: This research
received no specific grant from any funding agency in the public, commercial,
or not-for-profit sectors. Copyright: © 2022 The
Author(s). This work is licensed under a Creative Commons
Attribution 4.0 International License. With the
license CC-BY, authors retain the copyright, allowing anyone to download,
reuse, re-print, modify, distribute, and/or copy their contribution. The work
must be properly attributed to its author.
|
|||
|
Keywords: Weight, Height, BMI, Waist Circumference,
Libyan's Women |
|||
1. INTRODUCTION
Across the world, obesity rates have increased in the last two decades in nearly all age groups. By 2025, it is estimated that 2.7 billion adults and 268 million school-age children will be overweight or obese. According to the World Health Organization (2016), there are around 2 billion adults overweight, of those 650 million are considered to be affected by obesity (BMI ≥30 kg/m²). That equates to 39% (39% of men and 40% of women) of adults aged 18 or over who were overweight, with 13% obese. The worldwide prevalence of obesity nearly tripled between 1975 and 2016. It is estimated now that most of the world's population live in countries where overweight and obesity kills more people than underweight.
According to statistics from the WHO, Kuwait ranks 9th in the world and first amongst Arabic-speaking countries in female obesity. The rank order in Arabic-speaking countries for obesity in females is Kuwait (55.2%), Egypt (48%), and UAE (42%). Badran and Laher (2011)
We estimated trends between 2016 and 2022 in overweight and obesity prevalence and their uncertainty for Libyan's Women aged 15-59 years. Excess bodyweight is well known for increasing the risk of having a stroke or getting heart disease, of developing diabetes, of liver disorders and certain cancers. It also leads to orthopedic problems with joints and back pain.
The purpose of this study was to prevalence of obesity during prove the differences in body composition between women aged 15-30 and 31-59 years old, respectively to prove whether the age has an impact on body composition on women, and forecast up to next three years (2023,2024, and 2025)
2. PURPOSE OF THE STUDY
Due to lack of anthropometric data of obesity among Libyan's women aged 15 to 59 years, and WHO (2008) this study is the first documentation of the forecast prevalence of obesity among women in Derna and the surrounding area. It was initiate to:
· Present data that can serve as a growth reference for local studies.
· Assess the growth pattern and nutritional status of women by using anthropometric indices of height, weight, BMI, Fat Free Mass (FFM), Body Fat (BF), and waist circumference (central obesity), with age.
· Investigate the prevalence of overweight, and obesity among Libyan's women aged 15-59 years. The study adopt a survey research design in which the main data collection.
· This study was to prove the differences in body composition between women aged 15-30 and 31-59 years old, respectively to prove whether the age has an impact on body composition on women.
3. MATERIAL AND METHODS
The study was conducted between 2016–2022. The analysis sample included nonpregnant women aged from 15-59 years. The age of the respondent was grouped into two categories; group1 aged from 15-30 years and group 2 aged from 31-59 years. Cross sectional data conducted in outpatient department (OPD) in Derna city and surrounding area were used for this study.
The survey used a clustered design to obtain a representative sample (n = 1288) from randomly selected areas. All women of reproductive age (15–59 years) were selected for interview and were asked to participate in the survey. Bioelectrical Impedance Analysis (BIA) was used in this study because it is easy, quick, painless test and cost-effective. Anthropometric measurements, by use high quality OMRON Body Composition Monitor, BF 511Body Composition Monitor, apparatus by the bioelectrical impedance method (BIA), based on the assumption that the electrical resistance is greater in adipose tissue, with this medical device will be able to precisely measure the following composition parameters and immediately interpret the results. The unique OMRON 8-sensor technology using both hands and feet provides one of the most accurate methods of entire body measurements. All participants underwent body composition analysis in the morning and wearing light indoor clothes.
· Weight (kg): Subject is weigh on electronic scale without shoes in single layer of indoor clothing; each subject is measure to 100 grams, to minimize error. Weighing scales is check before each session as the unloaded scale registers zero. The OMRON body composition can weigh person up to 150 kg.
· Height (cm): Height measure to the nearest 0.1 cm with a portable stadiometer. For measuring height, fixed a calibrate ruler to the wall. The subject stand straight, bare footed with heels with their back, heads and shoulder touching the ruler. The horizontal indicator of the stadiometer is then lowers until it is firmly touching the peak of the head. Height is measure in centimeters and later convert to meters.
· Body Mass Index (BMI= kg/m2): The BMI ranges are based on the effect excessive body fat has on disease and death and are reasonably well related to adiposity. Body Mass Index (BMI) is a person's weight in kilograms divided by the square of height in meters. A high BMI can be an indicator of high body fatness. BMI can be used as a screening tool but is not diagnostic of the body fatness or health of an individual. BMI was developed as a risk indicator of disease; as BMI increases, so does the risk for some diseases. Some common conditions related to overweight, and obesity include premature death, cardiovascular diseases, high blood pressure, osteoarthritis, some cancers, and diabetes. The following cut-offs were used: underweight (BMI≤ 18.5 kg/m2), normal BMI (18.5-24.9 kg/m2), overweight BMI (25.0- 29.9 kg/m2) and obesity BMI ≥ 30.0 kg/m2)
· Muscle (FFM): Muscle is divided into two types, muscle in internal organs, such as the heart, and skeletal muscle attached to the bones that is used to move the body, skeletal muscle can be increased through exercise and other activity. Increasing the ratio of skeletal muscle means that body can burn energy more easily, which means that it is less likely to burn to fat, and makes it easier to lead energetic lifestyle
· Body Fat (BF): Body fat percentage refers to the amount of body fat mass to the total body weight expressed as a percentage.
Body fat percentage (%) = {Body fat mass (kg) / body weight (kg)} *100
Visceral Fat (up to 30 level)
Waist circumference (WC): Waist circumference should be measured at the midpoint between the lower margin of the least
palpable rib and the top of the iliac crest. WC was measured using a non-elastic, flexible measuring tape. The definition of ‘raised waist circumference’ is more than 102cm for men and more than 88cm for women.
4. SIGNIFICANCE OF THE STUDY
The prevalence of obesity among women, which will be significant as:
· It will help the women and the other member of the society to adopt healthy lifestyle.
· It will help the nation to minimize obesity and thus helps in reducing chronic illness.
5. RESEARCH METHODOLOGY
· Study design: a descriptive cross-sectional study.
· Study area: Derna city and surrounding area.
· Study population: Libyan's women between the age group of 15-59 years.
· Only the women giving consent and willing to participate will be included.
· Tools and techniques of data collection: data will be collected by interview and measurement.
· Weighing scale and measuring tape will be used to calculate BMI.
6. STATISTICAL ANALYSIS
Data analysis was performed with Statistical Packages for the Social Sciences (SPSS), version 26.0, PC windows is use for data analysis. Mean, median and standard deviation (SD) of the anthropometric data obtain from 15-59 years-old women is calculate for each age group. The descriptive statistics and Χ2 test is used to assess the association between categorical variables. A p -value of ≤0.05 is the criterion of statistical significant. The age group is defined as 15-30 years and 31-59 years. Using z test to compare the two proportions of obese women for the ages from 15-30 years old and 31-59 years old the p value was 0.000 is less than 0.05, we can say the difference between the two proportions is highly significant towards the 31-59 years old women. Values are presented as mean ± standard deviation (SD), unless otherwise stated. Prevalence of overweight and obesity were estimated using WHO international criteria for BMI classification.
7. RESULTS AND DISCUSSIONS
A total of 1288 women were included in the analysis, of which 662 (51.4%) were aged 15-30 years old and 626 (48.6%) were aged 31-59 years old recruited from 2016 to 2022. The sample was divided into two groups, group 1- female age from 15-30 years and group 2- female age 31-59 years. The parameters of the body composition applied in this research were: age (years), height (cm), body mass index (BMI), fat free mass (% FFM), fat mass (% FM), Visceral Fat (%VF), and Waist Circumference (WC "cm"). All anthropometry data showed in Table 1 and Table 2 In the present study, prevalence of overweight in the study population was 15.1% and obesity 70.0% at two groups. Overweight and obesity were significantly associated with age increased as shown in Table 3 and Table 4 Waist circumference among women aged 15-30 years was lower than group 2, 85.5 cm (±18.8) and 100.5 (± 15.5) respectively. Comparisons between the characteristics of women aged 15-30 years (group1) and women aged 31-59 years (group 2) groups clearly showed that the anthropometric indices for group 2 was higher.
Table 1
|
Table 1 Anthropometry and body composition from 2014 to 2020 of the participants” aged 15-30 years |
||||||||
|
Parameter |
Women aged 31-59 years |
|||||||
|
2016 |
2017 |
2018 |
2019 |
2020 |
2021 |
2022 |
Mean |
|
|
Age |
22.75 |
22.9 |
22.8 |
24.1 |
22.7 |
23.22 |
24.22 |
35.34 |
|
Weight |
72.79 |
77.2 |
77.71 |
80.62 |
81.49 |
79.95 |
76.97 |
79.1 |
|
Height |
158.91 |
158.67 |
159.92 |
159.07 |
159.68 |
158.88 |
159.69 |
159.26 |
|
BMI |
30.53 |
29.59 |
29.93 |
31.35 |
21.2 |
31.33 |
29.44 |
29.05 |
|
FFM |
23.99 |
23.58 |
24.92 |
23.55 |
23.55 |
22.57 |
22.8 |
23.56 |
|
FAT |
41.24 |
43.44 |
42.33 |
44.45 |
44.27 |
44.51 |
43.02 |
43.32 |
|
VF |
5.53 |
6.11 |
6.28 |
6.11 |
6.42 |
6.23 |
6 |
6.1 |
|
WC |
86.58 |
89.69 |
89 |
90.31 |
91.54 |
89.91 |
85.25 |
88.9 |
Table 2
|
Table 2 Anthropometry and body composition from 2014 to 2020 of the participants” aged 31-59 year |
||||||||
|
Parameter |
Women aged 15-30 years |
|||||||
|
2016 |
2017 |
2018 |
2019 |
2020 |
2021 |
2022 |
Mean |
|
|
Ag |
41.77 |
42.65 |
39.95 |
39.39 |
40.22 |
42.32 |
41.03 |
41.05 |
|
Weight |
93.05 |
88.08 |
91.61 |
92.2 |
89.58 |
89.65 |
89.87 |
90.58 |
|
Height |
158.91 |
160.12 |
161.3 |
160.93 |
161.53 |
160.63 |
161.47 |
160.7 |
|
BMI |
36.51 |
35.12 |
35.83 |
36.71 |
35.18 |
35.77 |
35.22 |
35.76 |
|
FFM |
21.97 |
24.32 |
22.51 |
21.51 |
21.77 |
20.56 |
21.7 |
22.05 |
|
Fat |
49.16 |
48.01 |
48.37 |
50.31 |
49.54 |
49.73 |
49.6 |
49.25 |
|
VF |
10.42 |
10.28 |
9.85 |
10.17 |
9.86 |
10.29 |
10 |
10.12 |
|
WC |
105.95 |
99.72 |
103.8 |
105.23 |
103.73 |
101.77 |
100.4 |
102.94 |
Table 3
|
Table 3 Distribution of BMI associated with age |
|||||
|
Age (years) |
BMI (kg/m2) |
Total |
|||
|
<18.5 |
18.5-24.9 |
25-29.9 |
>30 |
||
|
15-30 |
63
(4.9%) |
92
(7.1%) |
122
(9.5%) |
385
(29.9%) |
662
(51.4%) |
|
31-59 |
6
(0.5%) |
32
(2.5%) |
72
(5.6%) |
516
(40.1%) |
626
(48.6%) |
|
Total |
69
(5.4%) |
124
(9.6%) |
194
(15.1%) |
901
(70.0%) |
1288
(100%) |
Table 4
|
Table 4 Prevalence of obese and not obese among women aged 15-59 years old from 2016-2022 |
|||
|
Age (years) |
Obese |
Not obese |
Total |
|
15-30 |
385
(29.9%) |
277
(21.5%) |
662
(51.4%) |
|
31-59 |
516
(40.1%) |
110
(8.5%) |
626
(48.6%) |
|
Total |
901
(70.0%) |
387
(30.0%) |
1288
(100%) |
Studies in a variety of countries have shown increases in the prevalence of overweight and obesity among women in recent years. In its simplest sense, the body gains fat when it stores excess energy, and this excess energy arises from consuming more food energy than is burnt in physiological metabolism. in some cases, it may be a genetic disorder but, in most cases, it arises from living in an environment that allows and encourages low levels of physical activity, extended sedentary behaviour and plentiful consumption of food, especially food rich in energy (e.g., in the form of fats, oils, and sugars). This study was conducted in order to investigate and confirm the difference between women aged 15-30 and 31-259 years and forecast up to 2025. Our results have shown that body weight, body fat, waist circumference, visceral fat, and BMI increase with aging and on the other side the percent of fat free mass, decrease with aging, especially with group 2, as shown in Figure 1 Generally, lower FFM among women with group 2 leads to a decrease in metabolism rate and increase the obesity. Low FFM has been related to high mortality in patients Bigaard et al. (2004)
Figure 1
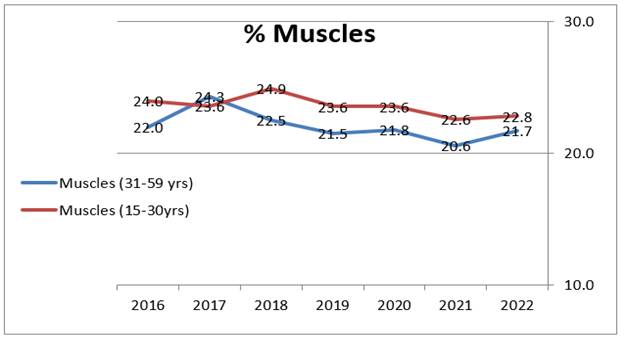
|
Figure 1 The relationship between % FFM according to age groups category |
The prevalence of obesity was 29.9% among adults aged 15 to 30 years (group 1), and 40.1% among adults aged 31 and older (group 2), and not obese 21.4% and 8.5% among women group 1 and group 2 respectively, as shown in Figure 2
Figure 2
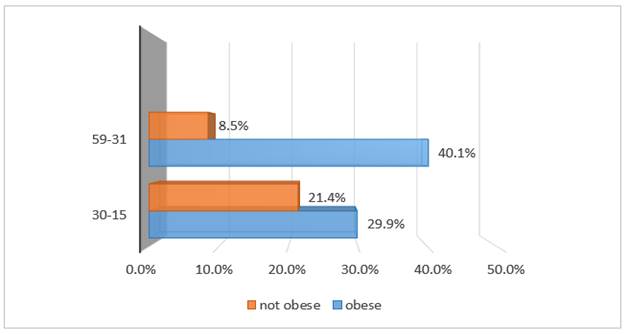
|
Figure 2 The prevelance of obese and not obese among two groups catagories |
While 0.5% and 4.9% underweight among group 2 and group 1 respectively. Raised BMI is a major risk factor for noncommunicable diseases, Heavier BMIs with increasing age is known as the obesity paradox in older women. Obesity are based on excessive fat storage characterized by body mass index (BMI), sharp increases in group 2 as shown in Figure 3 Changes in body weight and BMI are strongly related to changes in fat‐free mas
Figure 3
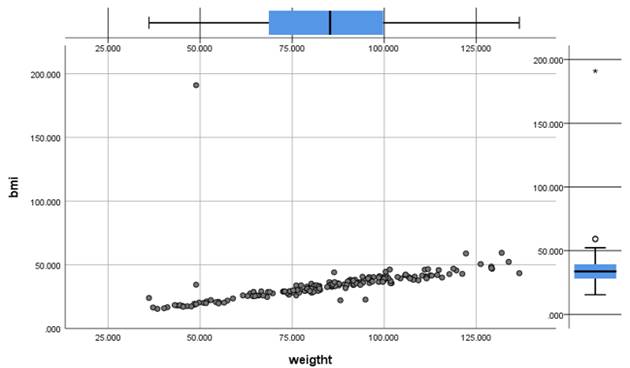
|
Figure 3 The association between weight and BMI according to age |
Low weight for height BMI ≤ 18.5 was higher among group 1, unhealthy underweight causes fatigue, illness, and bone fractures. Prevalence of underweight among women group 1 has been well documented in this study. There are important age differences in the prevalence of underweight and obesity among women's population in Libya, women with higher age have higher chances of being obesity and lower chances of being underweight compared with lower age. The age played an important role in percent of BF as shown in Figure 4
Figure 4
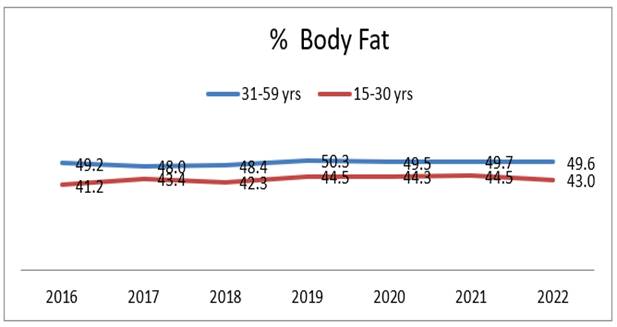
|
Figure 4 Prevalence of % BF associated with age between two group |
The study showed that the visceral fat (VF) for women group 2 was higher than group 1 as shown in Figure 5 lipolysis of visceral adipose tissue leads to increased portal free fatty acid (FFA) that stimulate hepatic very low-density lipoprotein (VLDL) secretion, activate gluconeogenesis, and inhibit hepatic uptake of insulin Björntorp (1990) Visceral adipose tissue could also be responsible for many of the metabolic abnormalities associated with abdominal obesity.
Figure 5
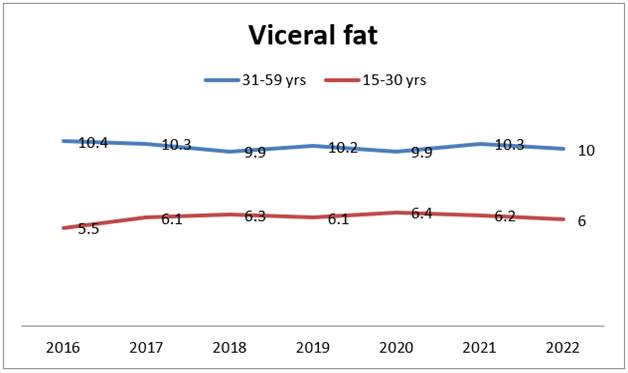
|
Figure 5 Prevalence of VF associated with age between two groups |
Waist Circumference (WC)) appears to be more strongly associated with the risk of type 2 diabetes, cardiovascular disease, and mortality than anthropometric measures of general fatness e.g., BMI Ross et al. (2008) Data from NHANES show that waist circumference increases with age and is larger in older than in younger adults of both sexes up to the age of 70 years. (4). Our study revealed that group 2 had higher WC than group 1 as shown in Figure 6 Since waist circumference correlates more closely with abdominal adipose tissue than BMI. Data from most of the cross-sectional studies suggested that waist circumference or waist–hip ratio are better indicators than BMI of the risk of diabetes Bixby et al. (2019)
Figure 6
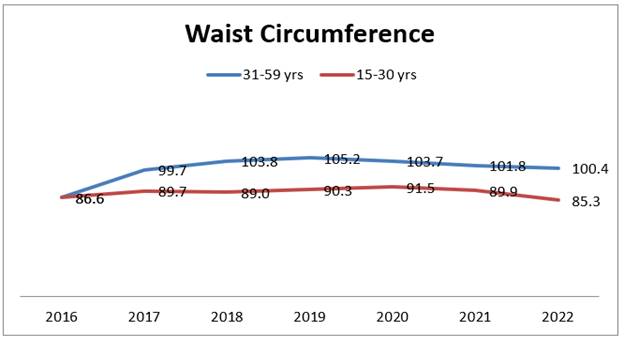
|
Figure 6 Prevalence of WC associated with age between two group |
Between 2016 and 2022, the prevalence of obesity increased 10.4%, whereas there were increases forecast up to 2025 increased 10.3%. Between 2016 and 2022, increases in the prevalence rate for the obese category (BMI ≥ 30.0) were reported for women aged 31-59 years (40.1%), there was a higher reported prevalence of women aged 15-30 years in the obese categories (29.9%). Increases in prevalence were reported for women aged 15-30 for the obese category normal (BMI 18.5-24.9), compared with women aged 31-59 years, 7.10-2.50% respectively. Our data showed that the underweight category (BMI≤ 18.5), among women aged 15-30 years and 31-59 years were 4.90% and 0.50% respectively. The results from our analysis showed that the prevalence of obesity continues to rise, with age increased, with 10.3% increases occurring in the forecast next three years as shown in Figure 7
Figure 7
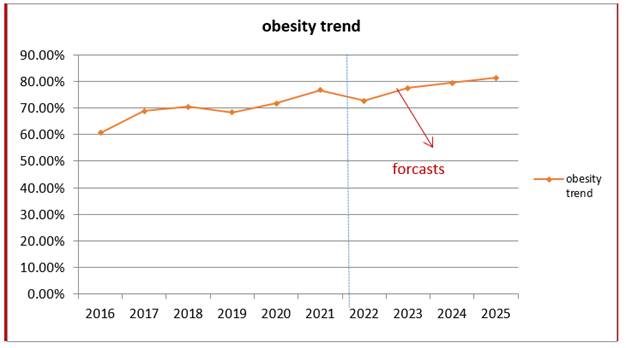
|
Figure 7 Percentage of women aged from 15-59 years old with overweight and obesity trend from 2016 to 2022 with a forecast for 3 years ahead, with continued increases predicted up to 202 |
The prevalence is more profound in the women of age between 31–59 years, due to increasing sedentary lifestyle. Our results have showed that body weight, body fat, visceral fat, and BMI increase with aging and on the other side the percent of muscle tissue decrease with aging. The study showed that FM, VF, and WC progressively increased, and loss of FFM with age. The study revealed that age is one of the factors that affects in worsening of good health, these results agree with the previous study Bixby et al. (2019) Previous research on obesity revealed a higher morbidity and mortality in patients with a low muscle mass and a high fat mass when compared to patients with a high fat mass only Ross et al. (2008)
This study indicates the gravity of the problem of obesity in Libya and provides directions for nutritional planning in the future. including a focus on evaluating existing policies, programs and approaches to the prevention, management, and treatment of obesity. If we look at the difference in muscles and the difference in BF, we see that we have a higher difference during next years. This study revealed that older people (group 2) with the lowest muscle mass index and the highest of BF when compared to other age group. Muscle decreased corresponds to an increase in BF and WC with the next years, which leads to an increase in the rate of obesity as showing in Figure 8 Percent body fat may remain constant or increase with age, but ageing is associated with substantial redistribution of fat tissue among depots Cartwright et al. (2007)
Figure 8
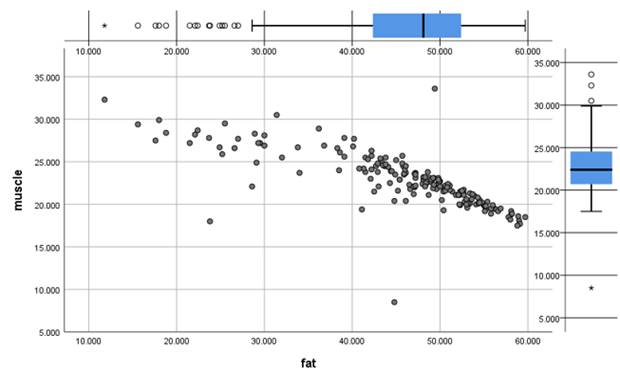
|
Figure 8 Relationship between muscles with BF in Libyan women aged 15-59 year |
Waist alone may be used to indicate adiposity or to reflect metabolic risk factors. Based on an extensive review, Huxly et al. (2010) concluded that there was convincing
evidence that measures of general obesity (e.g., BMI) and measures of abdominal adiposity (e.g., waist circumference, waist–hip ratio and waist- height ratio) are associated with CVD risk factors and incident CVD events Huxly et al. (2010) Women aged 31-50 years had higher values than the other female group. The relationship between height and weight or waist became more positive when increased of age Villareal et al. (2005) we can conclude age has an impact in weight increase. Based on the results, the difference in FM, VF, and WC indicates that in women aged 31-59 years the lifestyle begins to change compared to women aged 15-59 years. The results showed that the risk of gaining overweight and obesity starts at the age of 31 years, which in later periods (age 59 years) can be followed by the appearance of various diseases due to physical inactivity and excessive consumption of energy substances.
8. CONCLUSIONS AND RECOMMENDATION
In this study, the participants was divided into two groups, group 1- female age from 15-30 years and group 2- female age 31-59 years. The study shown that body weight, body fat, waist circumference, visceral fat, and BMI increase with aging except of fat free mass, decreased with aging. The prevalence of overweight and obesity was 15.1% and 70.0% at two groups respectively. Waist circumference among women aged 15-30 years was lower than group 2. Prevalence of underweight among women group 1 has been well documented in this study. the visceral fat (VF) was higher among women group 2 than group 1. Visceral adipose tissue could also be responsible for many of the metabolic abnormalities associated with abdominal obesity. Physical inactivity and excessive consumption of energy substances are the main risk factors for chronic non-communicable diseases, especially over the age 31 years. The results from our analysis showed that the prevalence of obesity continues to rise, with age increased, with 10.3% increases occurring in the forecast next three year's 2023-2025. We need to educate, challenge, and raise awareness in order to halt the growth of obesity in Libya. The benefits of weight loss need to be weighed against the risks in older persons. One clear recommendation is that all weight loss regimens in the elderly need to be coupled with a comprehensive resistance exercise program.
ACKNOWLEDGEMENTS
The authors wish to express their sincere thanks to all volunteers who participated and helped in obtaining these data.
REFERENCES
Badran, M. and Laher, I. (2011). Obesity in Arabic-Speaking Countries ; Review Article ; Hindawi Publishing Corporation Journal of Obesity. https://doi.org/10.1155/2011/686430
Bigaard, J. Frederiksen, K. et al. (2004). Body fat and fat free mass and all cause Mortality, Obesity Research 12(7). https://doi.org/10.1038/oby.2004.131
Bixby, H. Bennett, J. E. Taddei, C. Stevens, G. A. Lotufo, P. A. Manitto, A. M. et al. (2019). Rising rural body-mass index is the main driver of the global obesity epidemic in adults. Nature, 569(7755). https://doi.org/10.1038/s41586-019-1171-x
Björntorp, P. (1990). Portal adipose tissue as a generator of risk factors for cardiovascular disease and diabetes. Arteriosclerosis, 10(4), 493-496. https://doi.org/10.1161/01.ATV.10.4.493
Björntorp, P. (1990). Portal adipose tissue as a generator of risk factors for cardiovascular disease and diabetes. Arteriosclerosis, 10(4), 493-496. https://doi.org/10.1161/01.ATV.10.4.493
Cartwright, M. J. Tchkonia, T. Kirkland, J. L. (2007). Aging in adipocytes : potential impact of inherent, depot specific mechanisms. Experimental Gerontology, 42(6), 463-471. https://doi.org/10.1016/j.exger.2007.03.003
Huxly, R. Mendis, S. Zheleznyakov, E. et al. (2010). Body mass index, waist circumference and waist hip ratio as predictors of cardiovascular risk a review of the literature. European Journal of Clinical Nutrition, 64(1), 16-22. https://doi.org/10.1038/ejcn.2009.68
Ross, R. Berentzen, T. Bradshaw, A. J. Janssen, I. Kahn, H. S. et al. (2008). Does the relationship between waist circumference, morbidity and mortality depend on measurement protocol for waist circumference? Obes Rev 9, 312-325. https://doi.org/10.1111/j.1467-789X.2007.00411.x
Villareal, D. T. Apovian, C. M. Kushner, R. F. Klein, S. (2005). Obesity in older adults: technical review and position statement of the American Society for Nutrition and NAASO, The Obesity Society. Obes Res. 82, 923-934. https://doi.org/10.1093/ajcn/82.5.923
WHO (2008). Data Waist circumference and waist-hip ratio : report of a WHO expert consultation, Geneva, 8-11.
 This work is licensed under a: Creative Commons Attribution 4.0 International License
© Granthaalayah 2014-2022. All Rights Reserved.