The Effect of Company Performance on Firm Value With Institutional Ownership as an Intervening Variable (An Empirical Study On Real Estate and Property Companies Registered In Indonesian Stock Exchange 2016-2019)
Amrizal 1![]()
![]() , Hamilah 2
, Hamilah 2![]() , Setya Manaroy 3
, Setya Manaroy 3![]()
1,2,3 Sekolah Tinggi Ilmu Ekonomi (STIE) YAI Salemba Raya Street Number 9ASenen, Jakarta City 10440, Indonesia
|
|
|
ABSTRACT |
|
|
The aims of this research is to analyze the impact of Current Ratio and ROA on Company Value with Institutional Ownership as an intervening variable with Empirical Studies on property and real estate companies registered on the IDX in 2016 – 2019.This study used quantitative descriptive method, where the data is measured on a numerical scale with the secondary data, This study result is Institutional Ownership had not affected significantly by Current Ratio with a t-statistic of 0.883318 and firm value also not significantly affected by CR with a t-statistic of -0.712988, while Institutional Ownership not affected significantly by ROA with a t-statistic of 0.303315, but ROA affected significantly by ROA with a t-statistic of 3.088025 and institutional ownership not impacted significantly on firm value with a t-statistic of -0.651118.Also, Current Ratio and ROA simultaneously non effect on Institutional Ownership, but simultaneously there is a significant impact of Institutional Ownership, ROA, and Current Ratio, firm value. Based on the intervening test, can be say that institutional ownership is not able to mediate the impact of CR and ROA on company value. |
|||
|
Received 11 April 2022 Accepted 16 May 2022 Published 31 May 2022 Corresponding Author Amrizal, Amrizal1959@gmail.com DOI 10.29121/granthaalayah.v10.i5.2022.4594 Funding: This research
received no specific grant from any funding agency in the public, commercial,
or not-for-profit sectors. Copyright: © 2022 The
Author(s). This work is licensed under a Creative Commons
Attribution 4.0 International License. With the
license CC-BY, authors retain the copyright, allowing anyone to download,
reuse, re-print, modify, distribute, and/or copy their contribution. The work
must be properly attributed to its author.
|
|||
|
Keywords: Current Ratio, Return on Assets,
Institutional Ownership, Company Value |
|||
1. INTRODUCTION
Capital has a very crucial position in economic activity, especially in the production process, where the production process can be slow down if capital does not exist. The need for capital in the business world is getting bigger, shown by the increasing of production activity in manuy companies. Capital availability cannot be separated from investment, where investors play a major role in the funding process. Investors also carrying the majority of decision making to achieve investment goals, and this process can be done by looking at the majority of decision making to achieve investment goals is carried out by investors only by looking at Accounting Information factors. Though, there is no guarantee that stock value of big companies can be a good alternative as an investment option. So, an in-depth analysis of the company to be funded is required.
Other considerations for investors to choose the issuer company are Dividend Yield (DY), Earnings Per Share (EPS), Debt to Equity ratio (DER), Price to Earnings Ratio (PER), and Return on Equity (ROE).
The firm value can be indicated from Price to Book Value (PBV). The future of the company is trusted by the market through a high PBV, as well as the amount of multiplication between the book value of the company and the market value of its shares so that the investment is more optimal.
In order to fill the need for business mapital, the Government cooperates with a number of financial institutions to organize capital market activities, whose function is to bridge needs between investors and issuers, namely the Indonesian Stock Exchange (IDX).
IDX is a systems and facility, where sale and purchase between trading parties are held and provided. Read from Kontan.co.id on August 27, 2020, the total number of public companies listed on the IDX reached 700 companies, of which PT Transkon Jaya Tbk via via ticker code TRJA was listed as the seven hundredth company or the thirty-sixth company that recorded its shares from January 2020 (Suryahadi, 2020).
Companies on the IDX are separated into several fields:
1) Agriculture
2) Mining
3) Basic Industry and Chemicals
4) Miscellaneous Insdustry
5) Consumer Good Industry
6) Property, Real Estate, and Building Construction
7) Infrastructure, Utility, and Transportation
8) Finance
9) Trade, Service, and Investmen
Property, Real Estate, and Building Construction sector is one of the issuers on the IDX. This sector considered quite potential as an investment destination because this field is really close to the economy in general. This sector has a double effect on other sectors that support economic progress, including the construction, trade, and financial services sectors.
Property and Real Estate considered as a business that has dynamic characteristics with strong competitiveness, where the need for housing is inversely proportional to the availability of land, from an economic point of view this situation makes property prices increasingly expensive every year.
A Phenomena that happen recently in international and domestic areas that aroused curiosity in property and real estate sector, made this business famous for its fast and complex business changes as well as an increase in our country in the development of the housing and property industry after financial crisis. The driving factor for such an increase is the widespread establishment of a number of shopping centres as well as buildings used as offices. Illustration of such an incident, of course, has the potential to affect the level of stock returns in housing and property companies which will be a separate consideration for investors in making their investment choices.
Based on the explanation above, the researcher intends to raise the title “The Effect of Company Performance on Firm Value with Institutional Ownership as an Intervening Variable (An Empirical Study on Real Estate and Property Companies Registered in Indonesian Stock Exchange 2016-2019)
This research is an improvement from Wulandari, (2020)’s study on the Influence of Company Size, ROA, and Institutional Ownership, to Firm Value with property and real estate company registered on IDX 2010 – 2015 as the study object. This research will adding the Current Ratio variable so that investors can analyse more deeply about the value of an issuer company, where this ratio can provide an overview of the company's financial strength in the short term, where the company will be more stable if the ratio is higher; however, if this ratio is lower, the liquidity risk will be higher.
This research intends to examine and analyse the effect of CR, ROA, and institutional ownership on the PBV/firm value of property and real estate companies on the IDX during 2016 – 2019. In addition, it also conducts simultaneous testing of the Current Ratio (CR), ROA, Institutional Ownership, on the PBV/Company Value of property and housing on the IDX during 2016 – 2019.
2. LITERATURE REVIEW
2.1. AGENCY THEORY
This theory is populated by Jensen and Meckling (1976). The correlation between agents (management) and principals (shareholders) is a depiction of the existence of a cooperation agreement between managers and shareholders that gave rise to the agency theory, the correlation of the cooperation agreement is in the form of authority that the principal give to the agent in order to achieve the principals’ goals.
The company owners recruit a manager to handle the operations of the company, because of shareholders limitations. But this situation potential to lead an agency conflict.
Bodroastuti (2009) in his research shows that agency theory describes different interests between company owners and company managers who are separated. This separation potentially leads to a conflict. The existence of an agency conflict is due to the involvement of a number of parties, namely the principal (who submits the agreement and shareholders) and the agent (who obtains the agreement and manages the principal's funds) has different interests.
2.2. SIGNALLING THEORY
Executives have a higher understanding of the company Ross (1977) which potentially encourage them to provide information for potential investors and make company sticks price soars.
According to Husnan (2013) signalling theory, describes anything matters relating to the way management can give a number of success or failure signals to owners. In relation to agency, there is information asymmetry that occurs between outside parties, namely creditors or investors and managers. Information asymmetry can occur if the company's internal parties have more information than outsiders. However, this can be minimized by reporting all data, whether financial data or not, to outside parties through financial reports.
2.3. FREE CASH FLOW THEORY
In the process of calculating free cash flow there are different and varied things in its application. The calculation between one another is different, perhaps because the users of financial statements are not the same. Kieso et al. (2016), states that free cash flow is the remaining cash from the company's operations after adjustments are made using capital expenditures and dividends.
Ross (2000), argues that free cash flow is the total cash flow to creditors and shareholders whose composition is: operating cash flow, capital spending, and changes in net working capital. Free cash flow is the company's free cash that has the potential to be distributed to creditors and shareholders because it is not needed in working capital or as an investment in fixed assets.
Free Cash Flow Theory is an illustration of free cash, after carrying out the required number of reinvestments, the cash can be distributed to investors Keen (2011), in order to obtain information on the total cash provided from the company after maintaining the current production amount, managers can use it.
2.4. ACCOUNTING THEORY
According to the Accounting Principles Board (APB) on the fourth statement, "Accounting is a service activity whose function is to provide quantitative data, especially financial, about business entities that are considered useful in the creation of a number of economic conditions when determining a number of real options between several action as another way out.
The purpose of this theory is to provide a provision when predicting and describing attitudes as well as a number of accounting events. Theories are defined as ideas, concepts, meanings and collected propositions that make a coherent thought about a sign (phenomenon). This is done through the elaboration of the relationship between the variables contained in it and has the aim of being able to explain and predict such phenomena.
2.5. FINANCIAL REPORT
Financial report shows the current financial condition of the firm as well as for a period. Winarno (2017) concluded that, "Financial reports are show the current financial condition of the company as
well as in one period, which is prepared for all decision makers, especially parties outside the company, regarding the financial position and operating profit of the company.”
Some of the general objectives of preparing financial statements are to assist companies in the decision-making process, to assist companies in evaluating and predicting the future of business developments, and to be able to provide an assessment of the company's capital activities and operations.
2.6. COMPANY PERFORMANCE
Company performance is a description of the overall condition of the company in a period, as well as the gains and achievements caused by the company's operational activities when utilizing existing resources. Mulyadi, 2007 in Nugrahayu and Retnani (2015), states that the company's performance is the complete success of the company when it reaches its strategic goals selected intermediary strategic initiatives. The parameter that is generally used to assess company performance is the financial approach to financial statements.
The achievement of the work of a person or group in a company that is carried out obediently and responsibly in accordance to regulations as an effort to realize the ideals of a company that is allowed and does not violate the law, ethics, and morals is called company performance. According to Basri (2004) Financial ratios are one of several parameters to measure company performance
This can be seen from the financial position and company success which can be applied as a reference when making decisions. A company can be said to be in good condition if it has four indicators that can be seen from the financial statements as below:
Liquidity ratio
Is a ratio that applied in order to be able to carry out an assessment of the company's ability when carrying out its obligations to pay off debt and in order to be able to carry out controlling working capital efficiency, can be measured using: (1) Profitability Ratio (2) Cash ratio (3) Quick ratio (4). CR
Profitability ratio
Is a ratio that used to calculate the firm's capability when generating profit, it can be measured by: (1) ROA (2) ROE (3) gross profit margin (GPM) 4) Net profit margin (NPM).
solvency ratio
Is a ratio that used to show the company's capabilities when settling all short-term and long-term liabilities, can be measured by (1) Fixed charge coverage (2) Time interest earned,
Activity ratio
The activity ratio is applied to measure the level of use of the company's assets and assets, it can be measured by (1) Fixed Asset Turnover (2) Inventory Turnover (3) Accounts Receivable Turnover (4) Total Asset Turnover
2.7. CURRENT RATIO
Current ratio is a ratio that Led do Measures the company's strength to pay off short-term debt Kasmir (2014). The current ratio is one of a number of Liquidity Ratios that applied to carry out an assessment of the liquidity position of an entity by using the relationship between Current Liabilities and Current Assets.
The acquisition of the Current Ratio obtained is generally 2 times. This acquisition of the Current Ratio is considered a safe position in the finances of the majority of companies. However, in essence, there is a Varian of current ratio acceptance from one industry to another. For the majority of industries, 2 times acquisition of the Current Ratio has been assessed as acceptable.
The current ratio is calculated through current assets per current debt. The formula is:
![]() (1)
(1)
2.8. RETURN ON ASSET (ROA)
Kasmir (2010) argues that "ROA is the return on investment (ROI) and ROA is a ratio that shows the results of the overall assets that the company uses". It can be said, Return on Assets is a parameter ratio of the company's efficiency level when controlling its assets in order to obtain profit within a period. Return on Asset (ROA) is formulated:
![]() (2)
(2)
2.9. INSTITUSIONAL OWNERSHIP
Institutional ownership is a share ownership for institutions such as investment companies, banks, insurance companies, etc. Bernandhi and Muid (2013). Another definition, Institutional Ownership is the ownership of a non-bank financial institution on management shares on behalf of another party carried out by that institution. A number of these institutions are in the form of waqf, private foundations, investment companies, insurance, pension funds, mutual funds, or other large institutions that manage funds on behalf of other owners.
Institutional ownership is very important when monitoring management because the existence of the institutional ownership can trigger efficiency in supervision. Institutional investors have the potential to carry out greater supervision if the level of ownership is high so that it has the potential to become a barrier to manager's opportunistic behaviour Husnan (2013) in Soraya (2011). Institutional ownership is calculated by the formula:
![]() (3)
(3)
2.10. FIRM VALUE
Noerirawan and Muid (2012) state that the value obtained by the company is a form of public trust in its business for a certain period of time. In the absence of trust, the company is difficult to maintain itself from the past until now. Naufal (2009) the definition of company value is the firm's performance that seen from the share value obtained from the demand and supply of the capital market which is a mirror for assessing the company's performance.
Price to Book Value (PBV) is used to calculate company value. PBV is a total measurement that will show that the stock price has the potential to be traded through being overvalued on the stock book, so the ratio that embedded in the company will increase.
2.11. Indonesia stock exchange
IDX according to the Indonesian Wikipedia, the free encyclopedia is the part that implements and maintains a system so the offers for buying and selling securities of a number of other parts meet with the intention of trading securities. The Indonesia Stock Exchange has 9 business fields of listed companies, a number of these areas so that each company industry and investors or shareholders are separated so that it is not difficult to manage portfolios and risk management, namely Infrastructure, Utilities, and Transportation: Housing, Construction and Property, Consumer Goods Industry, Investment, Services and Trade, Finance, Miscellaneous Industries, Chemical and Basic Industries, Mining, and Agriculture.
2.12. PROPERTY AND REAL ESTATE
According to Kotler et al. (2005) property is ownership rights that do not exist in the form of real objects (real estate) or financial (shares and bonds). Real Estate is defined as all building improvements that stand permanently on the ground. Thomsett (1994).
Research Hipothesis
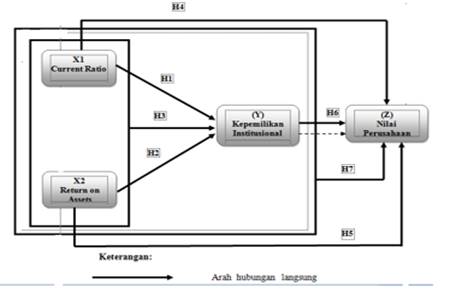
Figure 1
|
Figure 1 Direct Effect Conceptual Framework |
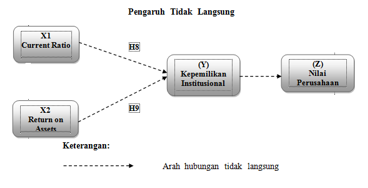
Figure 2
|
Figure 2 Indirect Effect Conceptual Framework |
2.13. RESEARCH HIPOTHESIS
H1: There is a significant effect of the Current Ratio on Institutional Ownership of housing and property companies on the IDX during 2016-2019.
H2: There is a significant influence of ROA on institutional ownership of housing and property companies on the IDX during 2016-2019.
H3: There is a simultaneous significant effect of Current Ratio and ROA on the institutional ownership of housing and property companies on the IDX during 2016-2019.
H4: There is a significant influence of CR on the firm value of property and housing companies on the IDX during 2016-2019.
H5: There is a significant impact of ROA on firm value of housing and property companies on the IDX during 2016-2019.
H6: There is a significant influence of Institutional Ownership on the firm value of housing and property companies on the IDX during 2016-2019.
H7: There is a simultaneous significant effect of Current Ratio, ROA, and institutional ownership on the firm value of property and housing companies on the IDX during 2016-2019.
H8: There is a significant effect of the Current Ratio on the firm value of property and housing companies on the IDX during 2016-2019 with the mediator of Institutional Ownership.
H9: There is a significant influence of ROA on the firm value of property and housing companies on the IDX during 2016-2019 with the mediator of Institutional Ownership.
3. RESEARCH METHOD TYPES OF RESEARCH
This research uses descriptive quantitative method, where data is measured on a numerical scale. Secondary data in the form of annual financial reports from housing and property companies on the IDX during 2016-2019, which is downloaded via the www.idx.co.id fact book page used in this research.
3.1. POPULATION, SAMPLE, SAMPLING TECHNIQUE
65 companies in the property and real estate sector registered on the IDX during 2016-2019 were the population of this research. Meanwhile, in the property and real estate sector registered on the IDX during 2016-2019 were selected as samples. non-probability is used as the sampling technique.
3.2. RESEARCH VARIABLES AND OPERATIONAL DEFINITIONS OF VARIABLES
Variations of research variables in this research are:
1) Dependent Variable
I a variables that are affected by the independent variables as well as the problems that will be used as research. The dependent variables is determined through the PBV (Y) formula in this study.
2) Independent Variable
Is the variable that influences or causes changes or the emergence of the dependent variable. The independent variables in this research are Current Ratio (Variable X1), ROA (Variable X2).
3) Intervening Variables
The intervening variable i is an variable i which theoretically affects the relationship between the independent and dependent variable. This relationship is not direct and cannot be measured. The intervening variable in this study is Institutional Ownership.
3.3. DATA ANALYZE AND HIPOTHESIS EXAMINATION
The effects of Institutional Ownership, ROA, and CR on the firm value of several companies on the IDX which are used as sampling in the 2016–2019 period are examined in this research. So that panel data analysis is used using EViews 8.0.
The unification of time series data and cross section series data is called panel data. Panel data is divided into two types, namely unbalanced and balanced. Balance panel data is used on this research. The stage of panel data analysis is:
1) Using data panel to estimate the regression model
2) Choose a panel data regression model
3) Assumptions test
4) Hypothesis test
3.4. DESCRIPTIVE STATISTICAL ANALYST
Descriptive statistics have the function of making a description of research objects through sample data or improvised populations according to the maximum and minimum values, descriptive statistics can also be interpreted as several methods that have to do with collecting and presenting a data set so a useful information can be provided. Making the classification so that inference and descriptive statistics are carried out on the basis of their activities.
3.5. PANEL DATA ANALYSIS METHOD
The unification of time series data with a cross section is called panel data (Woldridge, 2009:444). The general model of panel data in the form of a combination of the two data above can be written as follows:
𝑌9: = 𝛼 + 𝛽𝑋9: + 𝜀 (4)
Information:
i = 1,2, 3, n
t = 1,2, 3, T
Y = dependent variable
X = independent variable
n = number of observations
T = amount of time
𝑛 × 𝑇 = number of panel data
The panel data regression model in this research can be written as follows:
𝒀𝒊𝒕 = 𝜶 + 𝜷𝟏𝑿𝟏𝒊𝒕 + 𝜷𝟐𝑿𝟐𝒊𝒕 + 𝜷𝟑𝑿𝟑𝒊𝒕 + 𝜺𝒊𝒕 (5)
Information:
𝑌9: = Company value of company-i year-t
𝛼 = constant
𝑋19: = CR firma-i year-t
𝑋29: = ROA firma-i year-t
𝑋39: = Managerial Ownership of firma-i year-t
𝛽>, 𝛽? 𝛽@ = regression coefficient i = 1,2,3,…,30
t = 1,2,3,4
3.6. PANEL DATA REGRESSION MODEL ESTIMATION
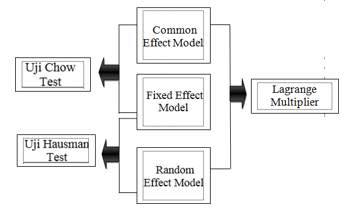
The 3 approaches, namely, the Fixed Effect, Common Effect, and Random Effect models are the estimation of panel data regression models that can be used.
1) Common Effect Model
The CEM approach assumes that the value of the constant (intercept) and the value of the coefficient (slope) for each variable is the same for all units of cross section and time series.
YAB = α + βXAB + uAB (6)
2) Fixed Effect Model
The Fixed Effect model (FEM) assumes that there is a different effect for each individual.
YAB = αA + βXAB + uAB (7)
This approach is called Least Square Dummy Variable (LSDV). LSDV also gives space for systemic time series effects by providing a time dummy to the model.
3) Random Effect Model
REM is an approach that gives a special effect from each individual who is acted upon as part of the error component which is random and has no correlation to the dependent variable (Wooldridge, 2009:481). REM assumes that the intercept αA is a random variable with a mean αC therefore the intercept can be written αA = αC + εA where εA is a random error that has a mean of 0 and a variance σ? REM is stated among other things.
𝑌9: = 𝛼C + 𝛽𝑋9: + 𝑤9: (8)
3.7. CLASSIC ASSUMPTION TEST
The regression analysis assumption test with panel data includes autocorrelation, multicollinearity, heteroscedasticity, and normality tests.
1) Normality Test
The residual normality test can be detected by the Jarque-Bera test. The normality test hypotheses through the Jarque-Bera test include:
H0: residuals are normally distributed
H1: residuals are not normally distributed
Jarque-Bera test statistics are written as follows:
![]() (9)
(9)
In making a decision, the basis is that the JB value obtained is compared with the value of 𝜒? table with a significance level of 𝛼.
If 𝐽𝐵 ≥ 𝜒? (? L) then there is enough evidence to reject H0.
2) Heteroscedasticity
According to Nahrowi and Ustman in Purnamasari (2012), heteroscedasticity was detected by comparing the value of the sum of the residual quadrads (SSR) in FEM with SSR from GLS. The data is free from heteroscedasticity problems if the value of 𝑆𝑆𝑅MNO < 𝑆𝑆𝑅PQD
3) Multicolonierity
Multicollinearity means that there is a linear relationship between the independent variables in the regression model. Multicollinearity can be seen from the VIF value. If VIF value is > 10, can be stated that the model has multicollinearity problems.
4) Autocorrelation
Autocorrelation is the association between one residual and another. Durbin Watson tes can be used to detect autocorrelation problem, with the basis of decision-making is:
1. The value of 𝑑 < 𝑑𝑙 so there is a positive autocorrelation
2. The value of 𝑑 > (4 − 𝑑𝑙) so there is a negative autocorrelation
3. The value of 𝑑𝑢 < 𝑑 < (4 − 𝑑𝑙) means that there is no autocorrelation. The value of 𝑑𝑙 < 𝑑 < 𝑑𝑢𝑎𝑡𝑎𝑢 (4 − 𝑑𝑢) cannot be concluded.
3.8. SELECTION OF MODEL ACCURACY TEST
The three models that have been estimated are then determined according to the part that is appropriate to the research objectives.
Figure 3
|
Figure 3 Model accuracy test |
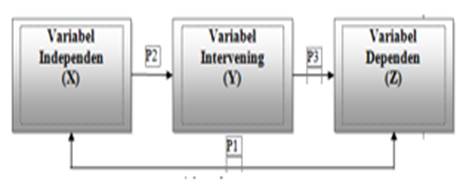
3.9. PATH ANALYSIS
Is an improvement of multiple linear regression. The presence of intervening variables in path analysis can trigger an indirect relationship.
Figure 4
|
Figure 4 Path Analysis Model |
3.10. HYPOTHESIS TESTING
Hypothesis testing is carried out through simultaneous (concurrent) and partial test:
Simultaneous Test
Simultaneous testing is used in order to understand the effect of all independent variables on the dependent variable (Woldridge, 2009:168). Simultaneous hypotheses test include:
𝐻C ∶
𝛽> = 𝛽? = ⋯ = 𝛽R = 0
𝐻> ∶ 𝑚𝑖𝑛𝑢𝑚𝑢𝑚 𝑡ℎ𝑒𝑟𝑒 𝑖𝑠 𝑜𝑛𝑒 𝛽S ≠ 0 ; 𝑗
= 1,2, …, 𝑘
Simultaneous test statistics include:
![]() (10)
(10)
In making decisions, the basis is that the F value obtained is compared with the F table value with a significance level of. If 𝐹 ≥ 𝐹 (UVRH>; UXHUHR; L) then there is sufficient evidence to reject H0.
Partial Test
Partial testing is used in order to know which independent variables have a significant influence on the dependent variable Wooldridge (2009) The partial test hypotheses include:
𝐻C ∶ 𝛽S = 0
𝐻> ∶ 𝛽S ≠ 0 ; 𝑗
= 1,2, …, 𝑘
Partial test statistics include:
![]() (11)
(11)
In making decisions, the basis is that the t value obtained is compared with the t table value with a significance level of. If |𝑡| ≥ 𝑡 (UXHR; L/?) then there is sufficient evidence to reject H0.
4. FINDINGS AND DISCUSSION DESCRIPTIVE
ANALYSIS
Table 1
|
Table 1 Descriptive Analysis Results |
||||
|
Statistics |
PBV |
CR |
ROA |
KI |
|
Mean |
1.562928 |
3.212725 |
5.206603 |
58.89294 |
|
Median |
0.68658 |
2.040458 |
3.806292 |
66.76223 |
|
Maximum |
49.713 |
24.88294 |
35.8901 |
99.89866 |
|
Minimum |
0.039255 |
0.001996 |
0.005734 |
5.214264 |
|
Std. Dev. |
4.865426 |
3.777817 |
5.207544 |
24.01973 |
The Company Value (Y) of property and real estate companies for the 2016-2019 period has the lowest value of 0.039255, while the highest value is 49.71300. The average firm value (Y) of housing and property companies for the 2016-2019 period is 1.562928 with a standard deviation of firma value
(Y) is 4.865426. The diversity of the Firm Value (Y) data is quite large, because the standard deviation of the value is higher than the average value.
The Current Ratio (X1) of property and real estate companies for the 2016-2019 period has the lowest value of 0.001996, but the highest value is 24,88294. The average Current Ratio (X1) of property and real estate companies for the 2016-2019 period is 3.212725 with a standard deviation of 3.777817. The standard deviation value is greater than the average, indicating that the diversity of Current Ratio (X1) data tends to be large.
ROA (X2) from Property Companies for the 2016-2019 period has the lowest value of 0.005734, while the highest value of 35.89010. The average ROA (X2) from housing and property companies for the 2016-2019 period is 5.206603 with a standard deviation value of 5.207544. The value of the standard deviation is greater than the average, which means that the diversity of the ROA (X2) data tends to be large.
Institutional Ownership (X3) of property and real estate companies for the 2016-2019 period has the lowest value of 5,214264, but the highest value of Institutional Ownership (X3) is 99,89,866. The average institutional ownership (X3) of property and real estate companies for the 2016-2019 period is 58,89294 with a standard deviation of 24,01973. The standard deviation value does not reach the mean, indicating that the diversity of the Institutional Ownership data (X3) tends to be small.
4.1. HYPOTHESIS TEST PARTIAL TEST RESULTS
Implemented in order to test the hypothesis related to the existence of independent variables on certain variables. The test conditions state that when the probability value < significance level (□ = 5% or 0.05), partially the independent variable is affected the dependent.
Table 2
|
Table 2 Partial Hypothesis Test Results |
|||
|
Variable |
Coefficient |
t-Statistic |
Prob. |
|
CR |
-0.05242 |
-0.712988 |
0.4782 |
|
ROA |
0.294581 |
3.088025 |
0.0029 |
|
KI |
-0.132312 |
-0.651118 |
0.5171 |
Examine the effect of CR (X1) on Firm Value (Y) obtained a t-statistic value of -0.712988 with a probability of 0.4782. The probability value > 5% alpha is significant or 0.05. Because it can be drawn if CR (X1) has no significant effect on Firm Value (Y).
The test of ROA (X2)’s effect on Firm Value (Y) produces a t-statistic value of 3.088025 with a probability of 0.0029. Opportunity value < significant alpha 5% or 0.05. Because it can be drawn if ROA (X2) has a significant effect on Firm Value (Y). The resulting coefficient value is 0.294581 (positive), meaning that if the ROA increases by 1, it tends to increase the firm value by 0.294581, assuming the other variables remain.
The effect of institutional ownership (X3) on firm value (Y) produces a t-statistic value of -0.651118 with a probability of 0.5171. The probability value > 5% alpha is significant or 0.05. So, it can be said that Institutional Ownership (X3) has no significant effect on Firm Value (Y).
4.2. SIMULTANEOUS TEST RESULTS
This is the results of the simultaneous research test
Table 3
|
Table 3 Simultaneous Test Results |
|
|
F-statistic |
Prob(F-Statistic) |
|
9.78875 |
0.000000 |
Based on Table 3 the model produces an F value of around 9.788750 with a probability of 0.000000. Because it produces a probability < level of significance ( = 5% or 0.05). This means that there is a significant impact of the Current Ratio, ROA, and Institutional Ownership variables on Company Value (Y) simultaneously.
4.3. COEFFICIENT OF DETERMINATION
The R-square value in the feasible influence model is 0.810389 or 81.0389%. Thus, the variables of Current Ratio, ROA, and Institutional Ownership of 81.0389% can explain Company Value, or in other words the contribution of Current Ratio, ROA, and Institutional Ownership variables to Company Value. worth 81.0389%, the remaining 18.961% including contributions from variables not examined in this research.
Partial Hypothesis Test 2
Table 4
|
Table 4 Partial Test Results on Institutional Ownership |
|||
|
effect |
Coefficient |
t-Statistic |
Prob. |
|
CR (X1) |
0.036986 |
0.883318 |
0.3792 |
|
ROAL |
0.016241 |
0.303315 |
0.7623 |
The Current Ratio (X1) impact on Institutional Ownership (Y) test resulted in a t statistic of 0.883318 with a probability of 0.3792. The probability/opportunity value > the level of significance. There is no significant impact of CR (X1) on Institutional Ownership (Y).
Testing the impact of Return on Assets (X2) on Institutional Ownership (Y) yields a t statistic of 0.303315 with a probability value of 0.7623. The probability value is higher than the significance level. So, it can be decided if there is no significant effect of Return on Assets (X2) on Institutional Ownership (Y).
4.4. SIMULTANEOUS TEST 2
The results of the F test show the F-statistical value = 0.406450 and a significance of 0.667105 > α = 0.05, it can be interpreted that the hypothesis is not accepted and simultaneously Current Ratio (X1) and ROA (X2) have a significant influence on institutional ownership (Y).
4.5. COEFFICIENT OF DETERMINATION OF HYPOTHESIS TESTING 2
The R-square value in the model of the influence of the Current Ratio (X1) and ROA (X2) variables on Institutional Ownership (Y) is 0.008063 or 0.8063%. This reveals that Institutional Ownership (Y) can be described by the variables CR (X1) and ROA (X2) as much as 0.8063%, with the remaining 99.1937% coming from other variables that are not the subject of this study.
Path Analysis
Table 5
|
Table 5 Indirect Effect Test Results |
||
|
Variable |
Indirect Effect to |
|
|
The value of
the company |
Significance |
|
|
X1 |
-0.004894 |
TS |
|
X2 |
-0.002149 |
TS |
The indirect effect of Current Ratio to Firm Value through Institutional Ownership is -0.004894 and insignificant. So, it can be understood that Institutional Ownership is not a mediator of the influence of CR on Firm Value. This means that institutional ownership is not a mediator of the influence of the current ratio on firm value.
The direct impact of ROA on firm value is 0.294581 and is significant. The indirect effect of ROA on firm value through institutional ownership is -0.002149 and is not significant. Therefore, it is understandable that institutional ownership cannot mediate the influence of ROA on firm value.
5. DISCUSSION
1) Effect of CR on Institutional Ownership
The results of the effect of CR on institutional ownership test is there is no significant positive effect found. This result in line with Wahyuni's (2017) study which states that CR has no effect on Institutional Ownership.
2) Effect of ROA on Institutional Ownership
The results of the effect of ROA on institutional ownership test stated that there was no significant positive effect of ROA on institutional ownership. This is the same as Wahyuni's research (2017) which states that ROA has no effect on institutional ownership.
3) Simultaneous Effects of CR and ROA on Institutional Ownership
The results of the simultaneous test of the ROA and CR effect on the institutional ownership, show that there is no significant effect of ROA and CR on institutional ownership with a positive coefficient value. This is the same as Wahyuni's research (2017).
4) Effect of CR on Firm Value
These results indicate that CR has no significant effect on firm value (PBV) with a negative coefficient value. This means that the higher the current ratio level, it is indicated that there are unused funds (idle) which means a decrease in profit.
This result is in line with Salainti and Sugiono (2019) study which showed that CR had no significant and negative effect on PBV.
5) Effect of ROA on Firm Value
These results suggest that ROA can have a significant and positive effect on PBV. This means that if the ROA value is large, the company is increasingly able to generate profits which will ultimately be able to increase the company's profitability.
6) The Effect of Institutional Ownership on Firm Value
The results of the influence of institutional ownership on firm value provide an illustration that the effect is not found. This is in line with Pertiwi and Hermanto (2017)
7) Effect of CR, ROA, and Institutional Ownership on Firm Value
The test results of CR, ROA, and Institutional Ownership impact on firm value show that simultaneously there is a significant effect of Current Ratio, ROA, and Institutional Ownership on Firm Value. This is in line with research by Awulle, Murni and Rondonuwu (2018) which states that profitability, liquidity, and institutional ownership simultaneously have an influence on the value of food and beverage companies.
8) Effect of Current Ratio on Firm Value with Institutional Ownership Being an Intervening Variable
The test results of CR impact on firm value with Institutional Ownership as an interverning variable illustrates that the effect of CR on firm value through institutional ownership is not found. This is in accordance with Melisa's research (2019).
9) The Effect of ROA on Firm Value with Intervening Institutional Ownership Variables
The test result of the impact of ROA on firm value with Institutional Ownership being an interverning variable illustrates if there is no impact of ROA on firm value through institutional ownership.
6. CONCLUSIONS AND SUGGESTIONS
Conclusion
According to the analysis on the hypothesis test above, so that it can answer the problem formulation which conclusions can be drawn, namely:
1) There is no effect of the current ratio on institutional ownership. Which means that the higher the current ratio does not necessarily increase institutional ownership
2) There is no effect of Return on Assets on institutional ownership. Which means that the higher level of assets return does not necessarily increase institutional ownership.
3) There is no effect of current ratio and assets return simultaneously on institutional ownership. Which means that the higher current ratio and assets return does not necessarily increase institutional ownership.
4) There is no effect of current ratio on PBV. This means that the value of the company is not affected by the low and high current ratio. This is because stock price movements and company value added in the capital market are caused by market psychological factors.
5) ROA has a significant positive effect on PBV. This means that if the ROA value is high, then the company's profit collection power is also high.
6) Institutional ownership does not affect firm value. Which means that institutional ownership cannot be a mechanism to increase firm value
7) There is no simultaneous effect of Current Ratio, ROA, and institutional ownership on firm value. This means that the firm value will not be affected by the Current Ratio, ROA, and institutional ownership
8) There is no effect of Current Ratio to Firm Value through institutional ownership. Mediator of the effect of Current Ratio on Firm Value is not institutional ownership.
9) There is no ROA effect on firm value through institutional ownership. Institutional ownership which is considered capable of establishing harmonization of owners and management is not proven to have an impact on firm value.
Suggestion
From the conclusions above, the researcher makes 3 suggestions, namely:
1) For companies Companies can take this research into consideration in order to increase the value of the company by paying more attention to the level of ROA. However, companies need to be careful in making decisions regarding the use of debt (current ratio) for the company's operating costs, because this study illustrates that the influence of CR on firm value is negative.
2) For investor for investors, it is necessary to pay attention to the value of ROA when they want to invest, because this variable has a significant positive influence on the value of the company. The company's ability to generate profits is reflected in the higher ROA value.
3) For further Research Other variables need to be added by further researchers, because in research only ROA has a significant positive influence on firm value.
CONFLICT OF INTERESTS
None.
ACKNOWLEDGMENTS
None.
REFERENCES
Awulle, I. D. Murni, & Sri Rondonuwu, C. N. (2018). Institusional Terhadap Nilai Perusahaan Food And Beverage Yang Terdaftar Di Bursa Efek Indonesia Periode 2012-2016. Jurnal EMBA, 6(4), 1908-1917.
Basri, R. (2004). Manfaat Penilaian Kinerja.
Bernandhi, R. & Muid, A. (2013). Pengaruh Kepemilikan Manajerial, Kepemilikan Institusional, Kebijakan Dividen, Leverage Dan Ukuran Perusahaan Terhadap Nilai Perusahaan. Fakultas Ekonomika dan Bisnis.
Bodroastuti, T. (2009). Pengaruh Struktur Corporate Governance terhadap Financial Distress. Jurnal Ilmiah Aset, 11(2), 170-182.
Husnan, S. (2013). Manajemen Keuangan (4th ed.). BPFE.
Jensen, M. C. & Meckling, W. H. (1976). Theory of the firm: Managerial behavior, agency costs, and ownership structure. In Economics social institutions 3(4), 163-231. https://doi.org/10.1016/0304-405X(76)90026-X
Kasmir. (2010). Kewirausahaan. Rajawali Pers.
Kasmir. (2014). Analisis Laporan Keuangan. Raja Grafindo Persada.
Keen, H. (2011). Clearing Up Confusion Over Calculation of Free Cash-Flow. Journal of Global Business Management, 7(1), 1.
Kieso, D. E. Weygandt, J. J. Warfield, T. D. Wiecek, I. M. & McConomy, B. J. (2016). Intermediate Accounting. John Wiley & Sons. (2).
Kotler, P. Wong, V. Saunders, J. & Armstrong, G. (2005). Principles of Marketing (4th ed.). Pearson Education Limited.
Naufal, H. (2009). Manajemen Keuangan : Berbasis Balanced Scorecard: Pendekatan Teori, Kasus, dan Penelitian Bisnis. Bumi Aksara.
Noerirawan, M. R. & Muid, A. (2012). Pengaruh Faktor Internal dan Eksternal Perusahaan Terhadap Nilai Perusahaan (Studi Empiris Pada Perusahaan Manufaktur Yang Terdaftar Di Bursa Efe k Indonesia Periode 2007-2010). Jurnal Akuntansi, 1(2). https://doi.org/10.21831/nominal.v1i2.1000
Nugrahayu, E. R. & Retnani, E. D. (2015). Penerapan Metode Balanced Scorecard Sebagai Tolok Ukur Pengukuran Kinerja Perusahaan. Jurnal Ilmu Dan Penelitian Akuntansi (JIRA), 4(10).
Pertiwi, S. T. & Hermanto, S. B. (2017). Pengaruh Struktur Kepemilikan, Kebijakan Dividen, Hutang Dan Profitabilitas Terhadap Nilai Perusahaan. Jurnal Ilmu Dan Penelitian Akuntansi, 6(5), 1-20.
Ross, S. A. (1977). The determination of financial structure : the incentive-signalling approach. The Bell Journal of Economics, 23-40. https://doi.org/10.2307/3003485
Ross, S. A. (2000). Fundamental of Corporate Finance (5th ed.). Irwin McGraw-Hill.
Salainti, M. L. I. & Sugiono. (2019). Pengaruh Current Ratio, Total Asset Turnover Dan Debt To Equity Ratio Dan Return on Asset Terhadap Nilai Perusahaan. Jurnal Ilmu Dan Penelitian Manajemen, 8(10), 1-23.
Sari, M. & Jufrizen, J. (2019). Pengaruh price to earning ratio, debt to equity ratio, return on asset dan price to book value terhadap harga pasar saham. Jurnal KRISNA : Kumpulan Penelitian Akuntansi, 10(2), 196-203.
Soraya, E. (2011). Pengaruh Struktur Kepemilikan, Struktur modal, dan Ukuran Perusahaan Terhadap Nilai Perusahaan Pada Perusahaan Manufaktur Di BEI. Universitas Riau.
Sugiarto, M. (2011). Pengaruh Struktur Kepemillkan dan Kebijakan Dividen terhadap Nilai Perusahaan dengan Kebijakan Hutang sebagai Intervening. Jurnal Akuntansi Kontemporer, 3(1).
Thomsett, M. C. (1994). Getting Started in Real Estate Investing (Vol. 77). John Wiley & Sons.
Wahyuni, S. F. (2017). Peran Kepemilikan Institusional dalam Memoderasi Pengaruh Current Ratio, Debt to Equity Ratio, Total Asset TurnOver dan Inventory Turn Over terhadap Return on Equity di Bursa Efek Indonesia. Jurnal Riset Finansial Bisnis, 1(2), 147-158.
Winarno, S. H. (2017). Penilaian Kinerja Keuangan Perusahaan Melalui Analisis Profitabilitas. Jurnal Moneter, 4(2), 106-112.
Wooldridge, J. M. (2009). Introductory Econometrics : A Modern Approach (4th ed.).
Wulandari, P. (2020). Pengaruh Kepemilikan Institusional, Return on Asset (ROA) dan ukuran perusahaan terhadap nilai perusahaan.
 This work is licensed under a: Creative Commons Attribution 4.0 International License
© Granthaalayah 2014-2022. All Rights Reserved.