SOIL EROSION RISK ESTIMATION BY USING SEMI EMPIRICAL RUSLE MODEL: A CASE STUDY OF NUN WATERSHED, UTTARAKHAND
Yudhaveer Singh 1![]()
![]() ,
Dipak Bej 2, Priya 3
,
Dipak Bej 2, Priya 3
1 Project Scientist, Chhattisgarh Council of Science and Technology, Raipur, Chhattisgarh, India
2 Research Scholar, Pt. Ravi Shankar Shukla University, Raipur, Chhattisgarh, India
3 Alumnus, Indian Institute of Remote Sensing, Dehradun, Uttarakhand, India
|
|
|
ABSTRACT |
|
|
Day by day
numerous population pressure on land and due industrialization there is a
vigorous increase of temperature increase in atmosphere, acid rain along with
Deforestation definitely degrade the quality the of land. It should have to
evaluate the land for estimate the quality of soil and find out the nutrition
status as well as the soil health. The present study with the help of
Geographic Information System (GIS) platform to estimation erosion risk
following Revised Soil Loss Erosion Model (RUSLE). The physiographic soil map
has been prepared through visual interpretation of LISS-4 satellite image
from which soil erodibility factor is derived. The Digital Elevation Model
(DEM) prepared from the contour line derived from toposheet and GPS survey.
In the model (Slope Length) LS factor was derived from the DEM. Crop Cover
and Support Practices Map (C and P) factor derived from the LULC map.it has
been found that 15.90 % under very high category erosion, 5.49 % high
erosion,7.03 % under moderate high erosion, 8.54 % under moderate
erosion,11.69 % under low erosion, and 51.36 % under very low erosional prone
area. |
|||
|
Received 16 April 2022 Accepted 15 May 2022 Published 11 June 2022 Corresponding Author Yudhaveer
Singh, DOI 10.29121/granthaalayah.v10.i5.2022.4592 Funding: This research
received no specific grant from any funding agency in the public, commercial,
or not-for-profit sectors. Copyright: © 2022 The
Author(s). This work is licensed under a Creative Commons
Attribution 4.0 International License. With the
license CC-BY, authors retain the copyright, allowing anyone to download,
reuse, re-print, modify, distribute, and/or copy their contribution. The work
must be properly attributed to its author.
|
|||
|
Keywords: Dem, Erosion, Gis, Rusle, Vigorous |
|||
1. INTRODUCTION
The soil is a natural skin of the earth body which contain mineral and organic constituents, differentiated into different horizons of variable physical, chemical also biological characteristic such as dept, texture, structure, colour, mineral content etc.
The LULC change analysis has been prepared with the help of out using Resource sat LISS III and LANDSAT-8 OLI satellite data. Saha et al. (1992) Discussed about the erosion prone area of Sukhna Lake catchment, north India using IRS 1D LISS for land use/ land cover mapping with a classification accuracy of 83 percent Shirmali et al. (2002). Universal soil loss erosion model has been used to estimate the average rate of soil erosion for different combination of crop practice system which associate with different types of soil, climate, relief, slope Jain and Kothyari (2000) Demonstrated that Remote Sensing and GIS and technique can be integrated with USLE successfully and effectively for prediction of soil loss erosion Wischmeier and Smith (1965) Study of the ground water impact on soil erosion CGWB (2009) various types of parameters like land use land cover, Physiographic unit map, slope and texture map has been prepared for soil erosion Bhattacharya (1997)
Evaluate the physiographic and metamorphic characteristic to ensure sustainable land use to predict the land degradation. Bhushan and Khera (2002) GIS technology to predict the annual soil erosion rates 56 tonnes/ha/yr. fall under highest category, which has been seen basically rain fed cultivated areas, which is affected by slop and relief. The lowest soil erosion bellow 1 tone/ha/yr. are found under dense forest. Shrestha (1997)
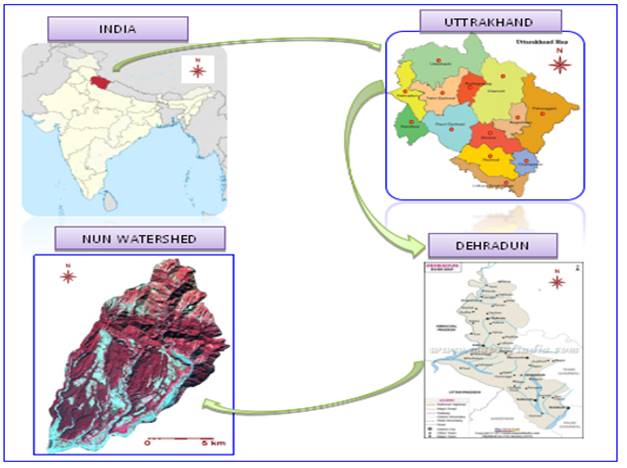
1.1. STUDY AREA
The study area is located in Dehradun district of Uttarakhand. The Nun Watershed is located between 300 20’ 12” N to 300 27’ 52” N latitude and 770 56’ 05” E to 780 08’ 55” E longitude. The study area covered with a terrace agriculture, dense Sal Forest, mixed forest, dense scrub, degraded forest, open forest, open scrub, orchards etc. The climate of the study area is like moderate temperature with cool winter of its absolute location near foothill of Himalaya.
Figure 1
|
Figure 1 Location map of the Study area |
2. MATERIALS AND METHODS
The required data has been taken from different sources as like rainfall data of 25 year has been collected from District Administration of Dehradun. And rest of the data details has been given below Table 1 and Table 2
Table 1
|
Table 1 Satellite data of the Study area |
|||
|
LISS-IV images |
Date |
Path No. |
Row No. |
|
1 |
17-OCT,2020 |
96 |
49 |
|
2 |
7-OCT,2020 |
96 |
50 |
Table 2
|
Table 2 Topographical sheet of the Study area |
||
|
SL. NO. |
Toposheet No. |
Scale |
|
1 |
53F/15 |
1:50000 |
|
2 |
53J/3 |
1:50000 |
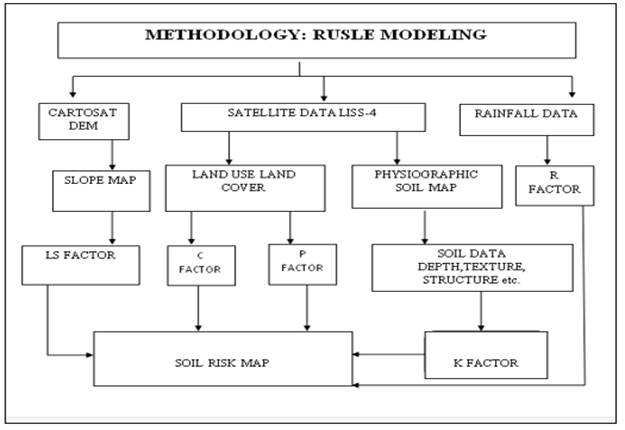
Following are the steps of methodology which objectives these are preparation of LULC MAP, Physiographic map, Slope map, Digital soil map, slope length factor map, crop cover and support practice factor map and finally prepare soil erosion risk map.
Figure 2
|
Figure 2 Methodology for revised soil loss erosion model |
3. RESULTS AND DISCUSSIONS
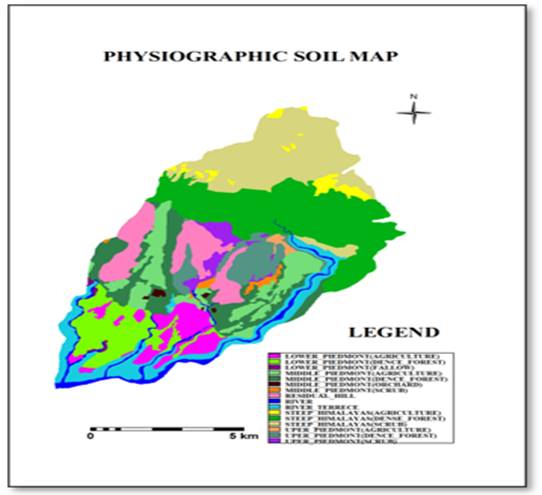
Physiographic Soil Map
In physiographic map physiographic units are divided into fifteen parts. These units are divided on the basis of slope steepness. The watershed falls under the hills and river terraces. Each unit have its own characteristics on the basis of soil, vegetation, and slope. The total area of the physiographic unit is 8819.51 hectare and each units have different area.
Table 3
|
Table 3 Physiographic Unit and percentage of area |
|||
|
Physiographic
unit |
PH
Unit |
Area
(ha.) |
Area
(%) |
|
Steep
Himalayas (scrub) |
H1 |
471.6225 |
5.54 |
|
Steep
Himalayas (agriculture) |
H2 |
677.755 |
7.96 |
|
Steep
Himalayas (dense forest) |
H3 |
19.9675 |
0.23 |
|
Upper
piedmont (scrub) |
UP1 |
724.6125 |
8.51 |
|
Upper
piedmont (dense forest) |
UP2 |
838.86 |
9.85 |
|
Upper
piedmont (agriculture) |
UP3 |
24.735 |
0.29 |
|
Middle
piedmont (scrub) |
MP1 |
64.6175 |
0.76 |
|
Middle
piedmont (dense forest) |
MP2 |
707.3375 |
8.3 |
|
Middle
piedmont (agriculture) |
MP3 |
283.5775 |
3.33 |
|
Middle
piedmont (orchard) |
MP4 |
751.9075 |
8.83 |
|
Lower
piedmont (dense forest) |
LP1 |
164.3175 |
1.93 |
|
Lower
piedmont (agriculture) |
LP2 |
1894.1275 |
22.24 |
|
Lower
piedmont (current fallow) |
LP3 |
471.6225 |
5.54 |
|
Residual
hill |
R1 |
677.755 |
7.96 |
|
River
terrace |
R2 |
19.9675 |
0.23 |
|
River |
R3 |
724.6125 |
8.51 |
|
Total |
8517.395 |
100 |
|
Figure 3
|
Figure 3 Physiographic Soil Map |
Table 4
|
Table 4 Physiographic Unit wise Soil properties |
||||||||
|
Sl. No. |
PH unit |
Slope (%) |
Drainage |
Surface Stones |
Texture |
Erosion |
pH |
EC |
|
1 |
H11 |
15-25 |
Excessive |
40-75 |
Sl |
E1/e2 |
4.95 |
0.032 |
|
2 |
H12 |
15-25 |
Excessive |
40-75 |
Sl |
E2/e3 |
5.24 |
0.063 |
|
3 |
H13 |
60-70 |
Excessive |
40-75 |
Sl |
E2 |
5.31 |
0.041 |
|
4 |
P11 |
15-Oct |
Well |
15-40 |
Sil |
E1 |
5.66 |
0.066 |
|
5 |
P12 |
10-Jul |
Excessive |
15-40 |
Sl |
E2/e3 |
5.49 |
0.094 |
|
6 |
P13 |
7-May |
Moderate |
<15 |
L |
E1 |
5.77 |
0.062 |
|
7 |
P21 |
8-May |
Well |
<15 |
Sil |
E2 |
5.63 |
0.05 |
|
8 |
P22 |
2-Jan |
Well |
<15 |
Sil |
E1 |
5.42 |
0.04 |
|
9 |
P23 |
3-Feb |
Well |
<15 |
Sil |
E1 |
4.87 |
0.04 |
|
10 |
P24 |
8-May |
Well |
<15 |
L |
E1 |
5.85 |
0.086 |
|
11 |
P31 |
8-May |
Well |
<15 |
Sil |
E2/e3 |
5.61 |
0.073 |
|
12 |
P32 |
5-Mar |
Well |
<15 |
Sil |
E1 |
5.42 |
0.061 |
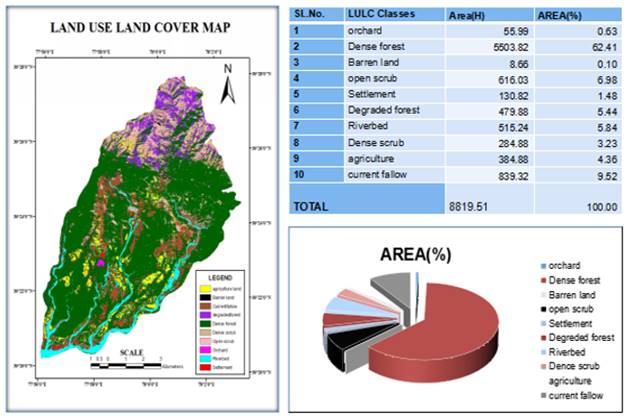
3.1. LAND USE LAND COVER
The major land use land cover of the study area is orchard, dense forest, barran land, open scrub, settlement, degraded forest forest, riverbed, dense scrub, agriculture, current fellow. The total area of the study region is 8819.51 ha. Agriculture area covered with 62.41 % whereas open scrub covered with 6 percentage.
Figure 4
|
Figure 4 Landuse Landcover map of the study area |
3.2. SLOPE FACTOR
Slope map was prepared using Digital Elevation Model. Slope was used for calculating LS factor. The digital elevation map (DEM) prepared with the help of Contour map. In the model LS factor was derived from the DEM. The slope of the watershed lies between gentle slope to very steep slope.
Figure 5
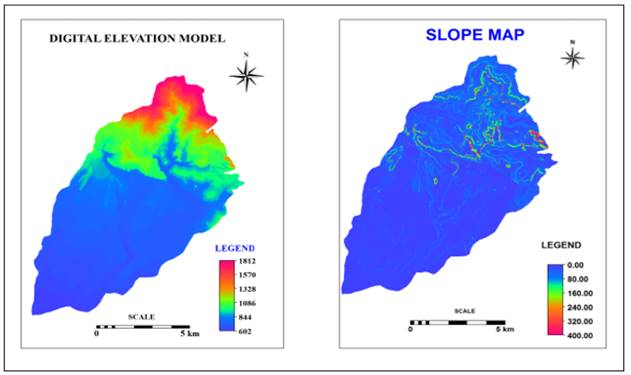
|
Figure 5 Slope of study area in percentage |
3.3. RAINFALL EROSIVITY FACTOR
Rainfall Erosivity factor has been calculated with the average rainfall of the twenty-five years. twenty-five-year average rainfall is 2051.4mm. The equation, is calculating the rainfall Erosivity, is-
R= 81.5+0.375*X (where, X= mean annual rainfall)
R= 81.5+0.375*2051.4
Figure 6
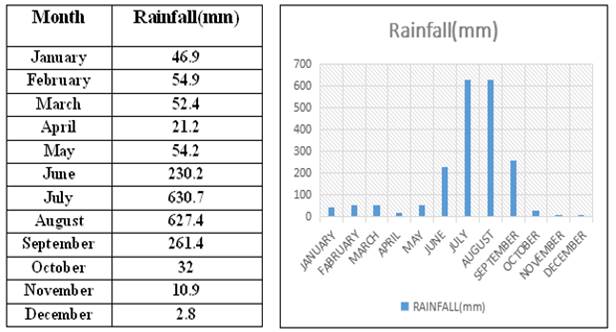
|
Figure 6 Monthly rainfall data |
3.4. COVER AND MANAGEMENT PRACTICE AND SUPPORT PRACTICE FACTOR
There are ten Landuse and Landcover classes have been found in the study area. LULC analysis showed that dense forest covered 62.40 %, degraded forest covered 5.44%, agricultural land covered 4.36%, dense scrub covered 3.23 %, open scrub covered 6.98 %, riverbed 5.84 %, and C and P factor derived from the LULC map. The C value varies from between 0.004-1 and the P value varies between 0.3 -1.
Table 5
|
Table 5 C and P value of land use and land cover |
||
|
Unit |
C Value |
P value |
|
Orchards |
0.01 |
0.4 |
|
Dense
Forest |
0.004 |
0.8 |
|
Barren
Land |
1 |
1 |
|
Open
Scrub |
0.8 |
0.8 |
|
Settlement |
0 |
0 |
|
Degraded
Forest |
0.04 |
0.8 |
|
Riverbed |
0 |
0 |
|
Dense
Scrub |
0.08 |
0.8 |
|
Agriculture |
0.2 |
0.3 |
|
Crop
II |
0.3 |
0.3 |
Figure 7
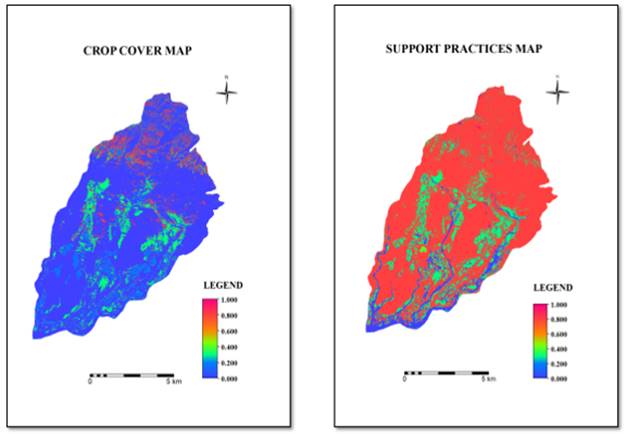
|
Figure 7 Crop Cover and Support Practices Map |
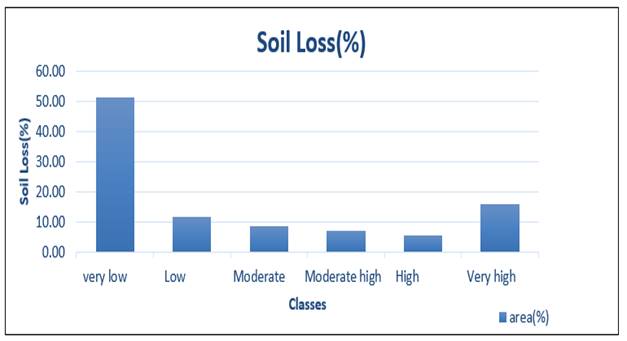
3.5. ESTIMATION OF SOIL EROSION
RUSLE soil erosion risk map has been prepared after generated of all parameter map. The formula to generate the soil erosion risk is as below:
A= R * K* L* S* C *P
it has been found that 15.90 % under very high category erosion, 5.49 % high erosion,7.03 % under moderate high erosion, 8.54 % under moderate erosion,11.69 % under low erosion, and 51.36 % under very low erosional prone area. ion.
Table 6
|
Table 6 |
|||
|
Classes |
Soil Loss(tons/ha/yr.) |
Area (ha) |
Area (%) |
|
Very Low |
0-10 |
4253.1 |
51.36 |
|
Low |
25-Oct |
967.842 |
11.69 |
|
Moderate |
25-50 |
706.885 |
8.54 |
|
Moderate high |
50-100 |
581.745 |
7.03 |
|
High |
100-200 |
454.537 |
5.49 |
|
Very high |
>200 |
1316.897 |
15.9 |
|
Total |
8281.07 |
100 |
|
Figure 8
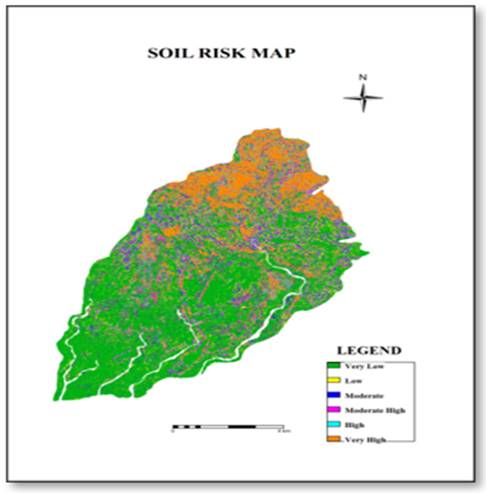
|
Figure 8 Areal extent of Soil Risk in Nun watershed |
Figure 9
|
Figure 9 category of aerial extent of Soil Risk in Nun watershed |
4. CONCLUSIONS AND RECOMMENDATIONS
The study area situated in Dehradun district Uttarakhand with objectives of estimation of soil risk are in the Nun watershed using Remote Sensing and GIS techniques. Remote sensing weight age overlay analysis is used to estimation the soil loss. The soil loss risk map which shown that total soil loss of the study area is 25-50 tons/ha/yr. the high erosion area found on high degree of slope along with high intensity of rainfall. The soil loss of low land or plane area is countable because of unsustainable Landuse pattern. Major findings are -
1) Average soil loss of the Nun watershed is 25-50 tons/ha/yr.
2) Major cause of soil erosion is high degree of slope, high intensity of rainfall and deforestation.
3) Highest soil loss area has been found on scrub land, fallow, barren land.
4) Lowest soil loss area has been found on dense forest.
CONFLICT OF INTERESTS
None.
ACKNOWLEDGMENTS
None.
REFERENCES
Adinarayana, J. Rao, K. G. Krishna, N. R. Venkatachalam, P. and Suri, J. K. (1999). A Rule Based Soil Erosion Model for a Hilly Catchment, 37, 309-318. https://doi.org/10.1016/S0341-8162(99)00023-5
Bhattacharya, S. K. (1997). Erosion Assessment of Rakti Basin of the Darjeeling Himalaya Indian J. Soil Conservation. 25(3), 173-176.
Bhushan, B. Khera, K. L. (2002). Characteristics and erosion risks rating of soils of Patiala-Ki -Rao -Watershed in the lower Shiwalic of Punjab- Indian Journal of Soil Conservation, 30(1).
Bonta, J. V. and Hamon, W. R. (1980). Preliminary Evaluations of a Sediment Pond Draining a Surface Mined Watershed. Symposium on Surface Mining Hydrology, Sedimentology and Reclamation, University of Kentucky, Lexington, 371-381.
CGWB, (2009). Central Ground Water Board (CGWB), Uttaranchal Region, Ministry of Water Resources, Government of India, Delhi.
Desmet, P. J. J. and Govers G. (1996). A GIS Procedure for Automatically Calculating the USLE LS Factor on Topographically Complex Landscape Units ; J. Soil Water Conservation. 51, 427-433.
Doidato, N. (2004). Estimating RUSLE's Rainfall Factor in the Part of Italy with Mediterranean Rainfall Regime, Hydrology and Earth System Sciences. 8(1), 103-107. https://doi.org/10.5194/hess-8-103-2004
Dutta, P. (1999). Estimation of Soil Erosion Loss & Landuse Planning using Remote Sensing & GIS, Post Graduate Diploma Report, 181-186.
Jain, M. K. Kothyari, U. C. (2000). Estimation of soil erosion and sediment yield using GIS. Hydrol Sci, 45(4), 771-786. https://doi.org/10.1080/02626660009492376
Mohamed, M. and Aggarwal, S. (1997). Application of Remote Sensing and GIS on Soil Erosion Assessment at Bata River Basin, India, ACRS, Proceedings.
Saha, S. K. Bhatacharjee, J. Lalengzuva, C. and Pende, L. M. (1992). Prioritization of sub watersheds based on erosion loss estimates - A Case Study of Part of Song, River Watershed, Doon Valley Using Digital Satellite Data. Proc. National Symposium on, Remote Sensing for Sustainable Development, 181-186.
Saha, S.K. Kudrat, M. and Bhan, S. K. (1990). Digital Processing of Landsat-TM Data for Watershed Mapping Parts of Aligarh Districts (U.P), India. Int. J. Remote Sensing, 11(3), 485-492. https://doi.org/10.1080/01431169008955034
Shrestha, D. P. (1997). Assessment of soil erosion in the nepalese himalaya, A case study in likhu khola valley, middle mountain Region. Land Husbandry, 2(1),59-80.
Shrimalia, S. S. Aggarwalb, S. P. and Samraa, J. S. (2001). Prioritizing erosion-prone areas in hills using remote sensing and GIS - a case study of the Sukhna Lake catchment, Northern India, International Journal of Applied Earth Observation and Geoinformation, 3(1), 54-60. https://doi.org/10.1016/S0303-2434(01)85021-2
Stone, R.P. Hillborn, D. (2002). Universal Soil Loss Equation, Ontario, Canada. Ontario Ministry of Agriculture and Food (OMAFRA).
Tripathi, M. P. Panda, R. K. Pradhan, S. and Sudhakar, S. (2002). Runoff Modelling of a Small Watershed using Satellite Data and GIS. J of Ind. Society of Remote Sensing 30(2), 39-52. https://doi.org/10.1007/BF02989975
Wischmeier, W. H. and Smith, D.D. (1965). Prediction Rainfall Erosion Losses from Cropland East of the Rocky Mountains : A Guide for Selection of Practices for Soil and Water Conservation. Agricultural Handbook, 282, 47.
 This work is licensed under a: Creative Commons Attribution 4.0 International License
© Granthaalayah 2014-2022. All Rights Reserved.