Original Article
Self-Esteem and Academic Achievement Among High School Students in Imphal East District, Manipur
|
Dr. Langonjam Chingkheinganba
Meitei 1 1 Faculty, Department of
Education, Manipur University, Canchipur, India 2 M.A. Human Rights, M.Ed. Independent
Researcher, India |
|
|
|
ABSTRACT |
||
|
Self-esteem refers to the overall perception of abilities and limitations of an individual. Although it may not directly visible to the outside world but often shows up a discipline, discipline and persistence, which are the essential attributes for academic success. Students with high self – esteem tend to be confident, willing and resilient even when facing academic challenges. The study aimed to assess the self-esteem of high school students in Imphal East district, Manipur. With regards to various socio demographics variables. The study focuses only on students enrolled in class ix and x in the academic session 2025. A total sample of 184 students was drawn using simple random sampling. The sample consisted of 144 female students and 40 male students, representing a diverse mix of learners from different social categories and school environments. Descriptive research method was employed in the study; researchers employed a self-constructed sociodemographic scale to collect the necessary background information. The examination result of the past annual examination was used as the indicator of academic achievement. The Rosenberg Self‑Esteem Scale Rosenberg (1965) was employed, the reliability coefficient obtained through Cronbach’s alpha (α = .698). Statistical techniques including descriptive statistics, inferential statistics and Pearson’s correlation coefficient were employed for data analysis. General objective of the study was to find the level of self-esteem. Specific objectives were to compare the self-esteem with regards to male and female, school difference, student status (non-orphan and orphan), school management, present place of residence (home, rented home, hostel and orphanage), academic achievement variation and the relationship between self-esteem and academic achievement. The study found that most students possessed a high sense of self-worth, majority of students fall within the second division category. Their academic performance indicates that there was neither extreme underachievement nor exceptionally high, Pearson’s correlation analysis revealed a very weak negative relationship (r = −0.073). This indicates that higher self-esteem not necessarily led to better academic achievement. Gender-wise comparisons further revealed that there was no statistically significant difference in self-esteem, residential settings, management of schools and academic achievement. Similarly, orphan and non-orphan shows similar levels of self – esteem. Keywords: Academic Achievement, High School
Students, Imphal, Manipur, Orphan Students |
||
INTRODUCTION
In today’s
educational environment, academic achievement has emerged as a tool to measure
where the individual stands. Student’s current learning status as well as
future prospects was assessed through the lens of his or her academic
performance. Across the educational system, excellence in academic achievement
was perceived as one of the primary educational goals, as it becomes the widely
accepted benchmark through which students’ potentials are examined. For
adolescents, particularly at the high school stage, academic performance
influences the students in constructing a stable perception of their abilities
and weaknesses.
Among the many
determinants that influence academic achievement, self-esteem occupies a vital
position. Self-esteem refers to the overall perception of abilities and
limitations of an individual. Although it may not directly visible to the
outside world but often shows up a discipline, discipline and persistence,
which are the essential attributes for academic success. Students with high
self – esteem tend to be confident, willing and resilient even when facing
academic challenges. However, students with low self – esteem may often fall in
the vicious loop of self-doubt which can slow their academic progress.
Numerous studies explored that the
relationship between self-esteem and academic achievement is reciprocal, as low
self -esteem can weaken a student’s desire to learn and repeated poor
performance may lower the self – esteem. On the other side, a positive spiral
can be created between high self -esteem and academic achievers, as high self –
esteem acts as a positive reinforcing factor for academic success. Recognizing
the importance of this relationship, the present study’s focus is on
understanding self-esteem and its association with academic achievement among
high school students in Imphal East District, Manipur.
Significance of the Study
Self-esteem has
been widely recognized as a crucial psychological element which is associated
with key parts of human behaviour such as emotional regulations, social
acceptance and interpersonal relationship. Individuals with high level of
self-esteem tend to be emotionally stable, confident and have positive attitude
towards life. On the contrary, low self-esteem often can lead to a negative
self-perception which can affect both personal and academic functioning. In the
field of education, self-esteem of a student exhibits in the form of readiness,
perseverance and positive approach to learning tasks.
During
adolescence, academic achievement plays an important factor in the development
of a positive self -image Erikson
(1968). However, different studies show that the
relationships between these variables are not always consistent across
different educational contexts. Therefore, the present study attempts to give
context spectrum insights by including students from diverse socio-economic
background including orphanages. The study attempts to help the policymakers in
creating inclusive educational policy.
Objectives
General Objective of the Study
To study the level
of self-esteem among high school students in Imphal East District.
Specific Objectives of the Study
1)
To
compare the self-esteem of male and female high school students.
2)
To
examine differences in the self-esteem of high school students with regard to
school difference.
3)
To
assess differences in the self-esteem of high school students based on student
status (non-orphan and orphan).
4)
To analyze differences in the self-esteem of high school
students with regard to school management.
5)
To
examine differences in the level of self-esteem among high school students with
regard to their present place of residence (home, rented home, hostel and
orphanage).
6)
To
examine differences in the level of self-esteem among high school students with
regard to their academic achievement.
7)
To
investigate the relationship between self-esteem and academic achievement among
high school students.
Hypotheses of the Study
H₀₁:
There is no significant difference in the self-esteem of male and female high
school students.
H₀₂:
There is no significant difference in the self-esteem of high school students
with regard to school difference.
H₀₃:
There is no significant difference in the self-esteem of high school students
based on student status (non-orphan and orphan).
H₀₄:
There is no significant difference in the self-esteem of high school students
with regard to school management.
H₀₅:
There exists no significance differences in the level of self-esteem among high
school students with regard to their present place of residence (home, rented
home, hostel and orphanage).
H₀₆:
There is no significant difference in the level of self-esteem among high
school students with regard to their academic achievement.
H₀₇:
There is no significant relationship between self-esteem and academic
achievement among high school students.
Delimitations of the Study
The study will be
limited to the high school students (Class IX and X) of selected schools within
the Imphal East District of Manipur. Therefore, the findings may not be
generalizable to other districts or states. The cross-sectional nature of the
study will identify a correlation between the variables but will not establish
a cause-and-effect relationship.
Method and Tools used in the Study:
The present study
aims to examine the self-esteem of among high school students. To achieve this
aim, a descriptive survey research design was adopted. A self-constructed
sociodemographic sheet was employed for the study. The examination result of
the past annual examination was used as the indicator of academic achievement.
The Rosenberg Self‑Esteem Scale Rosenberg
(1965) was employed to measure the self-esteem of
the students. to measure the internal consistency of the scale the researchers
calculated the reliability coefficient obtained through Cronbach’s alpha
(α = .698) indicated acceptable internal consistency for the scale.
Procedure of Data Collection
Permission was
obtained from the school authorities prior to data collection. The researcher
personally visited each selected school and explained the purpose of the study
to the students. The self-esteem scale and personal data sheet were
administered in a classroom setting under the researcher’s supervision.
Students were assured of confidentiality and encouraged to respond honestly.
Academic achievement data were collected from the school examination records
after obtaining necessary approval. All responses were checked, coded, and
organized systematically for analysis.
Statistical tools
such as descriptive statistics, inferential statistics and Pearson’s
correlation coefficient, were employed for data analysis and interpret
meaningfully.
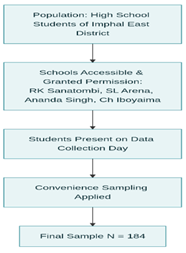
Population, Sample and Sampling method:
Students enrolled
in Class IX and X in high schools located in Imphal East District are the
population of the study. A total sample of 144 female students and 40 male
students (n=184) was drawn using simple random sampling, representing a diverse
mix of learners from different social categories and school environments. The
study employed a stratifies simple random sampling technique. Based on
accessibility and administrative permission schools were selected. Students
willing to participate and present on the day of data collection and were
included in the sample.
|
Table 1 |
|
Table 1 Sample of the Study |
|
|
School |
Number of Students |
|
RK Sanatombi
Devi Vidyalaya |
95 |
|
SL Arena of Learning |
48 |
|
Ananda Singh Higher
Secondary School |
24 |
|
Ch Iboyaima
High School |
17 |
|
Total |
184 |
|
The Sample Included 144
Female Students and 40 Male Students |
|
|
Figure1 |
|
|
|
Figure 1 Sampling Technique |
|
|
Analysis and Interpretation of Data
This section
presents the detailed analysis and interpretation of the data collected for the
study. The results are organized according to the specific objectives
formulated. Both descriptive and inferential statistical techniques have been
applied to examine.
General
Objective of the Study
To study the level
of self-esteem among high school students in Imphal East District.
|
Table 2 |
|
Table 2 Self-Esteem Level Distribution |
||||
|
Category |
N |
% |
Mean |
Std. Deviation |
|
High Self-Esteem |
135 |
73.40% |
1.27 |
0.46 |
|
Average Self-Esteem |
48 |
26.10% |
||
|
Low Self-Esteem |
1 |
0.50% |
||
|
Figure 2 |
|
|
|
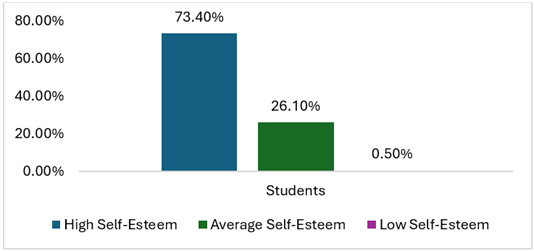
Figure 2 Level of self-esteem |
Interpretation: As shown in the Table 3, out of the total sample, a majority of
students (73.4%) fall under the high self-esteem category, indicating that most
high school students in Imphal East District possess a strong sense of
self-worth and confidence. This group shows a mean score of 1.27 with a
standard deviation of 0.46, suggesting moderate variability in their responses
but overall consistency in high self-esteem levels. Meanwhile, 26.1% of
students exhibit average self-esteem, reflecting a balanced but less confident
self-perception. Only 1 student (0.5%) was identified with low self-esteem,
which is statistically negligible in the overall distribution.
H₀₁: There is no significant difference in the
self-esteem of male and female high school students.
|
Table 3 |
|
Table 3 Group Statistics for Self Esteem by Gender |
||||
|
Gender |
N |
Mean |
Std. Deviation |
Std. Error Mean |
|
Female |
144 |
27.22 |
3.97 |
0.33 |
|
Male |
40 |
28.1 |
3.51 |
0.55 |
|
Table 4 |
|
Table 4 Independent Samples t-Test for Self Esteem by Gender |
|||||||||
|
Test |
F |
Sig. |
t |
df |
Sig. (2‑tailed) |
Mean Difference |
Std. Error Difference |
95% CI Lower |
95% CI Upper |
|
Equal variances assumed |
0.04 |
0.84 |
–1.277 |
182 |
0.2 |
–0.885 |
0.69 |
–2.252 |
0.48 |
|
Equal variances not assumed |
— |
— |
–1.370 |
69.32 |
0.18 |
–0.885 |
0.65 |
–2.173 |
0.4 |
Figure 3
|
|
|
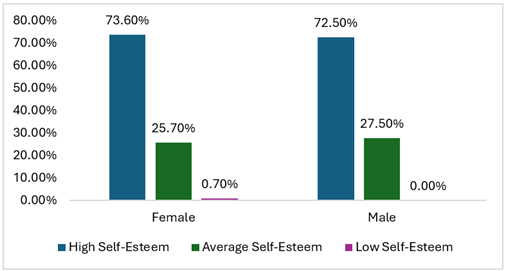
Figure 3 Self-Esteem by Gender |
Interpretation: Table 3 and Table 4 compared the self-esteem score between
female and male students to examine whether gender played a role in shaping
students’ self perceptions. Female students (n = 144)
reported a mean self esteem score of 27.22 (SD =
3.97), while male students (n = 40) showed a slightly higher mean of 28.10 (SD
= 3.51). Although males scored marginally higher, the difference between the
two groups was small. Levene’s test confirmed that the variances were similar
across genders (F = 0.040, p = .841), allowing the assumption of equal
variances. The independent samples t test further
indicated that the difference in mean scores was not statistically significant,
t (182) = –1.28, p = .203. The confidence interval for the mean difference
(–2.25 to 0.48) included zero, reinforcing that gender does not meaningfully
influence self esteem levels among the students.
Overall, the findings suggest that both female and male students possess
comparable levels of self esteem. Thus, the null
hypothesis (H₀₁) stating there is no significant difference in the
self-esteem of male and female high school students is retained.
H₀₂: There is no significant difference in the
self-esteem of high school students with regard to school difference.
|
Table 5 |
|
Table 5 Descriptive Statistics of Self Esteem Scores Across
Schools |
||||||||
|
School |
N |
Mean |
Std. Deviation |
Std. Error |
95% CI (Lower) |
95% CI (Upper) |
Min |
Max |
|
RK Sanatombi Devi Vidyalaya |
95 |
27.42 |
3.63 |
0.37 |
26.68 |
28.16 |
13 |
35 |
|
Ch. Iboyaima High School |
17 |
28.82 |
3.64 |
0.88 |
26.95 |
30.7 |
23 |
33 |
|
Ananda Singh Higher Secondary School |
24 |
27.04 |
3.3 |
0.67 |
25.65 |
28.44 |
20 |
34 |
|
SL Arena of Learning |
48 |
27.06 |
4.65 |
0.67 |
25.71 |
28.41 |
18 |
38 |
|
Total |
184 |
27.41 |
3.88 |
0.29 |
26.84 |
27.97 |
13 |
38 |
|
Table 6 |
|
Table 6 ANOVA Summary for Self Esteem Scores Across Schools |
|||||
|
Source |
Sum of Squares |
df |
Mean Square |
F |
Sig. |
|
Between Groups |
43.03 |
3 |
14.34 |
0.95 |
0.417 |
|
Within Groups |
2715.4 |
180 |
15.09 |
||
|
Total |
2758.43 |
183 |
|||
|
Figure 4 |
|
|
|
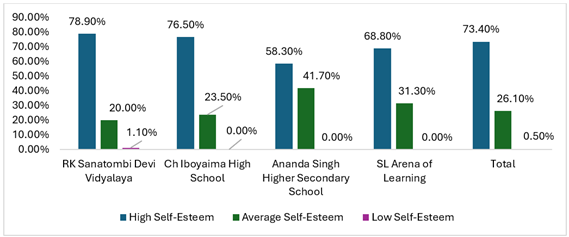
Figure 4 Self-Esteem Level of Students |
Interpretation: A one way analysis
was conducted to compare the self esteem scores of
students across four schools in Imphal East District. Table 5 values show that mean self
esteem scores were relatively similar across institutions.
Students from RK Sanatombi Devi Vidyalaya (n = 95) recorded a mean self esteem score of 27.42 (SD = 3.63), with a 95%
confidence interval ranging from 26.68 to 28.16. Students from Ch. Iboyaima High School (n = 17) showed a slightly higher mean
score of 28.82 (SD = 3.64), with a confidence interval of 26.95 to 30.70.
Students from Ananda Singh Higher Secondary School (n = 24) had a mean score of
27.04 (SD = 3.30), with a confidence interval between 25.65 and 28.44. Students
from SL Arena of Learning (n = 48) reported a mean of 27.06 (SD = 4.65), with a
confidence interval of 25.71 to 28.41. Taken together, the distribution and
mean scores indicate that self-esteem among high school students in the
district is generally strong, with most students demonstrating high self-esteem
and very few showing signs of low self-worth.
Across all schools
combined (N = 184), the overall mean self esteem
score was 27.41 (SD = 3.88), with a standard error of 0.29 and a 95% confidence
interval ranging from 26.84 to 27.97. Scores ranged from 13 to 38, indicating a
wide distribution of self esteem levels among
students.
A one way ANOVA was conducted to determine whether self esteem scores differed significantly across the four
schools Table 6. The analysis revealed that the differences
in mean self esteem scores were not statistically
significant, F(3, 180) = 0.95, p = .417. This
indicates that students’ self esteem levels did not
vary meaningfully based on the school they attended.
Self
esteem scores were
comparable across the four schools, with no statistically significant
differences observed. Although minor variations in mean scores existed, these
differences were not large enough to suggest that school type had an impact on
students’ self esteem. So, the null hypothesis
stating there exists no significance difference is not retained.
H₀₃: There is no significant difference in the
self-esteem of high school students based on student status (non-orphan and
orphan).
|
Table 7 |
|
Table 7 Group Statistics for Self Esteem by Student Type |
||||
|
Student Type |
N |
Mean |
Std. Deviation |
Std. Error Mean |
|
Non‑Orphan |
173 |
27.39 |
3.9 |
0.3 |
|
Orphan |
11 |
27.64 |
3.7 |
|
|
Table 8 |
|
Table 8 Independent Samples t Test
for Self Esteem by Student Type |
|||||||||
|
Test |
F |
Sig. |
t |
df |
Sig. (2‑tailed) |
Mean Difference |
Std. Error Difference |
95% CI Lower |
95% CI Upper |
|
Equal variances assumed |
0.06 |
0.8 |
–0.201 |
182 |
0.84 |
–0.243 |
1.21 |
–2.632 |
2.15 |
|
Equal variances not assumed |
— |
— |
–0.211 |
11.47 |
0.84 |
–0.243 |
1.15 |
–2.769 |
2.28 |
|
Figure 5 |
|
|
|
Figure 5 Self-Esteem Level by Student Type |
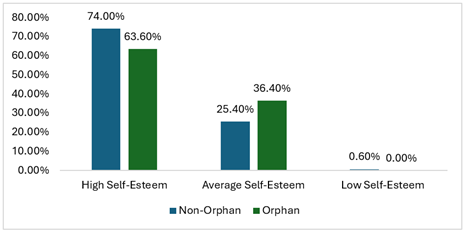
Interpretation: Self esteem scores
were compared between non orphan and orphan students (Table 7). Non orphan students (n = 173) had a mean self esteem score of 27.39 (SD = 3.90), while orphan
students (n = 11) had a slightly higher mean of 27.64 (SD = 3.70). The means
were very close, indicating similar self esteem
levels across the two groups.
Levene’s test (Table 8) showed that the variances between the
groups were not significantly different, F = 0.06, p = .803, supporting the
assumption of equal variances. The independent samples t
test further showed no significant difference in self esteem
between non orphan and orphan students, t(182) =
–0.20, p = .841. The mean difference (–0.243) was small, and the 95% confidence
interval (–2.63 to 2.15) included zero, confirming the absence of meaningful
difference.
Overall, the
findings indicate that student type (orphan vs. non orphan) does not
significantly influence self esteem levels among high
school students in the district. Hence, the null hypothesis (H₀₃)
stating there is no significant difference in the self-esteem of high school
students based on student status (non-orphan and orphan) is accepted.
H₀₄: There is no significant difference in the
self-esteem of high school students with regard to school management.
|
Table 9 |
|
Table 9 Group Statistics for Self Esteem by School Management |
||||
|
Management Type |
N |
Mean |
Std. Deviation |
Std. Error Mean |
|
Government |
41 |
27.78 |
3.52 |
0.55 |
|
Private |
143 |
27.3 |
3.99 |
0.33 |
|
Table 10 |
|
Table 10 Independent Samples t Test
for Self Esteem by School Management |
|||||||||
|
Test |
F |
Sig. |
t |
df |
Sig. (2‑tailed) |
Mean Difference |
Std. Error Difference |
95% CI Lower |
95% CI Upper |
|
Equal variances assumed |
0.001 |
0.971 |
0.697 |
182 |
0.487 |
0.48 |
0.689 |
–0.879 |
1.839 |
|
Equal variances not assumed |
— |
— |
0.747 |
72.114 |
0.458 |
0.48 |
0.643 |
–0.801 |
1.761 |
|
Figure 6 |
|
Figure 6 Self-Esteem Level of Students by
Management |
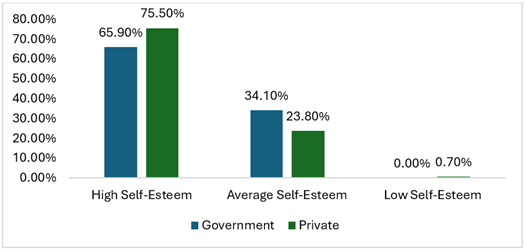
Interpretation: The self esteem
scores of high school students were compared across two types of school
management: government and private (Table 9 and Table 10). Students from government schools (n = 41)
had a mean self esteem score of 27.78 (SD = 3.52),
while those from private schools (n = 143) had a mean score of 27.30 (SD =
3.99). Although the government school group showed a slightly higher mean, the
difference between the two groups was small. Levene’s test indicated that the
variances were equal across groups (F = 0.001, p = .971), allowing the use of
the equal variance t test. The independent samples t
test revealed that the difference in self esteem between
government and private school students was not statistically significant, t(182) = 0.697, p = .487. The 95% confidence interval for
the mean difference (–0.879 to 1.839) included zero, confirming the absence of
a meaningful difference. Therefore, the null hypothesis (H₀₄),
which states that there is no significant difference in the self
esteem of high school students with regard to school management, is
retained.
H₀₅: There exists no significance differences in
the level of self-esteem among high school students with regard to their
present place of residence (home, rented home, hostel and orphanage).
|
Table 11 |
|
Table 11 Descriptive Statistics of Self
Esteem by Present Place of Residence |
||||||||
|
Place of Residence |
N |
Mean |
Std. Deviation |
Std. Error |
95% CI Lower |
95% CI Upper |
Min |
Max |
|
Home |
127 |
27.57 |
3.83 |
0.34 |
26.9 |
28.25 |
18 |
38 |
|
Rented Home |
11 |
28.91 |
3.21 |
0.97 |
26.75 |
31.06 |
23 |
33 |
|
Hostel |
35 |
26.26 |
4.2 |
0.71 |
24.82 |
27.7 |
13 |
34 |
|
Children Home |
11 |
27.64 |
3.7 |
1.11 |
25.15 |
30.12 |
23 |
33 |
|
Total |
184 |
27.41 |
3.88 |
0.29 |
26.84 |
27.97 |
13 |
38 |
|
Table 12 |
|
Table 12 ANOVA Summary for Self Esteem by
Place of Residence |
|||||
|
Source |
Sum of Squares |
df |
Mean Square |
F |
Sig. |
|
Between Groups |
75.25 |
3 |
25.08 |
1.68 |
0.17 |
|
Within Groups |
2683.18 |
180 |
14.91 |
||
|
Total |
2758.43 |
183 |
|||
|
Figure 7 |
|
Figure 7 Self-Esteem Level by Type of
Present Address |
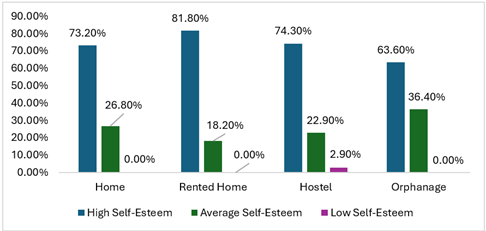
Interpretation: Self esteem scores
were compared across four categories of present place of residence: home,
rented home, hostel, and children’s home (Table 13). Students residing at home (n = 127) had a
mean self esteem score of 27.57 (SD = 3.83), while
those in rented homes (n = 11) showed a slightly higher mean of 28.91 (SD =
3.21). Students living in hostels (n = 35) reported a lower mean score of 26.26
(SD = 4.20), and those in children’s homes (n = 11) had a mean of 27.64 (SD =
3.70). Although the means varied slightly, the overall pattern suggests broadly
similar levels of self esteem across residence types.
A one way ANOVA was conducted to determine whether these
differences were statistically significant (Table 14). The results indicated no significant
difference in self esteem based on place of
residence, F (3, 180) = 1.68, p = .172. The confidence intervals for each group
overlapped substantially, and the between group variance was small relative to
within group variance.
The findings
indicate that present place of residence does not significantly influence self esteem among high school students in the sample.
Despite minor variations in mean scores, students across all residential
settings demonstrated comparable levels of self esteem.
Thus, the null hypothesis (H₀₅) stating there exists no
significance differences in the level of self-esteem among high school students
with regard to their present place of residence (home, rented home, hostel and
orphanage) is accepted.
H₀₆: There is no significant difference in the
level of self-esteem among high school students with regard to their academic
achievement.
|
Table 13 |
|
Table 13 Descriptive Statistics of Self Esteem by Academic
Achievement |
||||||||
|
Academic Achievement |
N |
Mean |
Std. Deviation |
Std. Error |
95% CI Lower |
95% CI Upper |
Min |
Max |
|
1st Division |
84 |
27.86 |
3.77 |
0.41 |
27.04 |
28.67 |
18 |
35 |
|
2nd Division |
69 |
26.87 |
4.24 |
0.51 |
25.85 |
27.89 |
13 |
38 |
|
3rd Division |
31 |
27.39 |
3.26 |
0.59 |
26.19 |
28.58 |
19 |
33 |
|
Total |
184 |
27.41 |
3.88 |
0.29 |
26.84 |
27.97 |
13 |
38 |
|
Table 14 |
|
Table 14 ANOVA Summary for Self Esteem by Academic Achievement |
|||||
|
Source |
Sum of Squares |
df |
Mean Square |
F |
Sig. |
|
Between Groups |
36.963 |
2 |
18.481 |
1.229 |
0.295 |
|
Within Groups |
2721.467 |
181 |
15.036 |
||
|
Total |
2758.429 |
183 |
|||
|
Figure 8 |
|
|
|
Figure 8 Self-Esteem Level by Student by
Academic Achievement |
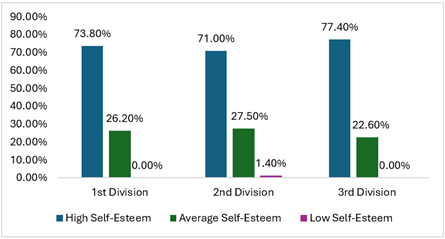
Interpretation: Self esteem scores
were compared across three academic achievement groups (Table 13): 1st Division, 2nd Division, and 3rd
Division. Students in the 1st Division (n = 84) had a mean self
esteem score of 27.86 (SD = 3.77), while those in the 2nd Division (n =
69) had a slightly lower mean of 26.87 (SD = 4.24). Students in the 3rd
Division (n = 31) reported a mean score of 27.39 (SD = 3.26). Although the
means varied slightly, the differences were small and showed substantial
overlap in confidence intervals.
A one way ANOVA was conducted to determine whether these
differences were statistically significant (Table 14). The results indicated no significant
difference in self esteem across the three academic
achievement groups, F(2, 181) = 1.23, p = .295. The
between group variance was minimal compared to the within group variance,
suggesting that academic division does not meaningfully influence self esteem.
Self
esteem levels among high
school students do not differ significantly based on academic achievement (1st,
2nd, or 3rd Division). Despite minor variations in mean scores, students across
all achievement levels demonstrated comparable levels of self
esteem. Thus, the null hypothesis (H₀₆) which states there
is no significant difference in the level of self-esteem among high school
students with regard to their academic achievement is retained.
H₀₇: There is no significant relationship between
self-esteem and academic achievement among high school students.
|
Table 15 |
|
Table 15 Descriptive Statistics and Pearson Correlation Between
Self Esteem and Academic Achievement (N = 184) |
||||
|
Variable |
Mean |
SD |
1 |
2 |
|
1. Self‑Esteem Total
Score |
27.41 |
3.88 |
1 |
−0.073 |
|
2. Academic Achievement |
1.71 |
0.74 |
−0.073 |
1 |
|
Sig. (2‑tailed) |
— |
— |
— |
0.323 |
|
N |
184 |
184 |
184 |
184 |
|
Note. SD = Standard Deviation.
Pearson Correlation Coefficients are Shown Above the Diagonal, Significance
Values are Shown Below |
||||
Interpretation: Table 15 presents the descriptive statistics and
Pearson correlation between self-esteem and academic achievement among high
school students. The mean self-esteem score was M = 27.41 (SD = 3.88),
indicating generally moderate to high levels of self-esteem in the sample. The
mean academic achievement score was M = 1.71 (SD = 0.74), reflecting mid level performance on the three
division scale.
The Pearson
correlation coefficient between self-esteem and academic achievement was r =
−0.073, a weak negative relationship that was not statistically
significant (p = .323). This suggests that variations in self-esteem were not
associated with corresponding changes in academic achievement. In practical
terms, students with higher or lower self-esteem did not differ meaningfully in
their academic performance.
Given that the
obtained p value exceeds the .05 significance threshold, the null hypothesis -
stating that there is no significant relationship between self-esteem and
academic achievement among high school students is accepted. Thus, the findings
indicate that self-esteem does not function as a significant correlate or
predictor of academic achievement in this sample. So, the null hypothesis
(H₀₇) stating there is no significant relationship between
self-esteem and academic achievement among high school students is not
rejected.
Major Findings and Discussion
The findings of
the present study show the overall level of self- esteem among high school
students was high, as 73.4% of the students exhibit high self-esteem, 26.1%
show average self-esteem, and only 0.5% fall under low self-esteem. This
suggests that most students possessed a high sense of self-worth and it can be
further enhanced through a supportive academic environment.
Similarly, the
academic achievement of high school students in Imphal East District was
average. The finding showed that majority of students fall within the second
division category. Their academic performance indicates that there was neither
extreme underachievement nor exceptionally high achievement among most
students.
With regard to the
relationship between self-esteem and academic achievement, Pearson’s
correlation analysis revealed a very weak negative relationship (r =
−0.073). This indicates that higher self-esteem not necessarily led to
better academic achievement. Therefore, other factors such teaching methods,
curriculum and learning environment may also have influenced the academic
achievement rather than self-esteem alone.
Gender-wise
comparisons further revealed that there was no statistically significant
difference in self-esteem between male and female students. Similarly, no
significant difference was found in academic achievement between male and
female students. This indicates that gender does not play a substantial role in
influencing either self-esteem or academic performance.
Residential -wise
comparisons in the study revealed that student’s residential settings do not
have a significant influence on the self – esteem. Similarly, orphan and
non-orphan shows similar levels of self – esteem. The study further revealed no
significant difference in self-esteem across type of school and school
management. This suggests that similar
educational environment as well as common learning experiences may have
minimized the disparities among the students.
Overall, the
results highlight that the relationship between self-esteem and academic
achievement is not reciprocal. This indicates that other instructional and
contextual factors also play a key role in the academic success of a student.
Conclusion
The present shows
that the relationship between self-esteem and academic achievement is neither
direct nor linear. This indicated that differences in the level of self-esteem
do not necessarily correspond with better academic achievements of the students.
Overall, the study found that the need of educators and policy makers to adopt a
holistic approach for addressing students emotional and academic needs.
Strengthening supportive school environment can contribute to overall
well-being of the students, especially those from diverse socio-economic
backgrounds, including those in institutional care.
ACKNOWLEDGMENTS
None.
REFERENCES
Al-Zoubi, S. M., and Younes, M. A. B. (2015). The Relationship Between Self-Esteem and the
Academic Achievement of Umm Al-Qura University Students.
International Journal of Education and Social Science, 2(12), 1–13.
Arshad, M., Zaidi, S. M. I. H., and Mahmood, K. (2015). Self-Esteem and Academic Performance Among University Students. Journal of Education and Practice, 6(1), 156–162.
Baumeister, R. F., Campbell, J. D., Krueger, J. I., and Vohs, K. D. (2003). Does High Self-Esteem Cause Better Performance, Interpersonal Success, Happiness, or Healthier Lifestyles? Psychological Science in the Public Interest, 4(1), 1–44. https://doi.org/10.1111/1529-1006.01431
Branden,
N. (1994). The
Six Pillars of Self-Esteem. Bantam Books.
Coopersmith, S. (1967). The Antecedents of Self-Esteem. W. H. Freeman.
Crocker, J., and Wolfe, C. T. (2001). Contingencies of Self-Worth. Psychological Review, 108(3), 593–623. https://doi.org/10.1037/0033-295X.108.3.593
Devi,
M. S. (2017).
Self-Esteem and Academic Achievement
of Secondary School Students
in West Siang District of Arunachal Pradesh.
International Journal of Advanced Educational Research, 2(4), 132–135.
Erikson, E. H. (1968). Identity: Youth and Crisis. W. W. Norton and Company.
Greenwald, A. G., and Farnham, S. D. (2000). Using the Implicit Association Test to Measure Self-Esteem and Self-Concept. Journal of Personality and Social Psychology, 79(6), 1022–1038. https://doi.org/10.1037/0022-3514.79.6.1022
Harter, S. (1999). The Construction of the Self: A Developmental Perspective. Guilford Press.
James, W. (1890). The Principles of Psychology (Vols. 1–2). Henry Holt. https://doi.org/10.1037/10538-000
Marsh, H. W., and Craven, R. G. (2006). Reciprocal Effects of Self-Concept and Performance from a Multidimensional Perspective: Beyond Seductive Pleasure and Unidimensional Perspectives. Perspectives on Psychological Science, 1(2), 133–163. https://doi.org/10.1111/j.1745-6916.2006.00010.x
Mruk,
C. J. (2006).
Self-esteem Research,
Theory, and Practice: Toward a Positive Psychology of
Self-Esteem (3rd ed.).
Springer Publishing.
Rogers, C. R. (1951). Client-Centered Therapy: Its Current Practice, Implications, and Theory. Houghton Mifflin.
Rosenberg, M. (1965). Society and the Adolescent Self-Image. Princeton University Press. https://doi.org/10.1515/9781400876136
Rosli, Y., Othman, H., Ishak, I., and Lubis, S. H. (2017). The Relationship Between Self-Esteem and Academic Achievement Among Nursing Students. Education in Medicine Journal, 9(2), 65–72. https://doi.org/10.21315/eimj2017.9.2.7
Santrock,
J. W. (2018).
Adolescence (17th ed.). McGraw-Hill Education.
Seligman, M. E. P. (2011). Flourish: A Visionary New Understanding of Happiness and Well-Being. Free Press.
Tafarodi, R. W., and Swann, W. B. (2001). Two-Dimensional Self-Esteem: Theory and Measurement. Personality and Individual Differences, 31(5), 653–673. https://doi.org/10.1016/S0191-8869(00)00169-0
Twenge, J. M., and Campbell, W. K. (2002). Self-Esteem and Socioeconomic Status: A Meta-Analytic Review. Personality and Social Psychology Review, 6(1), 59–71. https://doi.org/10.1207/S15327957PSPR06013
University of Maryland, Department of Sociology. (2025). Using the Rosenberg Self-Esteem Scale.
Wani, M. A. (2018). A Study of Self-Esteem and Academic Achievement of Secondary School Students. The International Journal of Indian Psychology, 6(1), 164–170. https://doi.org/10.25215/0601.018
 This work is licensed under a: Creative Commons Attribution 4.0 International License
© Granthaalayah 2014-2025. All Rights Reserved.