Determinants of Implementation Success in India's Smart Cities Mission: A National Comparative Analysis
Dr. Amit Jaiswal 1![]()
1 Assistant Professor, Department of
Economics, Government Girls' PG College, Bindki, Fatehpurs
|
|
|
ABSTRACT |
|
|
This study
presents a comprehensive analysis of implementation outcomes across all 100
cities under India's Smart Cities Mission (SCM), examining 7,983 projects
worth Rs. 181,490 crore as of July 2023. Using
regression analysis and comparative methods, we identify key determinants of
success in urban infrastructure implementation. Our findings reveal
significant variation in completion rates (11.8% to 100%), with South Indian
cities achieving 78.8% average completion compared to 53.3% in East and
Northeast India. The analysis demonstrates that project scale and regional
institutional capacity are primary determinants of implementation success,
with an intriguing 'investment-implementation paradox' where 74.8% of
projects are completed but only 60.7% of investment is utilized. These
findings have important implications for urban policy design and federal
program management in India. |
|||
|
Received 11 June
2024 Accepted 15 July 2024 Published 31 August 2024 Corresponding Author Dr. Amit
Jaiswal, amitjaiswal007@gmail.com DOI 10.29121/granthaalayah.v12.i8.2024.6529 Funding: This research
received no specific grant from any funding agency in the public, commercial,
or not-for-profit sectors. Copyright: © 2024 The
Author(s). This work is licensed under a Creative Commons
Attribution 4.0 International License. With the
license CC-BY, authors retain the copyright, allowing anyone to download,
reuse, re-print, modify, distribute, and/or copy their contribution. The work
must be properly attributed to its author.
|
|||
|
Keywords: Smart Cities Mission, Urban Development,
Implementation Analysis, Regional Disparities, India, Infrastructure
Projects, Institutional Capacity |
|||
1. INTRODUCTION
India's Smart Cities Mission, launched in June 2015, represents one of the world's most ambitious urban transformation programs. With an initial budget of Rs. 48,000 crore and a mandate to develop 100 smart cities across India, the mission aimed to promote sustainable and inclusive urban development through technology-enabled infrastructure, efficient governance, and improved quality of life for citizens Ministry of Housing and Urban Affairs (2015).
As the mission approaches its original 2020 completion deadline (subsequently extended), questions about implementation efficacy have become increasingly urgent. While numerous studies have examined individual smart city projects or specific thematic areas, there exists a critical gap in comprehensive, nationwide analysis of implementation outcomes across the entire portfolio of 100 cities. This study addresses that gap by analyzing project-level data covering all 100 smart cities, encompassing 7,983 projects with a cumulative investment of Rs. 181,490 crore as of July 2023.
The central research question driving this analysis is: What factors determine implementation success in India's Smart Cities Mission? More specifically, we examine: (1) How do completion rates vary across regions, city sizes, and project characteristics? (2) What role does project scale and complexity play in implementation outcomes? (3) Why does investment completion lag behind project completion? (4) What lessons can be derived for future urban development programs in India and similar contexts?
Our analysis reveals substantial variation in implementation outcomes, with completion rates ranging from 11.8% (Shillong) to 100% (Madurai), and significant regional disparities. Through regression analysis, we identify project scale and regional institutional capacity as primary determinants of success, while uncovering an 'investment-implementation paradox' where physical completion outpaces financial utilization. These findings carry important implications for urban policy design, federal program management, and the broader discourse on smart city development in emerging economies.
2. LITERATURE REVIEW
2.1. Smart Cities and Urban Development in India
The concept of 'smart cities' has evolved significantly since its emergence in the early 2000s, transitioning from a technology-centric framework to a more holistic approach encompassing governance, sustainability, and citizen participation Hollands (2008), Albino et al. (2015). In the Indian context, the Smart Cities Mission represents a distinctive blend of infrastructure modernization, digital governance, and sustainable urban planning Praharaj et al. (2018).
Scholarly analysis of India's Smart Cities Mission has highlighted several critical dimensions. Datta (2015) critiques the mission's emphasis on technology and private sector participation, arguing that it may exacerbate existing urban inequalities. Praharaj and Han (2019) examine the mission's governance architecture, noting the creation of Special Purpose Vehicles (SPVs) as an innovative institutional mechanism, though implementation challenges persist. Sivaramakrishnan (2015) situates the mission within India's broader urban policy trajectory, emphasizing the shift toward competitive federalism and performance-based funding allocation.
2.2. Implementation Challenges in Urban Infrastructure Projects
The literature on infrastructure project implementation in developing countries identifies several recurring challenges: institutional capacity constraints Gupta et al. (2015), inter-governmental coordination failures Jha et al. (2007), land acquisition difficulties Chakravorty (2013), and resource mobilization bottlenecks Mohanty et al. (2007). These challenges are particularly acute in urban infrastructure projects, where multiple stakeholders, complex regulatory environments, and political economy considerations intersect Kundu (2011).
Recent evaluations of the Smart Cities Mission have documented implementation delays across various cities. Comptroller and Auditor General of India. (2022) reported that only 24.6% of projects were completed by March 2021, attributing delays to procurement issues, land acquisition challenges, and capacity constraints at the Urban Local Body (ULB) level. Journalist analyses suggest that cities with stronger pre-existing institutional capacity and political stability demonstrate better implementation outcomes Down To Earth. (2023).
2.3. Regional Variations in Urban Governance
India's federal structure creates significant regional variation in urban governance capacity. Southern states generally demonstrate stronger fiscal management, more effective urban local bodies, and better service delivery outcomes compared to northern and eastern states Rao (2013), Mohanty (2016). This regional divergence in institutional capacity has important implications for centrally-sponsored urban programs like the Smart Cities Mission.
Historical factors contribute to these regional disparities. Southern states benefited from earlier reforms in urban governance, stronger traditions of municipal administration from the colonial period, and more stable political environments conducive to long-term planning Sivaramakrishnan (2011). In contrast, cities in Eastern and Northeastern India face challenges including weaker municipal finances, limited technical capacity, and political instability Shaw and Satish (2007).
2.4. Research Gap
While existing literature provides valuable insights into specific aspects of the Smart Cities Mission, there remains a critical gap: comprehensive, nationwide analysis of implementation outcomes using project-level data across all 100 cities. Most studies focus on individual cities or small samples, limiting generalizability. Moreover, quantitative analysis identifying determinants of implementation success—particularly the role of project characteristics, regional factors, and institutional capacity—remains limited. This study addresses these gaps through comprehensive empirical analysis of the entire Smart Cities Mission portfolio.
3. DATA AND METHODOLOGY
3.1. Data Source
This study utilizes comprehensive project-level data from the Smart Cities Mission management information system, covering all 100 smart cities as of July 7, 2023. The dataset encompasses 7,983 projects with a cumulative approved investment of Rs. 181,490 crore. For each city, the data includes:
· Total number of projects and their aggregate cost
· Number of completed projects and completed investment
· Number of ongoing projects and ongoing investment
· State/UT affiliation for each city
The data reflects the official status reported through the mission's monitoring framework, which tracks project milestones including DPR preparation, tendering, work order issuance, and completion. All monetary values are reported in Indian Rupees (crores).
3.2. Variables and Metrics
We construct several key metrics for analysis:
Completion Rate (%) = (Completed Projects / Total
Projects) × 100
Investment Completion (%) = (Completed Investment /
Total Investment) × 100
Average Project Cost = Total Investment / Total
Projects
Efficiency Gap = Completion Rate (%) - Investment
Completion (%)
We categorize cities into four size groups based on total number of projects: Small (<50 projects), Medium (50-100), Large (100-200), and Very Large (>200). Regional classification follows India's conventional geographic divisions: North, South, West, East & Northeast, with residual island territories categorized as 'Other'.
3.3. Analytical Methods
Our analysis employs multiple complementary methods:
3.3.1. Descriptive Analysis
We compute summary statistics for completion rates, investment patterns, and project characteristics across regions and size categories. Distribution analysis examines variation in outcomes and identifies outlier cities.
3.3.2. Comparative Analysis
Regional and size-based comparisons identify patterns in implementation outcomes. We examine top and bottom performers to understand success and failure factors.
3.3.3. Regression Analysis
We employ Ordinary Least Squares (OLS) regression to identify determinants of completion rates. The dependent variable is the city-level completion rate (%), while independent variables include regional dummies, size category indicators, log of total projects, and log of average project cost. Three models are estimated:
· Model 1: Regional effects only (baseline)
· Model 2: Full model with regional, size, and project characteristics
· Model 3: Investment completion determinants
3.3.4. Efficiency Gap Analysis
We analyze the divergence between project completion and investment completion rates to understand the 'investment-implementation paradox' and its implications for project design and execution.
4. EMPIRICAL FINDINGS
4.1. National Overview
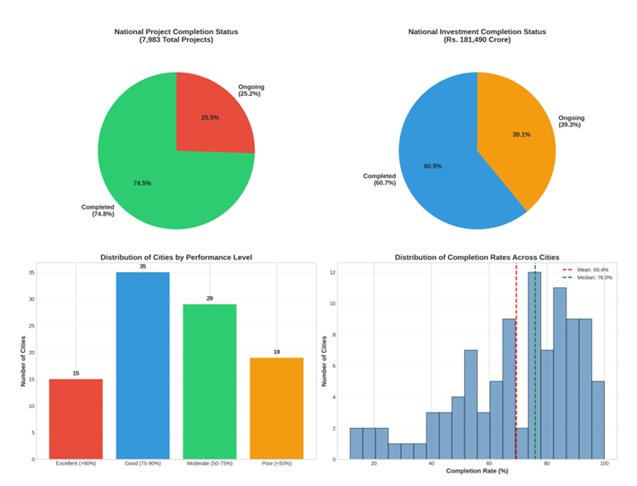
As of July 2023, India's Smart Cities Mission demonstrates substantial but uneven progress across its 100-city portfolio. Of 7,983 total projects worth Rs. 181,490 crore, 5,971 projects (74.8%) have been completed, representing Rs. 110,130 crore (60.7%) of approved investment. The remaining 2,012 projects (25.2%) worth Rs. 71,360 crore (39.3%) remain ongoing.
Figure 1 presents the national implementation status. The project completion rate of 74.8% substantially exceeds the investment completion rate of 60.7%, revealing what we term the 'investment-implementation paradox'—a systematic tendency for smaller, less expensive projects to achieve completion more readily than larger, costlier initiatives. This 14.1 percentage point gap carries significant implications for understanding implementation dynamics in large-scale urban programs.
Figure
1
|
Figure 1 National Project and Investment Completion Status |
The distribution of cities by performance level reveals considerable variation. Of the 98 cities analyzed (excluding 2 with data anomalies), 15 cities (15.3%) achieve 'Excellent' performance (>90% completion), 35 cities (35.7%) demonstrate 'Good' performance (75-90%), 29 cities (29.6%) show 'Moderate' performance (50-75%), and 19 cities (19.4%) exhibit 'Poor' performance (<50%). Only one city—Madurai in Tamil Nadu—has achieved 100% project completion.
Completion rates demonstrate substantial variation, ranging from 11.8% (Shillong, Meghalaya) to 100% (Madurai, Tamil Nadu)—an 88.2 percentage point spread. The mean completion rate is 69.4% with a standard deviation of 21.6%, while the median stands at 76.0%, suggesting a slight left skew in the distribution with more cities performing above the mean than below it.
4.2. Regional Variations
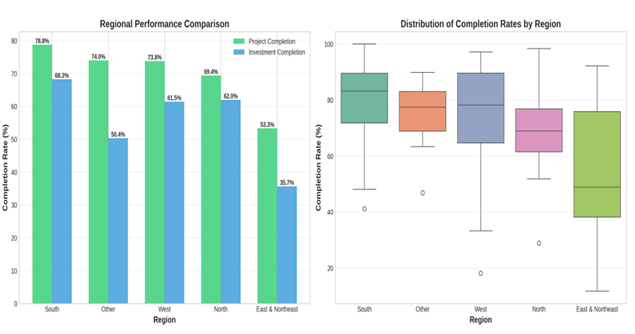
Regional analysis reveals stark disparities in implementation outcomes across India's geographic regions. Table 1 presents comprehensive regional statistics, while Figure 2 visualizes these patterns.
South India emerges as the clear leader with an average completion rate of 78.8%, followed by the 'Other' category (primarily island territories) at 74.0%, West India at 73.8%, North India at 69.5%, and East & Northeast India significantly trailing at 53.3%. This 25.5 percentage point gap between South and East & Northeast India represents one of the most significant findings of our analysis.
Figure
2
|
Figure 2 Regional Performance Comparison |
Several factors explain these regional disparities. Southern states benefit from stronger municipal finance systems, more professionalized urban local bodies, and longer traditions of effective urban governance Rao (2013). States like Tamil Nadu and Karnataka have historically invested in municipal capacity building and maintain more stable political environments conducive to long-term project implementation. In contrast, cities in Eastern and Northeastern states face structural disadvantages including weaker fiscal bases, limited technical capacity, and more volatile political conditions that disrupt project continuity.
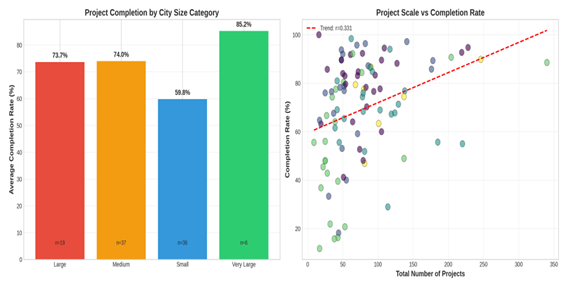
4.3. Project Scale and Size Effects
Analysis of project portfolios by city size reveals important patterns. Cities are categorized into four groups: Small (<50 projects), Medium (50-100), Large (100-200), and Very Large (>200 projects). Figure 3 illustrates these relationships.
Figure
3
|
Figure 3 Project Scale and Completion Rate Analysis |
Interestingly, Very Large cities (>200 projects) achieve the highest average completion rate at 85.3%, followed by Medium (74.0%) and Large (73.7%) cities, with Small cities trailing at 59.8%. This finding challenges conventional wisdom that smaller project portfolios are easier to implement. Instead, it suggests that cities with larger portfolios may benefit from economies of scale in institutional capacity, dedicated project management units, and sustained political attention that facilitates implementation.
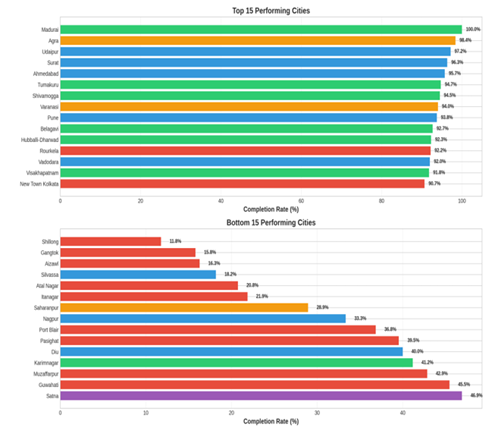
4.4. Top and Bottom Performers
Examining outlier cities provides insights into success and failure factors. Figure 4 presents the top 15 and bottom 15 performing cities.
Figure
4
|
Figure 4 Top 15 and Bottom 15 Performing Cities |
Among top performers, Madurai achieves perfect 100% completion across 16 projects worth Rs. 1,899.66 crore. Other exemplary cities include Agra (98.4%), Udaipur (97.2%), Surat (96.3%), and Ahmedabad (95.7%). Notably, 8 of the top 10 performers are located in South or West India, reinforcing regional patterns identified earlier. Among bottom performers, Shillong (11.8%), Gangtok (15.8%), Aizawl (16.3%), and Silvassa (18.2%) struggle with severe implementation challenges. All four bottom performers are small cities in hilly or island territories, suggesting that geographic isolation and limited institutional capacity create particularly acute implementation barriers.
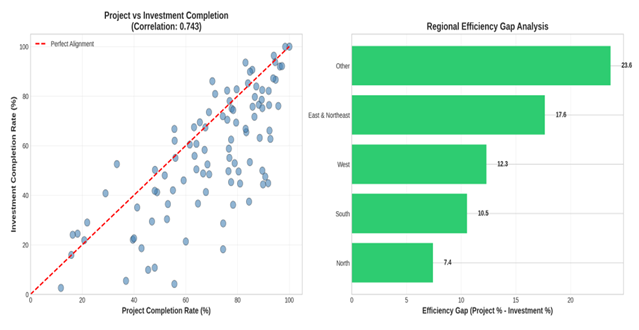
4.5. The Investment-Implementation Paradox
One of the most intriguing findings is the systematic divergence between project completion (74.8%) and investment completion (60.7%)—a gap of 14.1 percentage points. Figure 5 analyzes this phenomenon.
Figure
5
|
Figure 5 Investment-Implementation Efficiency Gap |
This efficiency gap varies significantly across regions. East & Northeast India shows the largest gap at 17.6 percentage points, followed by 'Other' territories (23.7 pp), West (12.3 pp), South (10.5 pp), and North (7.4 pp). The pattern suggests that completed projects systematically cost less than ongoing projects, implying that cities prioritize smaller, more manageable projects for quick wins while larger, more complex initiatives face implementation paralysis. This has important implications: while high project completion rates appear positive, the lower investment completion indicates that the most ambitious and potentially transformative projects remain unrealized.
4.6. Regression Analysis Results
To identify determinants of implementation success, we estimate three regression models. Table 1 presents the results.
Table 1
|
Table 1 Regression Analysis Results |
|||
|
Variable |
Model 1 |
Model 2 |
Model 3 (Inv) |
|
Intercept |
74.02*** |
-57.39** |
-105.79*** |
|
South India |
4.78 |
11.72 |
24.64** |
|
East & Northeast |
-20.70*** |
-4.90 |
0.92 |
|
Log(Projects) |
- |
18.05*** |
24.11*** |
|
Log(Avg Cost) |
- |
14.45*** |
16.25*** |
|
R-squared |
0.195 |
0.364 |
0.383 |
|
Adj. R-squared |
0.161 |
0.299 |
0.320 |
|
Note *** p<0.01, ** p<0.05, *
p<0.10. Reference Categories: Other Region, Small Size. |
|||
Model 1 demonstrates that regional effects alone explain 19.5% of variance in completion rates, with East & Northeast India showing a statistically significant 20.7 percentage point disadvantage (p<0.001). Model 2 incorporates project characteristics, improving explanatory power to 36.4%. Two variables emerge as highly significant: log of total projects (coefficient: 18.05, p<0.001) and log of average project cost (coefficient: 14.45, p<0.001). These positive coefficients indicate that cities with more projects and higher average costs achieve better completion rates, suggesting that institutional capacity and project ambition correlate with success. Model 3 examines investment completion, yielding similar patterns with even stronger effects for project scale variables.
5. DISCUSSION
5.1. Institutional Capacity as Primary Determinant
Our findings converge on a central conclusion: institutional capacity at the urban local body level is the primary determinant of Smart Cities Mission implementation success. This manifests through multiple channels:
· Regional Effects: The 25.5 percentage point gap between South and East & Northeast India reflects historical differences in municipal capacity, fiscal strength, and governance quality.
· Scale Effects: Cities with larger project portfolios demonstrate higher completion rates, suggesting economies of scale in capacity development.
· Project Ambition: Higher average costs correlate with better outcomes, indicating that capable cities undertake more ambitious projects.
This pattern aligns with broader literature on infrastructure implementation in developing countries, which emphasizes institutional quality over financial resources alone Gupta et al. (2015). The mission's design, which required cities to prepare Smart City Proposals and compete for funding, implicitly favored cities with existing capacity. While this competitive approach may have ensured better project quality, it also reinforced regional disparities rather than equalizing capacity across India's urban system.
5.2. The Investment-Implementation Paradox Explained
The systematic 14.1 percentage point gap between project and investment completion warrants careful interpretation. Several factors explain this phenomenon:
5.2.1. Strategic Project Selection
Cities prioritize smaller, less complex projects for early completion to demonstrate progress. LED streetlight installations, public WiFi deployment, and park renovations are quicker to implement than metro systems, smart grids, or comprehensive area development. This creates a portfolio bias toward completing numerous small projects while deferring larger, transformative initiatives.
5.2.2. Complexity and Risk
Large projects face greater complexity—multiple agency coordination, extensive land acquisition, sophisticated procurement, and technical challenges. These factors increase implementation risk and duration. Moreover, larger projects attract greater political and public scrutiny, potentially introducing additional delays.
5.2.3. Financing Mechanisms
The most expensive projects often involve Public-Private Partnerships (PPPs) or viability gap funding, which require complex financial structures and lengthy negotiation periods. Cities may struggle to structure viable PPPs or may face private sector reluctance for high-risk urban infrastructure projects, leading to implementation delays for large-value initiatives.
5.3. Policy Design Implications
These findings carry important implications for urban policy design in India and similar contexts. The mission's competitive structure, while ensuring quality, may have exacerbated regional inequities by channeling resources to already-capable cities. A more equitable approach would incorporate explicit capacity-building mechanisms for lagging regions. The East & Northeast disadvantage suggests need for differentiated implementation timelines, additional technical assistance, and perhaps higher central government funding shares for institutionally weaker cities. Furthermore, the investment-implementation paradox indicates that simply measuring project numbers may create perverse incentives. Policy frameworks should balance quick wins (small projects) with transformative impact (large projects), perhaps through separate tracking and incentive structures for different project scales.
6. POLICY RECOMMENDATIONS
Based on our analysis, we propose five key policy interventions:
6.1. Differentiated Support for Lagging Regions
Cities in East & Northeast India require tailored assistance addressing their specific constraints. Recommendations include: (a) Establishing a dedicated Technical Assistance Facility with expert teams deployed to low-performing cities; (b) Extending implementation timelines for lagging regions while maintaining accountability; (c) Increasing central government funding share from 50% to 75% for cities in low-capacity states; (d) Creating peer-learning networks pairing high and low performers for knowledge transfer.
6.2. Rebalancing Project Portfolios
To address the investment-implementation paradox, cities should be incentivized to progress on large, transformative projects rather than prioritizing easy wins. Specific measures: (a) Separate performance tracking for projects below and above Rs. 50 crore; (b) Bonus funding allocations for cities completing large-scale initiatives; (c) Mandatory inclusion of at least three 'anchor projects' exceeding Rs. 100 crore in each city's portfolio; (d) Enhanced central government oversight and support for mega-projects.
6.3. Institutional Capacity Building
Long-term success requires systematic capacity enhancement: (a) Establish mandatory training programs for SPV officials and ULB engineers; (b) Create centers of excellence in high-performing cities to serve as training hubs; (c) Develop standardized project implementation guidelines and templates to reduce reinvention; (d) Invest in GIS-based project monitoring systems for all cities.
6.4. Streamlining Approvals and Processes
Procedural delays constitute major bottlenecks: (a) Single-window clearance for smart city projects at state level; (b) Empowering SPVs with greater financial and administrative autonomy; (c) Standardizing environmental and technical approval processes; (d) Fast-tracking land acquisition through designated Smart City Land Banks.
6.5. Innovative Financing Mechanisms
To accelerate large project implementation: (a) Establish a Smart Cities Infrastructure Financing Facility with concessional terms for complex projects; (b) Develop standardized PPP models for common project types to reduce negotiation time; (c) Create a municipal bond market specifically for smart city infrastructure; (d) Explore alternative financing including land value capture and tax increment financing.
7. CONCLUSION
This study provides the first comprehensive, nationwide analysis of implementation outcomes in India's Smart Cities Mission, examining all 100 cities and 7,983 projects worth Rs. 181,490 crore. Our findings reveal substantial but highly uneven progress, with completion rates varying from 11.8% to 100% and stark regional disparities.
Three principal conclusions emerge. First, institutional capacity at the urban local body level is the primary determinant of implementation success, manifesting through regional patterns (South India 78.8% vs East & Northeast 53.3%) and scale effects (larger portfolios correlate with better outcomes). Second, an 'investment-implementation paradox' exists where project completion (74.8%) substantially exceeds investment completion (60.7%), suggesting systematic prioritization of smaller projects over transformative large-scale initiatives. Third, regression analysis confirms that project characteristics—particularly portfolio scale and average project cost—significantly predict completion rates, indicating that capacity and ambition drive success.
These findings carry important implications for urban policy in India and comparable contexts. The mission's competitive structure, while ensuring quality, appears to have reinforced rather than reduced regional capacity gaps. Future urban programs should incorporate explicit equity mechanisms, differentiated support for lagging regions, and balanced incentives that value transformative impact alongside implementation speed.
Several avenues for future research emerge from this analysis. First, detailed case studies of high and low performers could illuminate specific institutional practices and political economy factors underlying performance differences. Second, longitudinal analysis tracking cities over time would reveal whether capacity gaps narrow or persist as the mission matures. Third, citizen perception studies could assess whether completed projects actually improve quality of life and service delivery. Finally, comparative analysis with similar urban programs internationally would contextualize India's experience within broader patterns of urban infrastructure implementation in developing countries.
As India continues its rapid urbanization trajectory, the lessons from Smart Cities Mission implementation will prove crucial for designing future urban development programs. Our analysis suggests that success requires not merely financial resources but systematic attention to institutional capacity building, equitable support mechanisms, and careful balancing of implementation speed with transformative impact.
CONFLICT OF INTERESTS
None.
ACKNOWLEDGMENTS
None.
REFERENCES
Albino, V., Berardi, U., & Dangelico, R. M. (2015). Smart Cities: Definitions, Dimensions, Performance, and Initiatives. Journal of Urban Technology, 22(1), 3–21. https://doi.org/10.1080/10630732.2014.942092
Chakravorty, S. (2013). The Price of Land: Acquisition, Conflict, Consequence. Oxford University Press. https://doi.org/10.1093/acprof:oso/9780198089544.001.0001
Comptroller and Auditor General of India. (2022). Performance Audit on Smart Cities Mission (Report No. 18 of 2022).
Datta, A. (2015). New Urban Utopias of Postcolonial India: “Entrepreneurial Urbanization” in Dholera Smart City, Gujarat. Dialogues in Human Geography, 5(1), 3–22. https://doi.org/10.1177/2043820614565748
Down To Earth. (2023). Smart Cities Mission: Progress and Challenges.
Gupta, J., Pfeffer, K., Ros-Tonen, M., & Verrest, H. (2015). Geographies of Urban Governance: Advanced Theories, Methods and Practices. Springer. https://doi.org/10.1007/978-3-319-21272-2
Hollands, R. G. (2008). Will the Real Smart City Please Stand Up? City, 12(3), 303–320. https://doi.org/10.1080/13604810802479126
Jha, A. K., Bloch, R., & Lamond, J. (2012). Cities and Flooding: A Guide to Integrated Urban Flood Risk Management for the 21st century. World Bank. https://doi.org/10.1596/978-0-8213-8866-2
Kundu, A. (2011). Trends and Processes
of Urbanisation in India. IIED/UNFPA.
Ministry of Housing
and Urban Affairs. (2015).
Smart Cities Mission Statement and Guidelines. Government of India.
Mohanty, P. K. (2016). Financing Cities in India: Municipal Reforms, Fiscal Accountability
and Urban Infrastructure. SAGE Publications.
Mohanty, P. K., Misra, B. M., Goyal, R., & Jeromi, P. D. (2007). Municipal Finance in India: An Assessment. Reserve Bank of India.
Praharaj, S., & Han, H. (2019). Cutting Through the Clutter of Smart City Definitions: A Reading into the Smart City Perceptions in India. City, Culture and Society, 18, 100289. https://doi.org/10.1016/j.ccs.2019.05.005
Praharaj, S., Han, J. H., & Hawken, S. (2018). Towards the Right Model of Smart City Governance in India. International Journal of Sustainable Development and Planning, 13(2), 171–186. https://doi.org/10.2495/SDP-V13-N2-171-186
Rao, M. G. (2013). Resolving Fiscal Imbalances: Issues in Tax Sharing. In India: Public finance, Development and Governance (pp. 52–82). Oxford University Press.
Shaw, A., & Satish, M. K. (2007). Metropolitan Restructuring in Post-Liberalized India: Separating the Global and the Local. Cities, 24(2), 148–163. https://doi.org/10.1016/j.cities.2006.02.001
Sivaramakrishnan, K. C. (2011). Re-Visioning Indian Cities: The Urban Renewal Mission. SAGE Publications. https://doi.org/10.4135/9788132107859
Sivaramakrishnan, K. C. (2015). Revisiting the 74th Constitutional Amendment for Better Metropolitan Governance. Economic and Political Weekly, 50(13), 51–56.
 This work is licensed under a: Creative Commons Attribution 4.0 International License
© Granthaalayah 2014-2024. All Rights Reserved.