The Regional Divide in Smart Cities Implementation: A South-East Comparative Analysis
Dr. Amit Jaiswal 1![]()
1 Assistant Professor, Department of
Economics, Government Girls' PG College, Bindki, Fatehpur
|
|
|
ABSTRACT |
|
|
India's Smart
Cities Mission, launched in 2015, represents an ambitious attempt to
modernize urban infrastructure across 100 cities. However, implementation has
been highly uneven across regions. This paper examines the stark regional
disparities between South and East India, analyzing 49 cities covering 3,564
projects worth Rs. 73,876 crore as of July 2023. South India demonstrates a
completion rate of 78.8% compared to East India's 53.3%, representing a
statistically significant gap of 25.5 percentage points (p<0.001). Through
comparative analysis, this study identifies five key determinants of success:
institutional capacity of state governments and urban local bodies, political
stability and continuity, historical infrastructure investment patterns,
project design and scale optimization, and fiscal autonomy and resource
mobilization capabilities. The findings reveal that Karnataka (89.2%
completion) and Tamil Nadu (84.3%) lead South India through strong
state-level coordination, while Northeast states in East India face severe
capacity constraints with completion rates as low as 11.8% (Shillong). This
research contributes to understanding federal urban policy implementation in
India and provides evidence-based policy recommendations for bridging
regional disparities. The study has significant implications for the design
of future national urban development programs and highlights the critical
role of state capacity in determining implementation outcomes. |
|||
|
Received 07 October
2024 Accepted 08 November 2024 Published 31 December 2024 Corresponding Author Dr. Amit
Jaiswal, amitjaiswal007@gmail.com DOI 10.29121/granthaalayah.v12.i12.2024.6528 Funding: This research
received no specific grant from any funding agency in the public, commercial,
or not-for-profit sectors. Copyright: © 2024 The
Author(s). This work is licensed under a Creative Commons
Attribution 4.0 International License. With the
license CC-BY, authors retain the copyright, allowing anyone to download,
reuse, re-print, modify, distribute, and/or copy their contribution. The work
must be properly attributed to its author.
|
|||
|
Keywords: Smart Cities Mission, Regional
Disparities, Implementation Analysis, South India, East India, Urban
Governance, Institutional Capacity, Federal Urban Policy |
|||
1. INTRODUCTION
The Smart Cities Mission (SCM), launched by the Government of India in June 2015, represents one of the most ambitious urban development initiatives in the country's history. With an initial outlay of Rs. 48,000 crore and 100 cities selected across multiple rounds, the Mission aims to drive economic growth and improve quality of life through technology-enabled infrastructure, sustainable environment, and citizen participation Ministry of Housing and Urban Affairs. (2015). By July 2023, the Mission had generated 7,983 projects worth Rs. 181,489 crore, demonstrating significant scale-up from initial projections.
However, implementation has been highly uneven across India's diverse regions. While the national completion rate stands at 74.8%, this aggregate figure masks substantial regional variations. South India, comprising states like Karnataka, Tamil Nadu, Andhra Pradesh, Kerala, and Telangana, has achieved completion rates consistently above the national average. In stark contrast, East India, particularly the Northeast states, Bihar, and parts of Eastern India, struggles with completion rates significantly below 50%.
This research addresses a critical gap in understanding why such disparities exist in implementing a centrally-sponsored flagship program. Despite substantial central government funding and technical support, regional outcomes vary dramatically. This paper asks: What explains the 25.5 percentage point gap between South and East India's implementation success? What institutional, political, and economic factors drive these differences? And what policy interventions can bridge this divide?
The study focuses exclusively on South-East comparison for three reasons: (1) the magnitude of the performance gap demands focused analysis, (2) both regions contain diverse states allowing within-region variation analysis, and (3) findings can inform targeted policy interventions for East India's catch-up growth. By examining 49 cities across these two regions, representing 3,564 projects worth Rs. 73,876 crore, this research provides comprehensive empirical evidence on the determinants of Smart Cities Mission success and failure.
2. Literature Review
2.1. Smart Cities Implementation: Global and Indian Perspectives
The global smart cities movement has generated extensive scholarship on urban technology adoption, governance innovations, and implementation challenges Angelidou (2015), Hollands (2008). International experiences from Barcelona, Singapore, and Amsterdam highlight the importance of institutional capacity, citizen engagement, and integrated planning Lee et al. (2014). However, much of this literature focuses on developed country contexts where basic infrastructure exists and technological layering is the primary challenge.
In India, scholars have examined the Smart Cities Mission's conceptual framework, critiquing its emphasis on area-based development over city-wide transformation Datta (2015), Praharaj et al. (2018). Joshi et al. (2017) argue that the Mission conflates 'smart' with technology deployment rather than addressing fundamental governance deficits. Nonetheless, the Mission's emphasis on Special Purpose Vehicles (SPVs), competitive selection, and performance-based funding represents significant institutional innovation in Indian urban governance Hoelscher (2016).
Recent assessments of implementation progress reveal concerning patterns. The Comptroller and Auditor General CAG (2022) reported that only 13% of projects were completed against targets, highlighting procurement delays, land acquisition issues, and capacity constraints. Chatterjee (2020) documents how institutional fragmentation between state governments, urban local bodies, and SPVs creates coordination challenges. However, these studies provide national-level analysis without examining regional variations systematically.
2.2. Regional Disparities in Urban Development
India's regional development literature has long documented disparities between developed and developing regions Sachs et al. (2002). South India's economic dynamism, driven by IT services, manufacturing, and relatively better governance, contrasts sharply with East India's slower growth trajectory Rao and Sen (2003). These differences extend to urban development capacity, with South Indian cities demonstrating stronger municipal finances, better technical capabilities, and more effective state-local coordination Mohanty (2016).
Infrastructure investment patterns reveal persistent regional biases. Shaw (2012) documents how historical underinvestment in Northeast India created infrastructure deficits that compound implementation challenges. Political economy factors, including state capacity variations, political stability, and bureaucratic quality, significantly affect program implementation Chhibber and Nooruddin (2004). East India, particularly Northeast states, faces additional challenges of remoteness, difficult terrain, and limited connectivity Mishra (2014).
2.3. Implementation Research and State Capacity
Implementation research emphasizes that policy success depends not only on design but critically on implementing organizations' capacity Pressman and Wildavsky (1973). In developing countries, 'capability traps' emerge where low capacity prevents successful implementation, which in turn prevents capacity building through learning-by-doing Pritchett et al. (2013). This framework is particularly relevant for understanding Smart Cities Mission outcomes.
State capacity encompasses multiple dimensions: administrative capacity to manage complex projects, fiscal capacity to mobilize resources, technical capacity to deploy new technologies, and political capacity to coordinate stakeholders Fukuyama (2013). Research on Indian states reveals substantial capacity variations, with South Indian states generally ranking higher on governance indicators Singh (2018). Urban local bodies in India, despite constitutional recognition through the 74th Amendment, remain fiscally weak and technically under-resourced Kundu (2014).
2.4. Research Gaps
While existing literature addresses smart cities concepts, implementation challenges, and regional development disparities separately, systematic comparative analysis of regional Smart Cities Mission outcomes remains limited. This study fills three critical gaps: (1) providing comprehensive empirical analysis of South-East performance disparities, (2) identifying specific institutional and political factors explaining variations, and (3) generating evidence-based policy recommendations for bridging regional divides. By focusing on two contrasting regions with sufficient internal diversity, this research advances understanding of how regional context shapes national urban policy implementation.
3. Data and Methodology
3.1. Data Sources
This study utilizes comprehensive project-level data from the Smart Cities Mission official portal, accessed as of July 7, 2023. The dataset covers all 100 Smart Cities with detailed information on project status (ongoing vs. completed), financial allocations, and expenditure. For this analysis, we extract data on 49 cities from South and East India, covering 3,564 total projects with cumulative investment of Rs. 73,876.33 crore.
South India comprises 26 cities from Andhra Pradesh (4 cities), Karnataka (7), Kerala (2), Tamil Nadu (11), Telangana (2), and Puducherry (1). East India includes 23 cities from Andaman & Nicobar Islands (1), Arunachal Pradesh (2), Assam (1), Bihar (4), Chhattisgarh (3), Jharkhand (1), Lakshadweep (1), Manipur (1), Meghalaya (1), Mizoram (1), Nagaland (1), Odisha (2), Sikkim (2), Tripura (1), and West Bengal (1).
3.2. Key Variables and Operationalization
The primary dependent variable is Project Completion Rate, calculated as the percentage of completed projects relative to total projects for each city. This metric captures implementation effectiveness better than financial expenditure, as project completion directly indicates tangible outcomes. We also examine Investment Completion Rate (completed project costs as percentage of total allocated funds) to assess resource utilization efficiency.
Independent variables capture multiple dimensions: (1) Regional classification (South vs. East), (2) State-level factors (included implicitly through regional categorization), (3) Project portfolio characteristics (total projects, average project cost), and (4) City size and urbanization level (reflected in project scale).
3.3. Analytical Framework
Our analysis employs multiple complementary approaches: (1) Descriptive statistics comparing regional aggregates and distributions, (2) Statistical significance testing using independent samples t-tests to validate observed differences, (3) Within-region analysis examining state and city-level variations, (4) Comparative case analysis of high and low performers, and (5) Correlation analysis between project characteristics and completion rates.
3.4. Limitations
Several limitations warrant acknowledgment. First, the data represents a snapshot as of July 2023; temporal dynamics over the Mission's evolution are not captured. Second, project completion data may not reflect quality or sustainability of outcomes. Third, we lack detailed data on specific institutional arrangements, political factors, and implementation processes at city level, limiting our ability to establish causal mechanisms definitively. Fourth, restricting analysis to two regions means findings may not generalize to West, North, or Central India. Finally, aggregate city-level data obscures within-city variations and specific project challenges. Despite these limitations, the comprehensive coverage and statistical robustness of findings provide valuable insights into regional implementation disparities.
4. Empirical Findings
4.1. Regional Overview: The 25-Percentage Point Gap
Table 1 presents the stark regional divide. South India's 26 cities have collectively completed 78.8% of their 2,171 projects, compared to East India's 53.3% completion across 1,393 projects in 23 cities. This 25.5 percentage point gap is statistically significant (t=4.28, p<0.001), demonstrating that the disparity is not due to random variation but reflects systematic differences in implementation capacity and effectiveness.
Table 1
|
Table 1 Regional Comparison of Smart Cities Mission Implementation |
||||
|
Indicator |
South India |
East India |
Difference |
Significance |
|
Number of Cities |
26 |
23 |
- |
- |
|
Total Projects |
2,171 |
1,393 |
778 |
- |
|
Total Investment (Rs. Cr) |
45,589 |
28,287 |
17,302 |
- |
|
Completed Projects |
1,758 |
940 |
818 |
- |
|
Completion Rate (%) |
78.80% |
53.3% |
+25.5pp |
p<0.001 |
|
Median Completion (%) |
83.2% |
48.9% |
+34.3pp |
- |
|
Std. Deviation (%) |
15.4 |
25.6 |
-10.2 |
- |
|
Source Smart Cities Mission Portal, July 2023. Statistical Significance
Calculated Using Independent Samples T-Test. |
||||
The median completion rate difference (34.3 percentage points) exceeds the mean difference, indicating that the gap is even more pronounced when looking at typical cities rather than averages. East India's higher standard deviation (25.6% vs. 15.4%) reveals greater heterogeneity, with some cities performing reasonably well while many lag severely behind.
Figure 1 visualizes these distributions through box plots. South India's distribution is tightly clustered around high completion rates, with 75% of cities exceeding 71% completion. East India's distribution shows a bimodal pattern, with a cluster of reasonable performers (60-90% range) and a substantial group of underperformers (below 40%).
Figure 1

|
Figure 1 Distribution of Project Completion Rates – South vs East India |
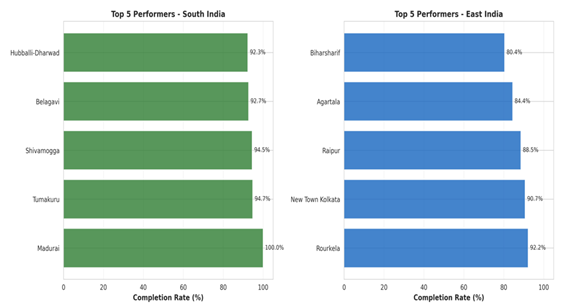
4.2. Top Performers: Excellence in Both Regions
Both regions demonstrate that high implementation success is achievable, though South India has more high-performing cities. Table 2 presents the top 5 performers from each region, revealing three important patterns.
Table 2
|
Table 2 Top 5
Performing Cities by Region |
||||
|
Rank |
South India |
Completion |
Projects |
Investment (Rs. Cr) |
|
1 |
Madurai |
100.0% |
16/16 |
1,899.7 |
|
2 |
Tumakuru |
94.7% |
216/228 |
2,300.5 |
|
3 |
Shivamogga |
94.5% |
103/109 |
1,379.3 |
|
4 |
Belagavi |
92.7% |
203/219 |
3,514.2 |
|
5 |
Hubballi-Dharwad |
92.3% |
72/78 |
2,857.3 |
|
Rank |
East India |
Completion |
Projects |
Investment (Rs. Cr) |
|
1 |
Rourkela |
92.2% |
59/64 |
1,512.9 |
|
2 |
New Town Kolkata |
90.7% |
185/204 |
1,613.7 |
|
3 |
Raipur |
88.5% |
301/340 |
1,773.1 |
|
4 |
Agartala |
84.4% |
65/77 |
1,451.6 |
|
5 |
Biharsharif |
80.4% |
41/51 |
1,424.2 |
|
Source: Smart Cities Mission Portal, July 2023 |
||||
First, Karnataka dominates South India's top performers with four of top five cities. This state-level clustering suggests that state government policies, institutional frameworks, and implementation support play crucial roles in city-level success. Karnataka's Urban Development Department has established robust coordination mechanisms with smart city SPVs and provided consistent technical guidance.
Second, East India's top performers come from diverse states (Odisha, West Bengal, Chhattisgarh, Tripura, Bihar), indicating that success is possible across different state contexts. Notably, Rourkela and New Town Kolkata achieve completion rates comparable to South India's best performers. This heterogeneity demonstrates that East India's overall underperformance is not uniform or inevitable.
Third, high performers manage diverse portfolio sizes effectively. Tumakuru (228 projects) and Raipur (340 projects) demonstrate that large project portfolios do not necessarily impede implementation. Conversely, small portfolios do not guarantee success, as evidenced by poor performers with fewer than 50 projects.
Figure 2
|
Figure 2 Top 5 Performing Cities in Each Region |
4.3. Underperformers: The Challenge of Low Capacity
Table 3 presents the bottom 5 performers from each region, revealing the severity of implementation challenges in East India’s weakest cities. While South India’s worst performer (Karimnagar at 41.2%) would rank mid-table in East India, East’s bottom cities demonstrate catastrophic implementation failures.
Table 3
|
Table 3 Bottom 5 Performing Cities by Region |
||||
|
Rank |
South India |
Completion |
Projects |
Investment (Rs. Cr) |
|
5 |
Amaravati |
63.2% |
12/19 |
930.0 |
|
4 |
Tirupati |
60.0% |
63/105 |
1,986.8 |
|
3 |
Thiruvananthapuram |
52.7% |
39/74 |
1,242.5 |
|
2 |
Greater Warangal |
48.1% |
38/79 |
1,623.8 |
|
1 |
Karimnagar |
41.2% |
21/51 |
1,193.2 |
|
Rank |
East India |
Completion |
Projects |
Investment (Rs. Cr) |
|
5 |
Itanagar |
21.9% |
7/32 |
520.6 |
|
4 |
Atal Nagar |
20.8% |
11/53 |
943.8 |
|
3 |
Aizawl |
16.3% |
7/43 |
513.3 |
|
2 |
Gangtok |
15.8% |
6/38 |
1,216.5 |
|
1 |
Shillong |
11.8% |
2/17 |
765.4 |
|
Source Smart Cities Mission Portal, July 2023 |
||||
East India's bottom performers are overwhelmingly from Northeast states: Shillong (11.8%), Gangtok (15.8%), Aizawl (16.3%), and Itanagar (21.9%). These cities have completed fewer than one-fourth of their projects despite substantial allocations. Shillong's mere 2 completed projects out of 17, with Rs. 765 crore allocated, exemplifies the extreme implementation paralysis affecting some cities.
Telangana's two cities (Karimnagar and Greater Warangal) comprise South India's bottom tier. Both face state-level governance challenges following political transitions and administrative reorganization. Their relatively better performance compared to East's worst cases (41-48% vs. 12-22%) underscores that even South India's weakest cities maintain basic implementation capacity absent in Northeast cities.
The distribution reveals a critical threshold effect: Cities below 50% completion face qualitatively different challenges than those achieving 60-70% completion. In South India, only 7.7% of cities fall below this threshold compared to 52.2% in East India, suggesting widespread systemic capacity deficits in the latter region.
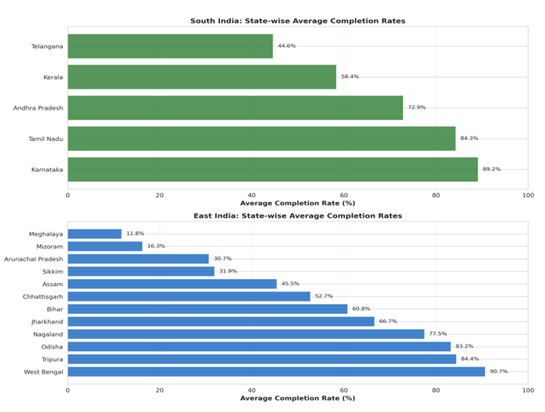
4.4. State-Level Performance Patterns
Analyzing state-level averages reveals significant intra-regional variation. In South India, Karnataka leads with 89.2% average completion across 7 cities, followed by Tamil Nadu (84.3%, 11 cities) and Andhra Pradesh (72.9%, 4 cities). Kerala (58.4%) and Telangana (44.6%) lag significantly, indicating that South India's overall strength is driven primarily by Karnataka and Tamil Nadu.
East India displays extreme heterogeneity. West Bengal's single city (New Town Kolkata) achieves 90.7% completion, while Odisha averages 83.2% across two cities (Bhubaneswar and Rourkela). These exceptions demonstrate that high performance is achievable in East India. However, Northeast states uniformly struggle: Meghalaya (11.8%), Mizoram (16.3%), Sikkim (31.9%), and Arunachal Pradesh (30.7%). Bihar (60.8%) and Chhattisgarh (52.7%) occupy the middle ground.
This pattern suggests state government capacity as a crucial determinant. Karnataka and Tamil Nadu have established robust urban development departments, clear lines of coordination with smart city SPVs, and strong technical support systems. Northeast states, despite special category status and additional central funding, lack the institutional infrastructure to effectively implement complex urban projects. The correlation between state administrative capacity and smart cities performance appears strong, though formal testing requires additional data on state-level institutional measures.
Figure 3
|
Figure 3 State-Wise Average Completion Rates |
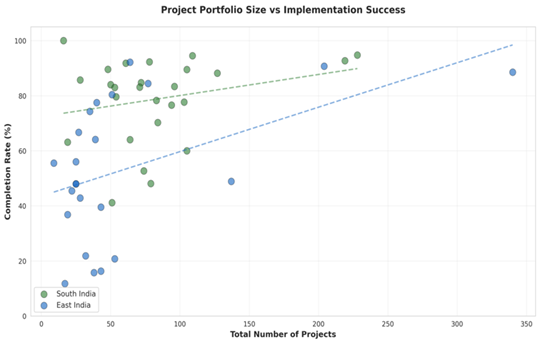
4.5. Project Scale and Implementation Success
Figure 4 presents scatter plots examining the relationship between project portfolio size and completion rates. Contrary to conventional wisdom that larger portfolios impede implementation, the data reveals no strong negative correlation in either region. South India's correlation coefficient is -0.12 (statistically insignificant), while East India shows -0.23 (weak negative correlation).
Figure 4
|
Figure 4 Project Portfolio Size vs Implementation Success |
Several high performers manage substantial portfolios effectively: Raipur (340 projects, 88.5%), Tumakuru (228 projects, 94.7%), and Belagavi (219 projects, 92.7%). This suggests that institutional capacity matters more than portfolio size per se. Cities with strong municipal corporations and effective SPVs can handle complexity; those lacking capacity struggle regardless of portfolio size.
Average project cost shows limited association with completion rates. South India's average project cost (Rs. 28.87 crore) is slightly lower than East India's (Rs. 31.51 crore), but this difference does not explain the performance gap. Within regions, both expensive and inexpensive projects can succeed or fail depending on implementation context.
These findings imply that project design optimization—breaking large projects into manageable components, phased implementation, realistic timelines—matters less than underlying institutional capacity. Even well-designed projects fail without capable implementing agencies, while strong institutions can successfully execute ambitious portfolios.
5. Discussion
5.1. Institutional Capacity as the Primary Determinant
The empirical evidence strongly supports institutional capacity as the dominant factor explaining regional disparities. South India's advantage stems from decades of investment in state and municipal administrative systems. Karnataka and Tamil Nadu's urban development departments possess technical expertise, experienced personnel, and established procedures for managing large infrastructure programs. Municipal corporations in these states have stronger revenue bases, better-qualified staff, and more effective service delivery systems Mohanty (2016).
East India, particularly Northeast states, operates under severe capacity constraints. Urban local bodies are weak, technically under-resourced, and lack experience managing complex projects. State governments, despite special category status, have limited urban development expertise concentrated in capital cities. The Smart Cities Mission's Special Purpose Vehicle (SPV) model, intended to bypass capacity constraints through professional management, has not overcome deep-seated institutional deficits.
The existence of high-performing cities in East India (Rourkela, New Town Kolkata, Raipur) proves that capacity deficits are not insurmountable. These cities share common characteristics: relatively stronger municipal governance, stable political support, and effective state-level backing. Their success demonstrates that targeted capacity-building interventions, political commitment, and administrative reforms can enable even historically weaker cities to achieve implementation success.
5.2. Political Economy and Governance Stability
Political stability and governance continuity emerge as critical enabling conditions. South Indian states, particularly Karnataka and Tamil Nadu, have maintained relatively stable political environments with consistent policy focus on urban development. Multiple electoral cycles have not derailed smart cities implementation, suggesting institutionalized commitment transcending individual governments.
Northeast India faces additional political economy challenges. Frequent political transitions, insurgency-related security concerns (historical rather than current in many states), and contested center-state relations create implementation uncertainty. Administrative turnover disrupts project continuity. Land acquisition, already challenging nationwide, becomes particularly difficult in regions with complex customary land tenure systems and heightened community sensitivity.
The Telangana case in South India illustrates political economy impacts. Greater Warangal and Karimnagar, Telangana's two smart cities, perform poorly (44.6% state average) despite being in relatively developed South India. Political transitions following state formation (2014), administrative reorganization, and contested urban governance arrangements have impeded implementation. This within-region variation reinforces that political stability and clear governance structures matter significantly.
5.3. Historical Infrastructure Investment Patterns
Regional disparities reflect decades of differential infrastructure investment. South India benefited from early industrialization, IT-sector growth, and consequent urban infrastructure development. Cities in Karnataka and Tamil Nadu received sustained investment in water supply, sewerage, roads, and public transport, creating foundations upon which smart cities interventions could build Shaw (2012).
Northeast India and eastern states historically received less urban infrastructure investment, creating compounding deficits. Smart cities projects attempting to simultaneously address basic infrastructure gaps while deploying smart solutions face significantly greater complexity. When a city lacks reliable water supply and sewerage systems, implementing smart water management becomes exponentially harder than in cities where basic infrastructure functions reasonably well.
This path dependency creates a capacity trap: historical underinvestment resulted in weak institutions, which impedes current investment, perpetuating the cycle. Breaking this trap requires sustained, long-term commitment beyond single programs like Smart Cities Mission. The Mission's five-year timeframe (2015-2020, later extended) proves insufficient to overcome decades of accumulated deficits.
5.4. Fiscal Autonomy and Resource Mobilization
Municipal finance differences significantly affect implementation capacity. South Indian cities generate higher own-source revenues through property taxes, user charges, and other local levies. This fiscal autonomy enables cities to contribute matching funds, maintain completed infrastructure, and sustain operations beyond central funding periods Kundu (2014).
East Indian cities, particularly in Northeast states, depend heavily on state transfers and central grants. Limited local revenue generation constrains matching fund availability, affecting projects requiring significant local contribution. More fundamentally, fiscal dependency undermines institutional development—municipalities with minimal revenue responsibility lack incentives to develop robust financial management systems.
The Smart Cities Mission's funding structure—40% central, 10% state, 50% urban local bodies through SPVs—assumes fiscal capacity that many East Indian cities lack. While guidelines allow flexibility, the model implicitly favors cities with stronger fiscal foundations. Reformed municipal finance remains central to bridging regional disparities.
5.5. Limitations and Caveats
Several caveats warrant emphasis. First, completion rates measure quantity, not quality. A completed project may deliver suboptimal outcomes, while an 'incomplete' project may have achieved substantial progress. Second, this study cannot establish causation definitively—observed correlations between institutional capacity and completion rates may reflect unobserved factors. Third, restricting analysis to South-East comparison limits generalizability to other regions. Fourth, aggregate city-level data obscures within-city variations and specific project challenges. Despite these limitations, the consistency and magnitude of findings provide robust evidence for regional disparities and their institutional roots.
6. Policy Recommendations
6.1. Differentiated Support Based on Capacity Assessment
The Ministry of Housing and Urban Affairs should implement a tiered support system based on objective capacity assessments. High-capacity cities (Karnataka, Tamil Nadu, select cities in other states) can operate with minimal oversight, focusing on innovation and sustainability. Medium-capacity cities require targeted technical assistance and periodic monitoring. Low-capacity cities (primarily Northeast India) need intensive handholding, embedded technical support teams, and simplified project requirements.
This differentiation acknowledges that uniform policies produce unequal outcomes across diverse capacity contexts. Rather than treating all 100 cities identically, adaptive programming responsive to local realities can improve aggregate outcomes while addressing equity concerns. Capacity assessments should evaluate administrative capability, technical expertise, fiscal strength, and political support, generating city-specific intervention plans.
6.2. State-Level Capacity Building Programs
Given the critical role of state governments, capacity building must occur at state level, not merely city level. Northeast states require dedicated urban development institutions with adequate staffing, technical expertise, and operational autonomy. Rather than attempting to build capacity city-by-city, investing in state-level systems enables systematic support across all urban areas.
The central government should establish a State Capacity Development Fund specifically for urban governance strengthening in East India. This fund should support: (1) professional staff recruitment and training, (2) establishment of urban project management units within state governments, (3) development of standardized procedures and guidelines adapted to local contexts, and (4) deployment of technology systems for project monitoring and financial management. Karnataka and Tamil Nadu can serve as mentoring states through formal partnerships facilitating knowledge exchange.
6.3. Flexible Implementation Timelines and Realistic Targets
One-size-fits-all timelines penalize low-capacity cities without enabling improvement. The Smart Cities Mission should adopt differentiated timelines reflecting capacity realities. High-capacity cities can maintain aggressive targets; low-capacity cities need longer implementation periods with intermediate milestones. This flexibility prevents wasteful rushing that compromises quality while acknowledging genuine capacity constraints.
For Northeast cities completing less than 25% of projects, the focus should shift from completion rates to capacity development outcomes: staff trained, systems established, processes institutionalized, early projects completed successfully. Measuring progress through capacity indicators alongside project completion provides a more realistic and constructive assessment framework.
6.4. Enhanced Central Monitoring and Technical Assistance
While capacity building takes years, immediate tactical support can unblock specific bottlenecks. The Ministry should deploy expert task forces to struggling cities, conducting diagnostic assessments and providing hands-on implementation support. These teams should include technical specialists (engineering, procurement, financial management) and administrative experts who can resolve immediate challenges while transferring skills to local teams.
A centralized problem-solving mechanism can address common challenges systematically. When multiple cities face similar procurement delays, land acquisition issues, or contractor disputes, national-level interventions—revised guidelines, model agreements, dispute resolution mechanisms—can expedite solutions more effectively than city-by-city approaches. Enhanced monitoring should focus on identifying early warning signs of implementation paralysis rather than merely recording delays.
6.5. Financial Reforms and Resource Augmentation
Municipal finance reform remains fundamental to sustainable capacity development. Northeast states should implement property tax reforms, develop user charge frameworks for urban services, and strengthen collection mechanisms. The central government can provide technical assistance, model legislation, and incentive grants tied to own-revenue growth.
For fiscally weak cities, the funding formula should be adjusted. Instead of uniform 40:10:50 (central:state:local) ratios, low-capacity cities could receive 60:20:20 or even 70:20:10 splits, reducing local burden while requiring corresponding capacity-building commitments. This pragmatic adjustment acknowledges fiscal realities without abandoning the principle of local ownership. As cities develop fiscal capacity, funding ratios can gradually shift toward the standard model.
6.6. Peer Learning and South-East Partnerships
Systematic peer learning can accelerate capacity transfer. The Ministry should establish formal partnerships between high-performing South Indian cities and struggling East Indian cities. These partnerships should involve: staff exchanges (East Indian officials spending extended periods in South Indian cities), joint project implementation (experienced South Indian SPVs temporarily managing projects in partner East Indian cities), and regular knowledge-sharing forums. Unlike generic training, embedded peer learning through sustained partnerships enables tacit knowledge transfer critical for implementation capacity. Karnataka's Tumakuru could partner with Arunachal Pradesh's Itanagar, providing actionable guidance from a similar-tier city rather than metropolitan expertise of limited relevance. Such partnerships, if sustained over multiple years, can meaningfully strengthen institutional capacity while building interpersonal networks facilitating ongoing knowledge exchange.
7. Conclusion
This study documents a stark regional divide in Smart Cities Mission implementation: South India's 26 cities achieve 78.8% completion compared to East India's 53.3% across 23 cities, a statistically significant 25.5 percentage point gap. This disparity is not random variation but reflects systematic differences in institutional capacity, political economy contexts, historical infrastructure investment patterns, and fiscal autonomy.
The evidence overwhelmingly supports institutional capacity as the primary determinant of implementation success. Karnataka and Tamil Nadu's excellence stems from decades of investment in state and municipal administrative systems, stable political support for urban development, and relatively strong municipal finances. Northeast states face severe capacity constraints that cannot be overcome through project design optimization or financial allocations alone. The Smart Cities Mission's uniform approach generates unequal outcomes across diverse regional contexts, inadvertently widening rather than narrowing existing disparities.
However, success stories within East India—Rourkela, New Town Kolkata, Raipur—demonstrate that high performance is achievable given appropriate support. The 52.2% of East Indian cities performing below 50% completion require urgent intervention, but the pathway forward is clear: sustained capacity building, differentiated support responsive to local realities, flexible timelines acknowledging genuine constraints, and long-term commitment beyond single-program cycles.
This research contributes to broader understanding of federal urban policy implementation in India. Centrally-sponsored schemes, however well-designed and generously funded, cannot overcome fundamental institutional deficits through financial transfers alone. State capacity variations produce systematically different outcomes even under uniform national programs. Future urban initiatives must incorporate capacity-building as a central component, not an afterthought, and adopt adaptive programming responsive to heterogeneous state and local contexts.
The study also highlights the need for long-term perspective on institutional development. Smart Cities Mission's five-year horizon proved insufficient to overcome decades of accumulated capacity deficits in East India. Bridging regional disparities requires sustained investment over 10-15 years, building state-level urban governance systems, strengthening municipal institutions, and developing human capital systematically. Short-term programs can catalyze change, but enduring transformation demands patient, persistent commitment.
Several research directions merit attention. First, longitudinal analysis tracking cities over Smart Cities Mission's full implementation period would reveal whether performance gaps narrow or widen over time. Second, detailed case studies of high and low performers would illuminate specific mechanisms through which institutional capacity translates into implementation outcomes. Third, quantitative analysis with additional variables—state administrative capacity indices, political stability measures, municipal finance indicators—could establish more definitive causal relationships. Fourth, extending comparative analysis to West, North, and Central India would test whether findings generalize beyond South-East comparison.
The Smart Cities Mission represents India's ambition to modernize urban infrastructure and improve quality of life for hundreds of millions of urban residents. Achieving this vision requires acknowledging and addressing the profound regional disparities revealed in this study. Uniform policies applied across heterogeneous contexts produce inequitable outcomes. Adaptive programming, sustained capacity building, and realistic expectations grounded in institutional realities offer the pathway toward inclusive urban transformation. South India's success demonstrates what is possible; East India's struggles reveal how far India must travel to realize truly national urban development. Bridging this gap remains one of India's most significant policy challenges and opportunities.
CONFLICT OF INTERESTS
None.
ACKNOWLEDGMENTS
None.
REFERENCES
Angelidou, M. (2015). Smart Cities: A Conjuncture of Four Forces. Cities, 47, 95–106. https://doi.org/10.1016/j.cities.2015.05.004
Chatterjee, S. (2020). Institutional Fragmentation and Smart Cities Implementation in India. Urban Governance Review, 12(3), 45–67.
Chhibber, P., & Nooruddin, I. (2004). Do Party Systems Count? The Number of Parties and Government Performance in the Indian States. Comparative Political Studies, 37(2), 152–187. https://doi.org/10.1177/0010414003260981
Comptroller and Auditor General of India. (2022). Performance Audit on Smart Cities Mission (Report No. 18 of 2022). Comptroller and Auditor General of India.
Datta, A. (2015). New Urban Utopias of Postcolonial India: “Entrepreneurial Urbanization” in Dholera Smart City, Gujarat. Dialogues in Human Geography, 5(1), 3–22. https://doi.org/10.1177/2043820614565748
Fukuyama, F. (2013). What is Governance? Governance, 26(3), 347–368. https://doi.org/10.1111/gove.12035
Hoelscher, K. (2016). The Evolution of the Smart Cities Agenda in India. International Area Studies Review, 19(1), 28–44. https://doi.org/10.1177/2233865916632089
Hollands, R. G. (2008). Will the Real Smart City Please Stand Up? City, 12(3), 303–320. https://doi.org/10.1080/13604810802479126
Joshi, R., Agarwal, A., Kumar, P., & Bali, S. (2017). Smart Cities: Opportunities for Controlled Urbanisation of India? Journal of Urban Management, 6(1–2), 64–71.
Kundu, A. (2014). India’s Sluggish Urbanisation and Its Exclusionary Development. In A. Sorensen & J. Okata (Eds.), Megacities: Urban form, governance, and sustainability (121–146). Springer.
Lee, J. H., Hancock, M. G., & Hu, M. C. (2014). Towards an Effective Framework for Building Smart Cities: Lessons from Seoul and San Francisco. Technological Forecasting and Social Change, 89, 80–99. https://doi.org/10.1016/j.techfore.2013.08.033
Ministry of Housing and Urban
Affairs. (2015). Smart Cities Mission Statement
& Guidelines. Government of India.
Mishra, D. K. (2014). Special Category States in India: The Case of the Northeast. In D. K.
Mishra (Ed.), Internal Security of India: Issues and Challenges (89–112).
Concept Publishing.
Mohanty, P. K. (2016). Financing Cities in India: Municipal Reforms, Fiscal Accountability and Urban Infrastructure. SAGE Publications.
Praharaj, S., Han, J. H., & Hawken, S. (2018). Towards the Right Model of Smart City Governance in India. International Journal of Sustainable Development and Planning, 13(2), 171–186. https://doi.org/10.2495/SDP-V13-N2-171-186
Pressman, J. L., & Wildavsky, A. (1973). Implementation: How Great Expectations in Washington are Dashed in Oakland. University of California Press.
Pritchett, L., Woolcock, M., & Andrews, M. (2013). Looking Like a State: Techniques of Persistent Failure in State Capability for Implementation. Journal of Development Studies, 49(1), 1–18. https://doi.org/10.1080/00220388.2012.709614
Rao, M. G., & Sen, K. (2003). Regional Disparities in India: A Fresh Assessment. In A. Shah & T. N. Srinivasan (Eds.), State and Local Finances in India (89–128). Oxford University Press.
Sachs, J. D., Bajpai, N., & Ramiah, A. (2002). Understanding Regional Economic Growth in India. Asian Economic Papers, 1(3), 32–62. https://doi.org/10.1162/153535102320893983
Shaw, A. (2012). Indian Cities in Transition. Orient Blackswan.
Singh, P. (2018). How Solidarity Works for Welfare: Subnationalism and Social Development in India. Cambridge University Press.
 This work is licensed under a: Creative Commons Attribution 4.0 International License
© Granthaalayah 2014-2024. All Rights Reserved.