Original Article
DESIGNING KINETIC FAÇADE FOR AN OFFICE BUILDING IN WARM AND HUMID CLIMATE TO IMPROVE THE DAYLIGHT QUALITY – AN INTEGRATED COMPUTATIONAL APPROACH
|
Sakshi Birkad
1, Amitava Sarkar 1 1 Department of
Architecture, School of Planning and Architecture, Vijayawada, Andhra
Pradesh, India |
|
|
|
ABSTRACT |
||
|
Daylighting plays a crucial role in providing comfort within buildings, as occupants have a strong preference for well-lit spaces that reduce reliance on artificial lighting. Considering growing concerns surrounding energy efficiency and sustainability, daylighting design has gained significance beyond its aesthetic and psychological implications. The building facade serves as a key element for controlling the penetration of natural light into indoor spaces. In this regard, a climate-based approach and the observation of dynamic sky conditions offer effective methodologies for this study. Kinetic architecture, inspired by nature and intricate geometries, integrates form and technology. In the context of enhancing visual comfort, daylight performance, and reducing glare, the implementation of innovative daylighting guide systems with real-time control through kinetic configurations becomes imperative. This study aims to propose a systemic computational approach to design a tri-fold kinetic facade configuration tailored for office buildings in warm and humid climates, aligning with specific daylighting design criteria. The research methodology deploys both the qualitative approach, through the assessment of feedback from the users regarding the visual comfort, and the quantitative approach, through the assessment of onsite measurement of visual environment in the office space and also by using the building simulation tools to calculate the various parameters related to the indoor visual environment affecting the performance of the office activity. The results from the analysis have shown that, when compared with the absence of any such kinetic façade, the proposed tri-fold kinetic facade can improve the visual and daylight performance of a building by reducing the annual sunlight exposure by 73-90% and annual disturbing glare by 73-91% which is significant to create cooling effect indoor. Optimal opening angles of the proposed kinetic façade for different orientations are also calculated regarding the different seasonal representative days. Limitations of the present study and the scope of further research are also highlighted. Keywords: Kinetic Facade, Daylight Optimization,
Office Building, Warm-Humid Climate, Simulation Analysis, Computational
Approach |
||
INTRODUCTION
BACKGROUND AND NEED FOR THE STUDY
The design of the
building envelope is a crucial factor in determining the indoor physical
environment, specifically in terms of thermal and visual comfort Wang et al. (2012). To promote the well-being of occupants, it
is essential to provide sufficient natural light, which has positive effects on
their physical, psychological, and mental health, and is considered a renewable
and permanent source Hosseini
et al. (2021). Innovative building envelopes incorporate
dynamic components that respond to changing climatic conditions to enhance
daylight performance and visual comfort.
Kinetic
architecture is a design approach that combines form and technology, drawing
inspiration from nature and geometric complexity in building structures. A
kinetic façade is an automatic and responsive design that features dynamic
elements capable of various movement such as flap, fold, rotate, slide, scale,
expand, extract, and change in response to daylight Ahmed et
al. (2015), Carlucci
(2021). This adaptive feature enhances the
occupant's visual comfort by integrating with its peripheral environment using
sensors and actuators. The primary criterion for office lighting is to offer
sufficient illumination for a visual activity such as working/ reading.
Visual comfort is
the most dominant factor in human perception since the eye contains two third
of nerve fiber within human central nervous system. The mental and
psychological state of individuals can be influenced by the level of visual
comfort they experience International Organization for Standardization. (2025). Workplaces and study environments, such as
offices or production spaces, can benefit from a comfortable lighting
environment, which can elevate mood and enhance work efficiency Tabadkani
et al. (2018), Tabadkani
et al. (2019). Consequently, there has been a growing
demand for visual comfort from building occupants. As the thought of comfort
has evolved, one approach to enhancing visual comfort and enhancing occupant
productivity is through the motion of changing façade configurations.
Three-dimensional alterations in the façade elements can control microclimate
forces such as wind and solar energy, thus improving the level of visual
comfort and productivity Hosseini
et al. (2019).
Since past 20
years, there is a revolutionary change in building and construction technology
along with the development in the information technology (IT) sector which can
be seen in the new constructions which deploy many attractive envelopes many a
time forgetting the conditions inside which can lead to visual discomfort that
in turn may cause ill health to the occupants and reduction in the
productivity. If the parameters of visual comfort are not integrated in the
design phase, such buildings may consume more energy for lighting and cooling
loads.
As per the
information U.S. (2021), India stands in the 3rd largest energy
consumer. The building sector in India contributes to about 35% of total
electricity consumption BEE, (2017).
Building envelope/ facades are the most important contributors to allow large
amounts of daylight which influences the comfort factors within the buildings
and energy efficiency of the buildings.
The main reason in
the consideration of office building for this study is that they function
mostly in the daytime where the most useful naturally available daylight can be
utilized to optimize the need for artificial lighting which consumes more
energy. Hence, there is a necessity to apply the effective strategies to reduce
the effects of visual discomfort due to less availability of daylight during
the working hours in the office building.
Aim, Objectives, Scope and Limitations
The aim of the
present research is to design the kinetic façade for an office building with
regards to daylight quality in warm and humid climate of Vijayawada to improve
its visual comfort through a systemic computational approach which can be
applied in other similar conditions. To fulfill the aim, the objectives of the
research include – (a) to propose the methodology for a systemic computational
approach to design adaptive kinetic façade for optimal visual performance; (b)
to study the parameters for evaluating indoor visual comfort; (c) to assess the
climatic context and design kinetic façade for improved visual comfort; (d) to
evaluate the performance of designed kinetic façade for the optimal daylight
quality; and (e) to determine the optimal angle of façade unit for specific
months on different timings.
Scope
Parameters like
orientation, kinetic façade transformation system, angle of façade unit,
material type, etc. are taken into consideration in this study. The study of
controlled daylight distribution, the availability of daylight, glare and view
factor are considered. The study has assessed the parameters of visual and
daylight performance such as Useful Daylight Illuminance (UDI), Spatial
Daylight Autonomy (sDA), Annual Sunlight Exposure (ASE), and Glare.
Limitations
Due to time
constraints the major focus is given on improving the visual comfort and
daylight performance for an office building in warm and humid climate. This can
be further extended to carry out the thermal and energy performance of the
building. Cost and maintenance aspect is not taken into consideration in the
present study.
Research Questions
The present
research also attempts to find answers to the following research questions
relevant to the scope of the study: (i) What strategies can be employed to
improve daylight distribution in buildings in a warm and humid climate? (ii)
Can a kinetic facade be considered as a viable solution to enhance visual
comfort in the warm and humid climate of Vijayawada? (iii) What is the process
for selecting the appropriate kinetic façade among the various options? (iv)
How can the distribution of indoor daylight be optimized during the design of
the kinetic facade?
REVIEW OF LITERATURE
Visual Comfort
Natural light has
many positive effects on health and energy efficiency, but it also comes with
certain challenges. For example, heat gains and visual discomfort in the form
of daylight glare must be considered to ensure visual comfort. Balancing visual
comfort with daylight presents a complex undertaking, necessitating a
comprehensive comprehension of the interplay between human requirements and
lighting conditions. Crucial factors such as light quantity, uniformity, color
rendering quality, and glare risks for occupants must be meticulously taken
into account International Organization for
Standardization. (2025).
Parametric simulations can provide data on these factors to facilitate an
accurate and efficient evaluation of daylight performance Rizi and Eltaweel (2021).
Parameters for Evaluating Visual Comfort
Many researches on
the effect of daylighting in buildings have identified several performance
factors that contribute to the improvement of visual comfort in a building Elghandour
et al. (2016), Hosseini
et al. (2019a), Tabadkani
et al. (2019). As per the literature, the following
factors are essential to provide visual comfort to the occupants in a space:
(a) Daylight Availability (or Distribution) - Task Illuminance and Uniformity;
(b) Glare - caused by the brightness of the source or the relative luminance of
the room surfaces; (c) Task-Surface Contrast - The distinction between the task
and its surrounding surface; (d) View - The aesthetic appeal and visual quality
of the image.
Study of Daylight Metrics and Standards
The study’s
objectives focus on assessing and improving the visual comfort in an office
space by optimizing the proposed adaptive kinetic façade through integrated
design and computational approach. The metrics and standards identified based
on the literature review Illuminating Engineering Society. (2012), U.S. (2015) , Elghandour
et al. (2016), BEE, (2017),
Mekhamar
and Hussein (2021), Hosseini
et al. (2021), Natiq and
Abdulqader, (2023), International
Organization for Standardization. (2025) to do the analysis for this purpose are discussed in the following
sections.
Spatial Daylight Autonomy (sDA):
The Illuminating
Engineering Society (IES) has developed guidelines for testing and calculating
two important climate-based daylight metrics - Spatial Daylight Autonomy and
Annual Sunlight Exposure Illuminating Engineering Society. (2012). These metrics are commonly used for
evaluating daylight performance and have also been incorporated into building
certification systems such as Leadership in Energy and Environmental Design
(LEED) U.S. (2015) .
The percentage of
a space that is illuminated with a lighting level of at least 300 lux for at
least half of the occupied hours during the year (from am to
pm) on the horizontal work plane positioned 30 inches above the floor.
To meet the requirement, a minimum of 55% of the floor area must achieve this
threshold U.S. (2015) .
Annual Sunlight Exposure (ASE)
The percentage of
a space that is exposed to direct sunlight with an illuminance level of 1000
lux or higher for at least 250 hours during the occupied period each year,
leading to discomfort and glare Illuminating Engineering Society. (2012). This metric is particularly relevant when
the space is unobstructed, and glare control is required using shading devices.
The ASE should not exceed 10% of the floor area, and this metric is useful for
identifying when shading is necessary in indoor spaces, allowing for the design
of appropriate shading systems Illuminating Engineering Society. (2012). LEED V4 recommends that the ASE be limited
to no more than 10%, making it the second optimization goal USGBC (2013).
Useful Daylight Illuminance (UDI)
This refers to the
fraction of time throughout the year during which the indoor horizontal
illuminance from daylight, measured at a particular point, meets a specific
threshold in each area Reinhart
and Wienold (2011), Wagdy
and Fathy (2015). The three ranges of the UDI for office
spaces are: UDI underlit = <300 lux; UDI useful = 300 – 2000 lux; and UDI
over-lit = >2000 lux. As per the Energy Conservation Building Code of India
(ECBC), 50% of the floor area above ground should fulfil the above criteria for
office buildings BEE, (2017).
Daylight Glare Probability (DGP)
This metric
represents the proportion of individuals who are affected by discomfort glare.
It is a novel technique for predicting glare, which is based on empirical
observations of the vertical eye illuminance (Ev) instead of the background
luminance (Lb) Wienold
and Christoffersen (2006). The four ranges of the DGP for office
spaces are given in Table 1 below.
Table 1
|
Table 1 Daylight Glare Probability (DGP) Index. |
||
|
DGP Rating |
Lower
limit |
Upper
limit |
|
Imperceptible glare |
0 |
35% |
|
Perceptible glare |
35% |
40% |
|
Disturbing glare |
40% |
45% |
|
Intolerable glare |
45% |
- |
|
Source: Garcia and Pereira (2019) |
||
|
|
Relevance to Sustainability
Visual comfort and
natural daylight are the crucial aspect in office building to improve the
occupant’s productivity. Using natural light efficiently can have numerous
benefits for both physical and mental health of workers, such as reducing
visual fatigue and improving work efficiency while also lowering energy
consumption. Several noteworthy building projects located different parts of
the world with hot-humid climatic conditions such as - Simons Centre at Stony
Brook, New York, USA (2008), Media ICT building,
Barcelona, Spain (2011), Al Bahr Towers, Abu
Dhabi, UAE (2013), Helio Trace Façade
System, New York, USA (2013), SDU University
of Southern Denmark, Denmark (2014), etc.
have shown that by being responsive to changing climatic conditions, kinetic
facades can improve daylight performance, energy performance and enhance visual
comfort using adaptive and interactive mechanisms Razoki
and Al-Kazzaz (2025). Following are some of the benefits of
design for daylighting observed from the literature review: (a) Health benefit
– Access to natural views reduces stress and such improved vision helps to work
for longer time Tabadkani
et al. (2019), Day et al. (2019), (b) Energy efficiency – Optimization of
daylighting design can save up to 15-40% of total annual building energy
consumption. It can also cut the energy usage of building lighting by 75-80% at
times Elghandour
et al. (2016), Garcia and Pereira (2019); and (c) Financial benefit - Studies have
found that people can perform 10-25% better in daylit space rather than in a
dimly-lit room Rizi and Eltaweel (2021), Hosseini
et al. (2021).
MATERIALS AND METHODS
Research Methodology
Researchers Elghandour
et al. (2016), Waseef
and Nashaat (2017), Mekhamar
and Hussein (2021), Tabadkani
et al. (2021), Natiq and
Abdulqader (2023) have highlighted the benefit of designing dynamic
climate responsive kinetic façade for visual and thermal comfort utilizing the
qualitative and quantitative simulation tools.
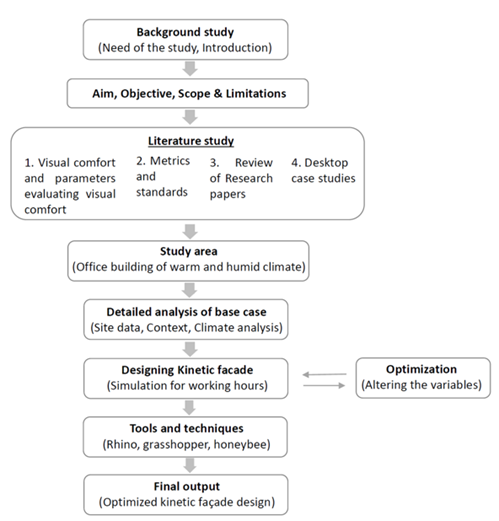
The present research deploys combination of both qualitative and
quantitative research methods. The activity flowchart followed in the present
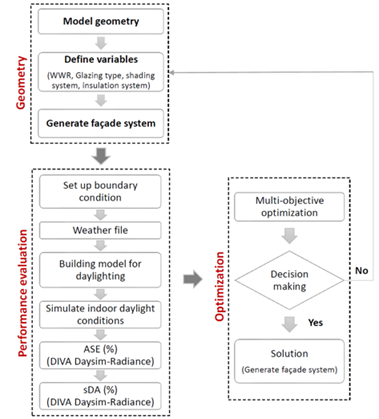
research process is shown in Figure 1 and the flowchart of the working process of
design optimization analysis through simulation tools is shown in Figure 2.
The proposed
flowcharts signify a systemic novel computational approach by integrating the
different stages of the design development along with the façade optimization
process dynamically and harmoniously in sync to the local context with the help
of building simulation tools. This proposed computational approach can be
furthered to develop an artificial intelligence (AI) based algorithm
incorporating machine learning (ML) to process ‘big data’ to design adaptive
kinetic façade as per local geo-climatic condition and building usage.
|
Figure 1
|
|
Figure 2
|
|
Figure 2 Flowchart Showing the Working Process of
Design Optimization Analysis. Source: Authors |
Study Area and Climate Analysis
The selected
commercial office building site is situated in Enikepadu, Vijayawada, Andhra
Pradesh (A.P.), India (16.53° N Latitude, 80.797° E Longitude, Altitude 29.25m
above MSL) and is connected to 90’ wide road on southern side. Vijayawada has
28.2°C as mean annual temperature, with May and June being the hottest month
having average temperature of 33.5°C, and December being the coolest month at
24.2°C on average. The total annual rainfall is 974 mm, with the driest month
being January at 6 mm and the wettest being August at an average of 179 mm India
Meteorological Department. (2022) .
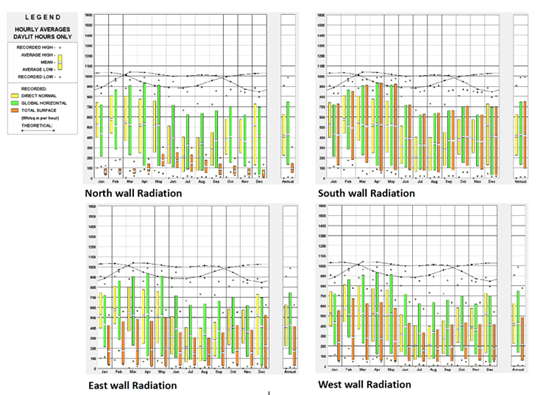
For the analysis
of Vijayawada climatic data, digital climate file
IND_AP_Gannavaram-Vijayawada.AP.431810_TMYx.epw (WMO_Region_2_Asia) has been
used. From the analysis of the solar radiation data of Vijayawada, it is
observed that the north facade receives the lowest radiation. The south and
west wall receives the maximum radiation from the afternoon sun and thus this
facade has the most heat gain (see Figure 3). Hence, high performance glazing can be
provided on all surfaces for reducing heat gain in the summer and south, west
and east wall openings should be shaded effectively to avoid the maximum solar
radiation.
|
Figure 3
|
|
Figure 3 Graphs Showing Radiation Range. Source: Authors and Climate Consultant Tool |
Further, form the
analysis of the sky-cover data it is found that from July to November, the mean
cloud cover is increased hugely from the average mean percentage which
indicates the highest amount of diffuse solar radiation to the earth surface.
The direct solar radiation is higher from December to June due to the minimum
sky cover which results in intense solar radiation. The annual sky cover ranges
from 21 to 89%.
Also, it is
observed from the sky illumination data that the illumination range is high in
the summer months with a maximum of 95000 lux. Therefore, indoor comfort level
should be maintained with adequate shading on openings and on exposed surfaces.
Also, effective shading is required to dissipate radiation and heat gain.
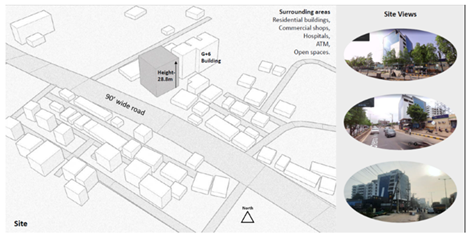
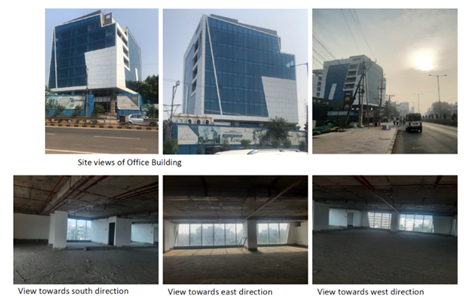
Details of the Selected Office Building
The building site
is encompassed by commercial properties on the east, west, and south sides,
while residential spaces border the northern side. Building’s front façade is
facing towards south-west direction. It is curtain-glazed from top to bottom.
The site location and site context are shown in Figure 4. The selected office building has a site
area of 544.8 m2 and total built-up area of 6,405 m2 spread over G+7 floors
with 2 basement parking. Total height of the building above ground is 28.8m and
floor to floor height is 3.6m. Surrounding areas include residential buildings,
commercial shops, hospitals, ATM and open spaces. The views of the selected
office building are shown in Figure 5. The surface area/ volume ratio is
calculated as 3821/14475.6 = 0.26, which is compact. The occupancy capacity is
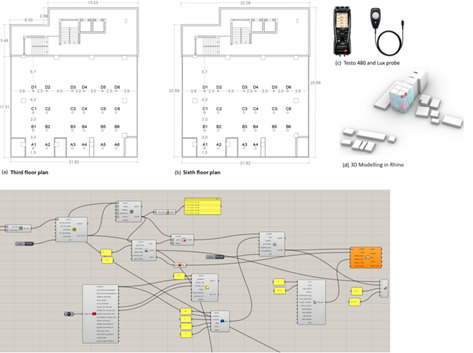
100-150 persons in each floor. The floor plans and elevations of the selected
office building are shown in Figure 6.
|
Figure 4 |
|
|
|
Figure 4 Site Details and Site Context of the
Selected Office Building. Source: Authors |
|
Figure 5
|
|
Figure 5 Views of the Selected Office Building. Source: Authors |
|
Figure 6
|
|
Figure 6 Floor Plans and Elevations of the Selected Office
Building. Source: Authors |
The researchers Day et al. (2019) have highlighted that useful insights can be
obtained by conducting the on-site questionnaire survey regarding visual
comfort with the occupants. Hence, in the present study, the visual comfort
questionnaire survey is conducted, as per the International Organization for Standardization. (2025). guidelines, with the users who uses office
for daytime working. Aspects covered in the on-site questionnaire survey are
comfort factors, user preferences in the office, artificial lighting needs and
discomfort experienced by existing openings, while making observations as well.
The sample visual comfort questionnaire is given in Annexure-1. The findings
are discussed in the following sections.
Simulation Model and Validation
In the present
study simulation tools used for the visual performance analysis include Rhino
and Grasshopper (Ladybug and Honeybee plug-ins). Further, Honeybee for Rhino is
used for the daylight simulations with Radiance and Daysim. The details of the
baseline simulation model of the selected office building developed in Rhino is
shown in Figure 7 (d)and(e).
|
Figure7
|
|
Figure 7 Details Regarding Daylight Analysis of the
Selected Office Building. Source: Authors |
To validate the
simulation analysis, on-site measurement of illumination level is done by using
the Lux meter (Testo 480) and Lux Probe (see Figure 7(c)) in the third floor (see Figure 7(a)) and sixth floor (see Figure 7(b)) of the office building during March 2 and
3, 2024. The sky condition is clear sky with sun. The on-site measured lux
values are given in Table 2 to Table 5.
|
Table 2 |
|
Table 2 Measurement of Light Intensity (Lux) in Third Floor
Office Space on 2nd Feb 2024. |
|||||||||||||||||||||||||||||||||||||||||||||||
|
Measur-ment
points Time |
A1 |
A2 |
A3 |
A4 |
A5 |
A6 |
B1 |
B2 |
B3 |
B4 |
B5 |
B6 |
C1 |
C2 |
C3 |
C4 |
C5 |
C6 |
D1 |
D2 |
D3 |
D4 |
D5 |
D6 |
|
||||||||||||||||||||||
|
8:00
AM |
572 |
243 |
585 |
218 |
487 |
492 |
161 |
131 |
111 |
165 |
315 |
854 |
154 |
105 |
144 |
167 |
291 |
1077 |
160 |
115 |
110 |
269 |
400 |
605 |
|||||||||||||||||||||||
|
10:00
AM |
1200 |
460 |
641 |
362 |
640 |
745 |
298 |
297 |
198 |
239 |
327 |
731 |
238 |
200 |
185 |
208 |
354 |
556 |
108 |
161 |
108 |
161 |
210 |
306 |
|||||||||||||||||||||||
|
12:00
PM |
569 |
665 |
614 |
527 |
530 |
606 |
372 |
376 |
246 |
294 |
394 |
564 |
380 |
230 |
174 |
198 |
255 |
416 |
128 |
172 |
102 |
140 |
159 |
292 |
|||||||||||||||||||||||
|
2:00
PM |
544 |
617 |
548 |
541 |
553 |
675 |
477 |
460 |
221 |
310 |
319 |
528 |
432 |
384 |
192 |
189 |
281 |
299 |
247 |
197 |
129 |
145 |
155 |
154 |
|||||||||||||||||||||||
|
4:00
PM |
420 |
593 |
337 |
412 |
413 |
538 |
406 |
349 |
206 |
254 |
255 |
498 |
965 |
410 |
265 |
153 |
145 |
248 |
444 |
396 |
280 |
137 |
118 |
127 |
|||||||||||||||||||||||
|
6:00
PM |
8 |
12 |
7 |
10 |
8 |
9 |
7 |
4 |
2 |
3 |
3 |
3 |
4 |
2 |
3 |
2 |
3 |
6 |
6 |
5 |
4 |
3 |
3 |
5 |
|||||||||||||||||||||||
Table 3
|
Table 3 Measurement of Light Intensity
(Lux) in Sixth Floor Office Space on 2nd Feb 2024. |
||||||||||||||||||||||
|
Measure-ment
points Time |
A1 |
A2 |
A3 |
A4 |
B1 |
B2 |
B3 |
B4 |
B5 |
B6 |
C1 |
C2 |
C3 |
C4 |
C5 |
C6 |
D1 |
D2 |
D3 |
D4 |
D5 |
D6 |
|
8:00
AM |
849 |
364 |
472 |
426 |
130 |
120 |
109 |
134 |
197 |
238 |
69 |
68 |
70 |
111 |
209 |
596 |
119 |
85 |
120 |
289 |
560 |
616 |
|
10:00
AM |
825 |
700 |
833 |
702 |
167 |
160 |
159 |
180 |
165 |
326 |
111 |
126 |
108 |
108 |
192 |
276 |
168 |
117 |
65 |
174 |
225 |
294 |
|
12:00
PM |
761 |
870 |
635 |
1061 |
207 |
229 |
187 |
219 |
106 |
307 |
287 |
135 |
112 |
98 |
100 |
131 |
223 |
125 |
50 |
73 |
105 |
230 |
|
2:00
PM |
623 |
902 |
524 |
1442 |
225 |
251 |
178 |
198 |
98 |
252 |
317 |
153 |
110 |
94 |
98 |
159 |
584 |
219 |
107 |
63 |
94 |
198 |
|
4:00
PM |
610 |
890 |
422 |
1439 |
168 |
212 |
152 |
209 |
69 |
107 |
416 |
214 |
120 |
90 |
66 |
108 |
624 |
448 |
195 |
58 |
85 |
87 |
|
6:00
PM |
19 |
19 |
20 |
34 |
13 |
5 |
3 |
3 |
3 |
5 |
15 |
3 |
2 |
2 |
3 |
4 |
4 |
3 |
4 |
2 |
3 |
5 |
Table 4
|
Table 4 Measurement of Light Intensity
(Lux) in Third Floor Office Space on 3rd Feb 2024. |
||||||||||||||||||||||||
|
Measure-ment
points Time |
A1 |
A2 |
A3 |
A4 |
A5 |
A6 |
B1 |
B2 |
B3 |
B4 |
B5 |
B6 |
C1 |
C2 |
C3 |
C4 |
C5 |
C6 |
D1 |
D2 |
D3 |
D4 |
D5 |
D6 |
|
8:00
AM |
552 |
240 |
575 |
218 |
477 |
491 |
159 |
130 |
113 |
175 |
311 |
864 |
154 |
105 |
154 |
177 |
281 |
1087 |
168 |
115 |
110 |
259 |
408 |
598 |
|
10:00
AM |
1200 |
470 |
638 |
362 |
630 |
725 |
298 |
287 |
197 |
235 |
324 |
730 |
248 |
200 |
188 |
208 |
354 |
556 |
108 |
159 |
108 |
166 |
212 |
309 |
|
12:00
PM |
559 |
663 |
614 |
527 |
530 |
606 |
370 |
376 |
249 |
294 |
392 |
574 |
380 |
233 |
178 |
202 |
251 |
418 |
123 |
170 |
101 |
142 |
159 |
290 |
|
2:00
PM |
534 |
618 |
538 |
540 |
551 |
675 |
475 |
460 |
223 |
300 |
319 |
528 |
432 |
374 |
192 |
189 |
280 |
301 |
247 |
194 |
132 |
145 |
151 |
151 |
|
4:00
PM |
410 |
583 |
337 |
411 |
403 |
528 |
403 |
347 |
216 |
254 |
259 |
498 |
975 |
407 |
255 |
150 |
141 |
253 |
454 |
396 |
286 |
147 |
119 |
122 |
|
6:00
PM |
8 |
12 |
7 |
10 |
8 |
9 |
7 |
4 |
2 |
3 |
3 |
3 |
4 |
2 |
3 |
2 |
3 |
6 |
6 |
5 |
4 |
3 |
3 |
5 |
Table 5
|
Table 5 Measurement of Light Intensity (Lux) in Sixth Floor
Office Space on 3rd Feb 2024. |
||||||||||||||||||||||
|
Measure-ment
points Time |
A1 |
A2 |
A3 |
A4 |
B1 |
B2 |
B3 |
B4 |
B5 |
B6 |
C1 |
C2 |
C3 |
C4 |
C5 |
C6 |
D1 |
D2 |
D3 |
D4 |
D5 |
D6 |
|
8:00
AM |
844 |
360 |
462 |
423 |
127 |
115 |
109 |
137 |
197 |
238 |
72 |
68 |
73 |
115 |
209 |
626 |
119 |
82 |
130 |
293 |
570 |
636 |
|
10:00
AM |
820 |
700 |
830 |
699 |
167 |
158 |
159 |
176 |
161 |
328 |
111 |
128 |
109 |
106 |
192 |
276 |
166 |
117 |
65 |
177 |
235 |
299 |
|
12:00
PM |
761 |
867 |
631 |
1051 |
209 |
227 |
185 |
215 |
102 |
307 |
287 |
132 |
110 |
99 |
102 |
136 |
220 |
125 |
50 |
70 |
105 |
232 |
|
2:00
PM |
629 |
901 |
524 |
1442 |
225 |
252 |
179 |
198 |
102 |
252 |
327 |
153 |
114 |
96 |
94 |
159 |
588 |
219 |
117 |
61 |
96 |
203 |
|
4:00
PM |
610 |
888 |
422 |
1429 |
172 |
215 |
155 |
209 |
75 |
107 |
414 |
210 |
120 |
90 |
69 |
106 |
621 |
453 |
195 |
52 |
82 |
87 |
|
6:00
PM |
19 |
19 |
20 |
34 |
13 |
5 |
3 |
3 |
3 |
5 |
15 |
3 |
2 |
2 |
3 |
4 |
4 |
3 |
4 |
2 |
3 |
5 |
Further, the lux
values are calculated for the same dates, same time-intervals, same sky
condition and same floors with the Rhino. The calculated values are shown in Table 6 to Table 9. To assess the consistency between the
measured values and calculated values Pearson’s Correlation statistical
analysis is done. In statistics, correlation refers to the degree of linear
association between two variables. A
correlation coefficient is employed to gauge the extent of the association
between these variables, with values ranging from -1 to 1. When the magnitude
of a correlation coefficient falls between 0.9 and 1.0, it indicates a high
degree of correlation between the variables. Similarly, a coefficient falling
between 0.7 and 0.9 is indicative of a strong correlation, while one between
0.5 and 0.7 is considered moderate. Correlation coefficients ranging from 0.3
to 0.5 are generally considered low. In the present study correlation coefficient
ranges from 0.63 - 0.75 which shows high level of correlation. Hence, further
study is carried out using the same simulation tools.
Table 6.
|
Table 6 Calculated Light Intensity (Lux) in Third Floor Office
Space on 2nd Feb 2024. |
||||||||||||||||||||||||
|
Measure-ment
points Time |
A1 |
A2 |
A3 |
A4 |
A5 |
A6 |
B1 |
B2 |
B3 |
B4 |
B5 |
B6 |
C1 |
C2 |
C3 |
C4 |
C5 |
C6 |
D1 |
D2 |
D3 |
D4 |
D5 |
D6 |
|
8:00
AM |
2853 |
1138 |
1956 |
1229 |
2158 |
1249 |
739 |
575 |
520 |
698 |
1069 |
1417 |
635 |
458 |
464 |
752 |
1236 |
1639 |
586 |
410 |
482 |
888 |
1225 |
1516 |
|
10:00
AM |
1992 |
1928 |
2402 |
1893 |
2841 |
2648 |
1253 |
937 |
779 |
924 |
1297 |
1731 |
1075 |
704 |
601 |
702 |
1087 |
1975 |
1010 |
578 |
467 |
571 |
1022 |
2153 |
|
12:00
PM |
2767 |
2306 |
2010 |
2218 |
2428 |
2332 |
1399 |
1100 |
778 |
974 |
1194 |
1460 |
1283 |
800 |
619 |
662 |
864 |
1318 |
1220 |
654 |
466 |
472 |
693 |
1279 |
|
2:00
PM |
2355 |
2551 |
1630 |
2495 |
2124 |
2551 |
1571 |
1202 |
772 |
970 |
1082 |
1393 |
1750 |
960 |
674 |
643 |
806 |
1161 |
1834 |
898 |
528 |
479 |
622 |
1097 |
|
4:00
PM |
1666 |
2370 |
1230 |
2387 |
1435 |
2261 |
1633 |
1181 |
699 |
751 |
764 |
1011 |
1666 |
1320 |
752 |
586 |
596 |
815 |
9021 |
1462 |
726 |
480 |
475 |
777 |
|
6:00
PM |
418 |
619 |
334 |
563 |
388 |
638 |
372 |
264 |
180 |
202 |
206 |
290 |
610 |
409 |
323 |
187 |
205 |
271 |
728 |
547 |
476 |
412 |
410 |
486 |
Table 7
|
Table 7 Calculated Light Intensity (Lux) in
Sixth Floor Office Space on 2nd Feb 2024. |
||||||||||||||||||||||
|
Measure-ment
points Time |
A1 |
A2 |
A3 |
A4 |
B1 |
B2 |
B3 |
B4 |
B5 |
B6 |
C1 |
C2 |
C3 |
C4 |
C5 |
C6 |
D1 |
D2 |
D3 |
D4 |
D5 |
D6 |
|
8:00
AM |
2736 |
1089 |
1871 |
1198 |
613 |
511 |
468 |
550 |
478 |
593 |
578 |
412 |
427 |
597 |
930 |
1336 |
495 |
362 |
457 |
829 |
1198 |
1924 |
|
10:00
AM |
2894 |
1798 |
2385 |
1865 |
1028 |
845 |
696 |
754 |
513 |
747 |
989 |
622 |
511 |
555 |
768 |
1617 |
825 |
468 |
382 |
480 |
908 |
2058 |
|
12:00
PM |
2493 |
2189 |
2015 |
2197 |
1127 |
977 |
714 |
802 |
412 |
548 |
1145 |
698 |
539 |
494 |
552 |
1005 |
998 |
525 |
369 |
386 |
574 |
1182 |
|
2:00
PM |
2080 |
2416 |
1603 |
2455 |
1194 |
1041 |
665 |
765 |
379 |
504 |
1506 |
817 |
555 |
485 |
512 |
876 |
1512 |
691 |
417 |
361 |
516 |
990 |
|
4:00
PM |
1438 |
2194 |
1212 |
2369 |
1088 |
939 |
557 |
585 |
269 |
359 |
1986 |
1053 |
597 |
406 |
387 |
614 |
1983 |
1201 |
577 |
355 |
412 |
690 |
|
6:00
PM |
370 |
553 |
332 |
552 |
224 |
197 |
135 |
164 |
88 |
128 |
512 |
322 |
164 |
132 |
146 |
225 |
541 |
369 |
357 |
344 |
391 |
483 |
Table 8
|
Table 8 Calculated Light Intensity (Lux) in
Third Floor Office Space on 3rd Feb 2024. |
||||||||||||||||||||||||
|
Measure-ment
points Time |
A1 |
A2 |
A3 |
A4 |
A5 |
A6 |
B1 |
B2 |
B3 |
B4 |
B5 |
B6 |
C1 |
C2 |
C3 |
C4 |
C5 |
C6 |
D1 |
D2 |
D3 |
D4 |
D5 |
D6 |
|
8:00
AM |
2814 |
1127 |
1894 |
1223 |
2128 |
1246 |
730 |
567 |
526 |
710 |
1069 |
1417 |
635 |
458 |
464 |
752 |
1236 |
1639 |
586 |
410 |
482 |
888 |
1225 |
1516 |
|
10:00
AM |
1979 |
1901 |
2356 |
1873 |
2606 |
2016 |
1251 |
949 |
762 |
916 |
1297 |
1731 |
1075 |
704 |
601 |
702 |
1087 |
1975 |
1010 |
578 |
467 |
571 |
1022 |
2153 |
|
12:00
PM |
2746 |
2301 |
2011 |
2213 |
2417 |
2321 |
1400 |
1098 |
783 |
977 |
1194 |
1460 |
1283 |
800 |
619 |
662 |
864 |
1318 |
1220 |
654 |
466 |
472 |
693 |
1279 |
|
2:00
PM |
2340 |
2545 |
1616 |
2482 |
2116 |
2521 |
1568 |
1199 |
776 |
956 |
1082 |
1393 |
1750 |
960 |
674 |
643 |
806 |
1161 |
1834 |
898 |
528 |
479 |
622 |
1097 |
|
4:00
PM |
1645 |
2339 |
1221 |
2374 |
1314 |
1994 |
1627 |
1178 |
720 |
750 |
764 |
1011 |
1966 |
1320 |
752 |
586 |
596 |
815 |
1021 |
1462 |
726 |
480 |
475 |
777 |
|
6:00
PM |
417 |
610 |
328 |
556 |
388 |
623 |
369 |
265 |
176 |
191 |
206 |
290 |
610 |
409 |
323 |
187 |
205 |
271 |
728 |
547 |
476 |
412 |
410 |
486 |
Table 9
|
Table 9 Calculated Light Intensity
(Lux) in Sixth Floor Office Space on 3rd Feb 2024. |
||||||||||||||||||||||
|
Measure-ment points Time |
A1 |
A2 |
A3 |
A4 |
B1 |
B2 |
B3 |
B4 |
B5 |
B6 |
C1 |
C2 |
C3 |
C4 |
C5 |
C6 |
D1 |
D2 |
D3 |
D4 |
D5 |
D6 |
|
8:00 AM |
2700 |
1076 |
1837 |
1195 |
604 |
498 |
469 |
566 |
477 |
593 |
583 |
413 |
435 |
607 |
933 |
1461 |
494 |
353 |
480 |
838 |
1275 |
2032 |
|
10:00 AM |
2865 |
1783 |
2349 |
1842 |
1026 |
836 |
692 |
735 |
505 |
759 |
980 |
625 |
504 |
543 |
778 |
1619 |
823 |
462 |
383 |
491 |
929 |
2070 |
|
12:00 PM |
2495 |
2163 |
2000 |
2188 |
1138 |
981 |
703 |
795 |
405 |
547 |
1144 |
693 |
523 |
501 |
565 |
1014 |
1009 |
525 |
365 |
378 |
579 |
1185 |
|
2:00 PM |
2061 |
2409 |
1606 |
2452 |
1196 |
1035 |
669 |
766 |
386 |
504 |
1521 |
815 |
556 |
493 |
525 |
871 |
1542 |
699 |
440 |
374 |
522 |
1016 |
|
4:00 PM |
1437 |
2180 |
1208 |
2345 |
1095 |
942 |
561 |
583 |
283 |
356 |
1974 |
1035 |
595 |
406 |
395 |
611 |
1970 |
1218 |
574 |
384 |
408 |
700 |
|
6:00 PM |
368 |
552 |
328 |
549 |
225 |
195 |
141 |
151 |
93 |
125 |
548 |
343 |
170 |
145 |
150 |
227 |
552 |
378 |
354 |
385 |
414 |
507 |
RESULTS AND DISCUSSIONS
For time and
physical constraint and easier understanding visual performance simulation
analysis has been conducted for the four crucial dates - 21st March (equinox),
21st June (summer solstice), 21st September (equinox), and 21st December
(winter solstice) of the year, representing summer, monsoon, and winter
conditions in Vijayawada. For the more critical and finer selection of kinetic
façade, daylight performance simulation analysis may be conducted for each
month of a year. The findings from the analysis are synthetized and discussed
in the following sections.
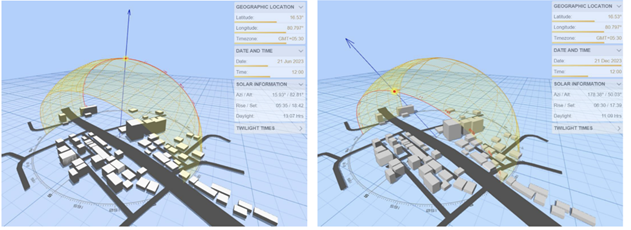
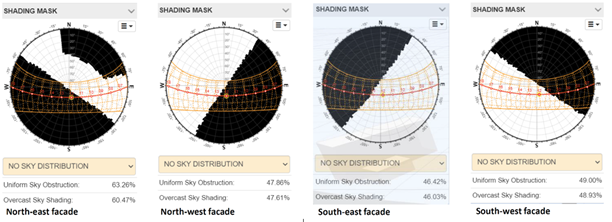
Sun-path and Shadow Analysis
The site is
exposed to the direct sun which results in direct heat gain. So proper shading
devices can help in reducing direct heat gain. Regarding the building site, 3D
sun-path for summer solstice (for 21st June - Time: 12:00 pm, Azimuth angle:
15.93°, Altitude angle: 82.81°, Daylight hours: 13.07 Hrs.) and winter solstice
(for 21st December - Time: 12:00 pm, Azimuth angle: 178.38°, Altitude angle:
50.03°, Daylight hours: 11.09 Hrs.) are shown in Figure 8. Further, shadow analysis of the office
building facades for a representative hot summer (21st March) day is shown in Figure 9. It can be observed from the shadow analysis
that north-east façade is subjected to the solar radiation from 7am to 11am in
the morning; north-west façade is subjected to the solar radiation from 1pm to
6pm; south-east façade is subjected to the solar radiation from 7am to 1pm; and
south-west façade is subjected to the solar radiation from 11am to 6pm. Hence,
south-west, south-east and north-west façades of the building should be shaded
to reduce the solar heat gain. The solar altitude angle values for the selected
site location in Vijayawada during different season are shown in Table 10.
|
Figure 8
|
|
Figure 8 3D Sun-Path for Summer and Winter
Solstice. Source: Authors and Andrew Marsh tool |
|
Figure 9
|
|
Figure 9 Shadow Analysis of the Office Building
Facades. Source: Authors and Andrew Marsh tool |
Table 10
|
Table 10 Sun Angles for the Selected Site Location in Vijayawada. Source: Andrew Marsh Tool |
||||
|
Location |
Enikepadu, Vijayawada,
Andhra Pradesh (16.53° N Lat., 80.797° E Long.) |
|||
|
Time |
Solar
Altitude Angles |
|||
|
|
Spring
Equinox 21st
March |
21st
June |
Autumn
Equinox 21st
September |
Winter
Solstice 21st
December |
|
7.00
am |
18.09° |
24.73° |
21.78° |
11.98° |
|
8.00
am |
32.31° |
38.41° |
35.98° |
24.09° |
|
9.00
am |
46.25° |
52.16° |
49.85° |
35.01° |
|
10.00
am |
59.44° |
65.79° |
62.82° |
43.83° |
|
11.00
am |
70.26° |
78.54° |
72.63° |
49.17° |
|
12.00
pm |
73.21° |
81.49° |
72.65° |
49.60° |
|
1.00
pm |
65.28° |
69.76° |
62.86° |
44.98° |
|
2.00
pm |
52.89° |
56.24° |
49.90° |
36.61° |
|
3.00
pm |
39.23° |
42.49° |
36.03° |
25.96° |
|
4.00
pm |
25.12° |
28.78° |
21.83° |
14° |
|
5.00
pm |
10.85° |
15.23° |
7.56° |
1.51° |
|
6.00
pm |
-3.52° |
2.14° |
-6.89° |
-12.06° |
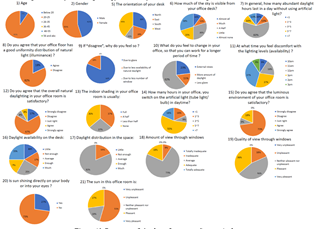
Visual Comfort Questionnaire Survey of Office Staff
The study involved
field-survey for gathering data through observations and distributing
questionnaires to individuals who utilize the office during the daytime for
work purposes. In total, 44 (20 male and 24 female) responses are taken at the
site. The analysis of the responses of the visual comfort questionnaire survey
are shown in Figure 10. The questionnaire is shared with the users
of the office building as a google form as well as hard copies.
It is found from
the analysis that users with east orientation desk feels discomfort from 10am
to 12pm. Users with west orientation desk feels discomfort from 2pm to 4pm.
Users with south orientation desk feels discomfort from 8am to 4pm throughout
the day. Users with north orientation desk don’t receive required natural
daylight as well as glare. Daylight distribution in the space is observed to be
average by 82% users and not enough by rest users. Amount of view through
windows is observed to be average by 73% users, inadequate by 9% users and
adequate by 18% users. Quality of view through window is observed to be
unpleasant by 18%, neither pleasant nor unpleasant by 46% and pleasant by 36%.
The Sun in the office space is observed to be unpleasant by 55%, neither
pleasant nor unpleasant by 18% and pleasant by 27%. The luminous environment of
the office space is not satisfactory as per 73% users. Office uses artificial
lighting for 5~7 hrs. by 55% users. Office users do not agree with the uniform
distribution of natural daylight in the office space due to glare by 82% users
and due to less availability of natural daylight by 18% users.
Useful insights
obtained through the visual comfort questionnaire survey will be helpful to
take necessary measures by the building owners and building designers and
architects to improve the use of natural daylight in the office space and to
increase the comfort level of the users which in turn can improve the office
productivity, building energy-efficiency, and user wellbeing.
|
Figure 10
|
|
Figure 10 Responses of Visual Comfort Survey. Source: Authors |
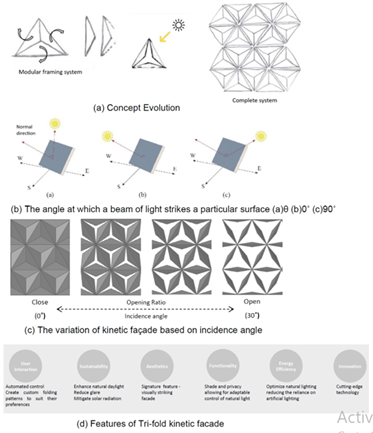
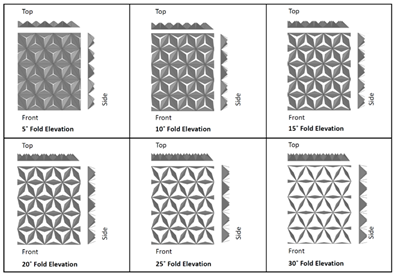
Kinetic Façade Design Process
Conceptual Approach
As per the
researchers Tabadkani
et al. (2018), Hosseini
et al. (2019), Tabadkani
et al. (2019), Hosseini
et al. (2021), Tabadkani
et al. (2021), the tri-fold kinetic façade minimizes
negative spaces and creates a visually cohesive and dynamic architectural
feature. Various features of tri-fold kinetic façade are shown in Figure 11. The angle of opening of the tri-fold
kinetic façade of each module is incremented to every 5˚ for conducting
daylighting simulations (see Figure 12).
|
Figure 11
|
|
Figure 11 Features of Tri-Fold Kinetic Façade. Source: Adapted by Authors |
|
Figure 12
|
|
Figure 12 Kinetic Façade Angles with Top, Front and
Side Elevation. Source: Adapted by Authors |
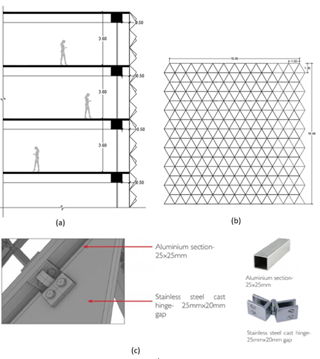
Architectural details of Kinetic Façade
The components of
the proposed kinetic façade module are shown in Figure 11(a)and(b). The opening ratio of the kinetic
façade panels varies from 0˚ to 30˚ (see Figure 11 (c)). Kinetic façade panels are mounted on a
triangular grid frame work made of Aluminum section 25 x 25mm. Panel is
connected to the frame with stainless steel cast hinge - 25 x 20mm gap (see Figure 13(c)). Sectional detail with the fixing
position of the kinetic façade is shown in Figure 13(a). Each floor has a height of 3.6m between
finished floor level (FFL) to FFL. The extended slab projection on every floor
makes it viable to fix the external envelop easily. Being easily accessible
through the curtain wall, cleaning and maintenance also becomes convenient.
Grid framework for placing the kinetic façade modules is shown in Figure 13(b). Reyno bond- composite aluminum sheet is
chosen as appropriate material for kinetic façade module that can contribute to
a more sustainable and environmentally friendly building design.
|
Figure 13
|
|
Figure 13 (a) Sectional Detail Showing the Fixing
Position of the Kinetic Façade; (B) Grid Framework for Placing Kinetic Façade
Modules; (C) Panel to Frame Hinge Joinery Details. Source: Authors |
Design Iterations
The list of
parameters considered in the design iteration process through simulation tool
is shown in Table 11.
Table 11
|
Table 11 List of Parameters Considered |
|
|
Parameters |
Input |
|
Purpose |
Visual comfort |
|
Kinetic
quality |
Mutual
shading Daylight
amount and quality |
|
Movement
type |
Fold |
|
Application
in project |
South/
east/ west facade |
|
Façade
material |
Reyno
bond- composite aluminum sheet |
|
Variable considered |
Panel
size: x=1m, x=1.5m and x=2m Folding
angle: 5˚, 10˚, 15˚ and 20˚ |
|
Parameters for assessment |
sDA,
ASE and sDG (Disturbing Glare) |
|
Control |
Semi-Automated
control |
|
Pattern features |
Completely
mutable shading Reduce reliance on artificial lighting during the day by
maximizing the utilization of natural daylight. Controlling solar gain,
glare, and privacy |
For x=1m
The first set of
simulations is done for x=1m i.e., 4 kinetic panel modules vertically mounted
for each floor. The angle of openings is incremented in multiples of 5 degree.
The details are shown in Figure 14(a)(b)and(c). Simulation results for
10-degree fold are shown in Figure 15. Similar simulation analysis is done for
other fold values as well. The findings
from the analysis for different fold values are given in Table 12.
|
Figure 14
|
|
Figure 14 Details Regarding Different Selected
Module Size. Source: Authors |
|
Figure 15
|
|
Figure 15 Simulation Results For X=1m and 10-Degree
Fold. Source: Authors and Rhino Software, Grasshopper
(Ladybug and Honeybee Plugins) |
Table 12
|
Table 12 Simulation results for x=1m. |
||||
|
Parameter |
5˚ |
10˚ |
15˚ |
20˚ |
|
sDA300/50% |
44.30% |
69.30% |
85.60% |
96.90% |
|
ASE1000,250 |
3.10% |
8.20% |
14.30% |
|
|
Avg. annual lux value |
552
lux |
847 lux |
1114
lux |
1365
lux |
|
Intolerable
glare (sDG) |
3.20% |
7.50% |
15.20% |
21.60% |
|
Quality views |
94.90% |
94.90% |
94.90% |
94.90% |
|
LEED Compliant |
1-credit |
2-credits |
3-credits |
3-credits |
For x=1.5m
Next set of
simulations is done for x=1.5m i.e., 3 kinetic panel modules vertically mounted
for each floor. The angle of openings is incremented in multiples of 5 degree.
The details are shown in 14(d)(e)and(f). Simulation results for 10-degree fold
are shown in Figure 16. Similar simulation analysis is done for
other fold values as well. The findings
from the analysis for different fold values are given in Table 13.
|
Figure 16
|
|
Figure 16 Simulation Results for x=1.5m and 10-Degree
Fold. Source: Authors and Rhino Software,
Grasshopper (Ladybug and Honeybee plugins) |
Table 13
|
Table 13 Simulation Results for x=1.5m. |
||||
|
Parameter |
5˚ |
10˚ |
15˚ |
20˚ |
|
sDA300/50% |
45.20% |
64.50% |
76.80% |
88.60% |
|
ASE1000,250 |
4.30% |
6% |
9.80% |
12.20% |
|
Avg. annual lux value |
621
lux |
876
lux |
1120
lux |
1349
lux |
|
Intolerable
glare (sDG) |
4.30% |
6.80% |
12.80% |
18.60% |
|
Quality views |
95% |
95% |
95% |
95% |
|
LEED Compliant |
1-credit |
3-credits |
3-credits |
3-credits |
For x=2m
Next set of
simulations is done for x=2m i.e., 2 kinetic panel modules vertically mounted
for each floor. The angle of openings is incremented in multiples of 5 degree.
The details are shown in 14(g)(h)and(i). Simulation results for 10-degree fold
are shown in Figure 17. Similar simulation analysis is done for
other fold values as well. The findings
from the analysis for different fold values are given in Table 14.
|
Figure 17
|
|
Figure 17 Simulation Results For x=2m and 10-Degree
Fold. Source: Authors and Rhino Software,
Grasshopper (Ladybug and Honeybee Plugins) |
Table
14
|
Table 14 Simulation Results for x=2m. |
||||
|
Parameter |
5˚ |
10˚ |
15˚ |
20˚ |
|
SDA300/50% |
46.50% |
61.30% |
72.60% |
82.20% |
|
ASE1000,250 |
6.30% |
7.90% |
12.60% |
15.10% |
|
Avg. annual lux value |
723
lux |
952
lux |
1174
lux |
1380
lux |
|
Intolerable
glare (sDG) |
6.20% |
8.10% |
12.80% |
17.90% |
|
Quality views |
95% |
95% |
95% |
95% |
|
LEED Compliant |
1-credit |
3-credits |
2-credits |
3-credits |
Results of the Daylight Simulation
As per design
iteration I, II and III, iteration II is considered as it shows better results
compared with I and III with respect to sDA, ASE and sDG. After considering
design iteration II, (i.e., x=1.5m) the daylight simulations are done for fifth
floor of the office building, on the four important dates of the year, keeping
time constant at 12:30pm - 21st March (equinox), 21st June (summer solstice),
21st September (equinox), and 21st December (winter solstice). The simulations
are carried out for every 5˚ increment in the angle of opening of the
kinetic wings. The results are obtained for – (i) Spatial Daylight Autonomy;
(ii) Annual Sunlight Exposure, (iii) Point in-time daylight illuminance, (iv)
Annual glare, and (v) View analysis. The simulations are not carried out beyond
opening angle of 20˚ because it shows excessive glare. The results of the
daylight simulations are shown in Figure 18.
|
Figure 18
|
|
Figure 18 Results of the Daylight Simulation for
x=1.5m. Source: Authors and Rhino and Grasshopper
(Ladybug and Honeybee Plugins) |
In absence of the
proposed kinetic façade, for the fifth floor of the office building the ASE
value is calculated as 45.5% and annual disturbing glare (sDG) is calculated as
48.4% through simulation analysis. Hence, as per the details shown in Figure 18, by designing the proposed adaptive kinetic
façade, ASE can be reduced by 73-90% and sDG can be reduced by 73-91% which is
significant improvement. This will improve the indoor comfort condition by
creating cooling effect. However, the detailed thermal performance analysis of
the proposed kinetic façade is beyond the scope of the present research.
Design Iterations
A number of design
iterations with all possible combinations of angle openings (specific angles
with 5˚ increment, i.e., 5˚, 10˚, 15˚, and 20˚) on the
three façade that are south façade, west façade and east façade are performed to
evaluate the visual performance. For each month, 24 iterations with all
possible angles are evaluated for each time period. In total, 144 iterations
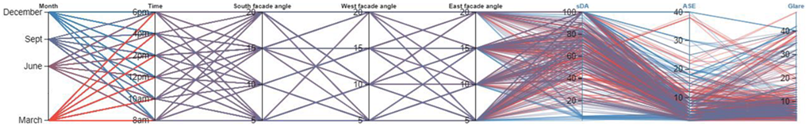
are evaluated for each month (see Figure 19). Here, 5˚ open means mostly closed and
20˚ open means more than 50% open. The best combinations of wing angles
are selected based on its compliance with LEED daylighting standards. The
daylighting metrics are sDA, ASE and Glare.
|
Figure 19
|
|
Figure 19 Combination of Opening Angles and its Daylighting
Performance. Source: Authors and Design Builder |
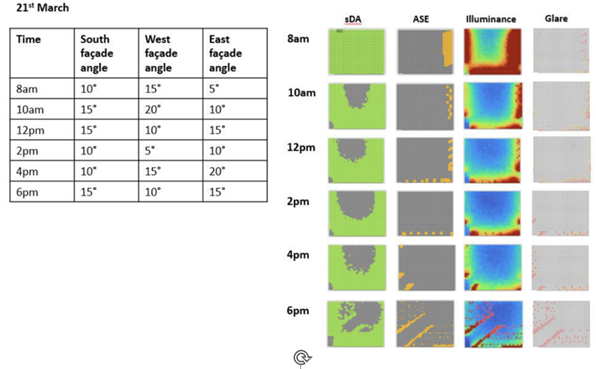
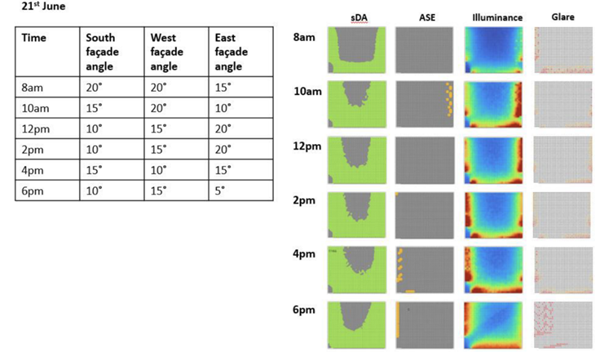
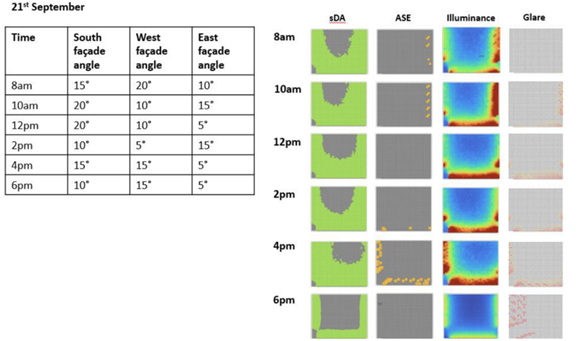
Optimal Opening
Angle of Façade Panel
As per the
simulation analysis, optimal opening angles and daylighting plans in terms of
sDA, ASE and glare for respective opening angles of south, east and west facade
for 21st March, 21st June, 21st September, and 21st December at timings from
8am-6pm are shown Figure 20, 21, 22 and 23 respectively.
|
Figure 20
|
|
Figure 20 Optimal Opening Angles and Daylighting
Plans for 21st March. Source: Authors |
|
Figure 21
|
|
Figure 21 Optimal Opening
Angles and Daylighting Plans for 21st June. Source: Authors |
|
Figure 22
|
|
Figure 22 Optimal Opening
Angles and Daylighting Plans for 21st September. Source: Authors |
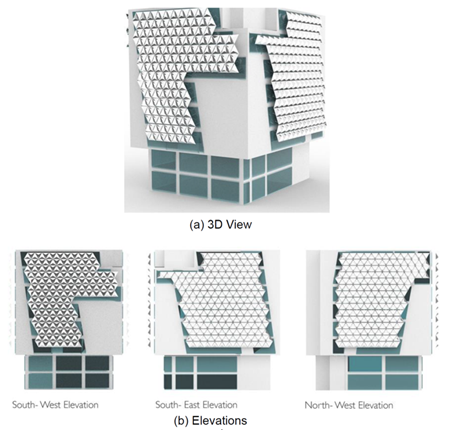
Views of
Proposed Kinetic Façade
A tri-fold kinetic
façade has been designed to enhance the visual performance of a building, as
well as to create a dynamic and interactive architectural feature that also
improves the functionality and aesthetic quality of buildings. The detailed 3D
view and elevations of the office building with the proposed kinetic façade is
shown in Figure 24.
|
Figure 24
|
|
Figure 24 View and Elevations of the Office Building
with the Proposed Kinetic Façade. Source: Authors |
CONCLUSION
One of the crucial
aspects of the scientific process is replicability. This study presents a novel
computational approach by integrating simulation tools with design process in
real time that enables a wide range of stakeholders, including architects, designers,
researchers, and students, to investigate and analyze the impact of kinetic
facades on visual comfort metrics. By employing an optimization framework, the
study addresses the critical stages of achieving optimal interior illuminance
and user visual comfort in the office building, demonstrating the novelty and
effectiveness of the proposed approach. Further, the results obtained from the
calculation by the simulation tool are validated with the data obtained through
on-site physical measurement which indicates the robustness of the proposed
computational approach. Although,
aspects of thermal performance, energy-efficiency, etc. can be added to this
framework in the future research-works to further assist in the optimal design
of building façade.
Looking forward,
the development of adaptive kinetic pattern design will be a significant
priority in computational design theory and practice, particularly in the
context of parametric design systems. While devising a new pattern parametric
design strategy can be a challenging task, utilizing existing design strategies
as a reference point could serve as a useful guideline for generating kinetic
patterns.
The findings of
the study provide valuable insights into the potential of kinetic facades to
enhance visual comfort, highlighting the importance of continued research and
development in this field. The study's approach and tool can help architects
and designers in developing effective and sustainable facade design solutions
that prioritize user comfort while simultaneously meeting performance and
aesthetic requirements. Overall, this study represents a crucial step towards
achieving optimal visual comfort in buildings, and it opens new avenues for
future research in this area.
ACKNOWLEDGMENTS
None.
REFERENCES
Ahmed,
M. M. S., Abel-Rahman, A. K., and Ali, A. H. H. (2015). Development of Intelligent Façade
Based on Outdoor Environment and
Indoor Thermal Comfort. Procedia Technology, 19, 742–749. https://doi.org/10.1016/j.protcy.2015.02.105
Al Bahr Towers, Abu Dhabi, UAE. (2013). Robert Hopkins Architects.
Andrew Marsh. (n.d.). Weather Data Web Tool.
Bashy, L. N. Y. K., and Alchalabi, O. Q. A. (2023). Design Procedures of Double-Skin Façades for Achieving Internal Thermal Comfort in Educational Buildings. Al-Iraqia Journal for Scientific Engineering Research, 2(3), 94–100. https://doi.org/10.58564/IJSER.2.3.2023.91
Bureau of Energy Efficiency. (2017). Energy Conservation Building Code (ECBC 2017). Government of India.
Carlucci, F. (2021). A Review of Smart and Responsive Building Technologies and Their Classifications. Future Cities and Environment, 7(1). https://doi.org/10.5334/fce.123
Climate Consultant. (n.d.). Climate Consultant Software.
Day, J. K., Futrell, B., Cox, R., Ruiz, S. N., Amirazar, A., Zarrabi, A. H., and Azarbayjani, M. (2019). Blinded by the Light: Occupant Perceptions and Visual Comfort Assessments of Three Dynamic Daylight Control Systems and Shading Strategies. Building and Environment, 154, 107–121. https://doi.org/10.1016/j.buildenv.2019.02.037
DesignBuilder. (n.d.). DesignBuilder Software.
Elghandour, A., Saleh, A., Aboeineen, O., and Elmokadem, A. (2016). Using Parametric Design to Optimize Building’s Façade Skin to Improve Indoor Daylighting Performance. In Proceedings of the BSO Conference 2016: Third Conference of IBPSA-England
Garcia, D., and Pereira, F. (2019). Daylight Glare Mitigation by Internal Shading Devices Use and Effects on Building Energy Performance. In WEENTECH Proceedings in Energy (164–184). https://doi.org/10.32438/WPE.3519
Helio Trace Façade System, New York, USA. (2013). Hoberman Associates and SOM Architects.
Hosseini, S. M., Mohammadi, M., and Guerra-Santin, O. (2019). Interactive Kinetic Façade: Improving Visual Comfort Based on Dynamic Daylight and Occupant Positions by 2D and 3D Shape Changes. Building and Environment, 165, Article 106396. https://doi.org/10.1016/j.buildenv.2019.106396
Hosseini, S. M., Mohammadi, M., Rosemann, A., Schröder, T., and Lichtenberg, J. (2019a). A Morphological Approach for Kinetic Façade Design Process to Improve Visual and Thermal Comfort: Review. Building and Environment, 153, 186–204. https://doi.org/10.1016/j.buildenv.2019.02.040
Hosseini, S. M., Mohammadi, M., Schröder, T., and Guerra-Santin, O. (2021). Bio-Inspired Interactive Kinetic Façade: Using Dynamic Transitory-Sensitive Area to Improve Multiple Occupants’ Visual Comfort. Frontiers of Architectural Research, 10(4), 821–837. https://doi.org/10.1016/j.foar.2021.07.004
Illuminating Engineering Society. (2012). IES Approved Method: Spatial Daylight Autonomy (sDA) and Annual Sunlight Exposure (ASE). IES.
IND_AP_Gannavaram–Vijayawada TMYx weather file. (n.d.). Climate.Onebuilding.Org.
India Meteorological Department. (2022). Climatological Tables of Observatories in India (1991–2020).
International Organization for Standardization. (2025). ISO/CIE 8995: Lighting of Indoor Work Places.
Media-ICT Building, Barcelona, Spain. (2014). Enric Ruiz-Geli Architects.
Mekhamar, A., and Hussein, A. (2021). Brief Overview of Climate Responsive Façades and its Kinetic Applications. Engineering Research Journal, 171, 16–34. https://doi.org/10.21608/erj.2021.193461
Razoki, F., and Al-Kazzaz, D. (2025). Biomimetic Strategies in Kinetic Architecture: A Comparative Analysis of Nature-Inspired Roof and Façade Designs. International Journal of Design and Nature and Ecodynamics, 20, 1269–1282. https://doi.org/10.18280/ijdne.200608
Reinhart, C. F., and Wienold, J. (2011). The Daylighting Dashboard: A Simulation-Based Design Analysis for Daylit Spaces. Building and Environment, 46(2), 386–396. https://doi.org/10.1016/j.buildenv.2010.08.001
Rhino. (n.d.). Rhinoceros 3D Software.
Rizi, R. A., and Eltaweel, A. (2021). A User-Detective Adaptive Façade Towards Improving Visual and Thermal Comfort. Journal of Building Engineering, 33, Article 101554. https://doi.org/10.1016/j.jobe.2020.101554
Simons Centre, Stony Brook University, New York, USA. (2008). Perkins Eastman Architects.
Tabadkani, A., Banihashemi, S., and Hosseini, M. R. (2018). Daylighting and Visual Comfort of Oriental Sun Responsive Skins: A Parametric Analysis. Building Simulation, 11(4), 663–676. https://doi.org/10.1007/s12273-018-0433-0
Tabadkani, A., Roetzel, A., Li, H. X., and Tsangrassoulis, A. (2021). Design Approaches and Typologies of Adaptive Façades: A Review. Automation in Construction, 121, Article 103450. https://doi.org/10.1016/j.autcon.2020.103450
Tabadkani, A., Valinejad, S. M., Soflaei, F., and Banihashemi, S. (2019). Integrated Parametric Design of Adaptive Façades for User’s Visual Comfort. Automation in Construction, 106, Article 102857. https://doi.org/10.1016/j.autcon.2019.102857
U.S. Energy Information Administration. (2021). Annual Energy Outlook 2021.
U.S. Green Building Council. (2015). USGBC Strategic Plan 2013–2015.
University of Southern Denmark, Kolding Campus, Denmark. (2010). Henning Larsen Architects.
Wagdy, A., and Fathy, F. (2015). A Parametric Approach for Achieving Optimum Daylighting Performance Through Solar Screens in Desert Climates. Journal of Building Engineering, 3, 155–170. https://doi.org/10.1016/j.jobe.2015.07.007
Wang,
J., Beltrán, L. O., and Kim, J. (2012). From Static to Kinetic: A Review of
Acclimated Kinetic Building Envelopes. In World Renewable Energy Forum 2012
Proceedings (Vol. 5).
Waseef, A., and Nashaat, B. (2017). Towards a New Classification for Responsive Kinetic Façades. In Proceedings of the International Conference MIC 2017.
Wienold, J., and Christoffersen, J. (2006). Evaluation Methods and Development of a New Glare Prediction Model for Daylight Environments with the Use of CCD Cameras. Energy and Buildings, 38(7), 743–757. https://doi.org/10.1016/j.enbuild.2006.03.017
 This work is licensed under a: Creative Commons Attribution 4.0 International License
© Granthaalayah 2014-2025. All Rights Reserved.