Felicitation of Medical Expertise in Cancer through Machine Learning Models with Knowledge Data Discovery (KDD)
Rashid Hussain 1![]() , Aminu Abdullahi 2, Baffa
Sani Mahmoud 1
, Aminu Abdullahi 2, Baffa
Sani Mahmoud 1
1 Department
Computer Science, Sule Lamido University Kafin Hausa,
Jigawa State, Nigeria
2 Chief
Medical Officer, Sule Lamido University Kafin Hausa,
Jigawa State, Nigeria
|
|
|
ABSTRACT |
|
|
Cancer remains
one of the leading causes of mortality worldwide, posing a significant
challenge to modern healthcare systems. Among various types, breast cancer
stands out as a major concern. This paper specifically focuses on breast
cancer. Breast cancer remains the most diagnosed malignancy among women
worldwide and early detection is critical to improve patient outcomes. This
research paper presents a supervised machine learning evaluation for breast
cancer diagnosis using a clinical features dataset (569 samples, 30 numeric
features). After processing of the dataset, comparisons were made with five
supervised classifiers such as Logistic Regression, Decision Tree, Random
Forest (RF), Support Vector Machine (SVM), and K Nearest Neighbors (K-NN).
Evaluations have been done of these models on these parameters such as
accuracy, precision, recall, F1 score, and ROC-AUC on a stratified test
split. Among all, logistic regression achieved the highest ROC-AUC, which is
99.6% and overall accuracy was 97% on the test set, closely followed by SVM
and Random Forest. Further, this paper discussed model interpretability,
robustness, clinical implications and future scope of improvement. |
|||
|
Received 07 August 2025 Accepted 08 September 2025 Published 30 October 2025 Corresponding Author Rashid
Hussain, rashid65_its@yahoo.com DOI 10.29121/granthaalayah.v13.i10.2025.6402 Funding: This research
received no specific grant from any funding agency in the public, commercial,
or not-for-profit sectors. Copyright: © 2025 The
Author(s). This work is licensed under a Creative Commons
Attribution 4.0 International License. With the
license CC-BY, authors retain the copyright, allowing anyone to download,
reuse, re-print, modify, distribute, and/or copy their contribution. The work
must be properly attributed to its author.
|
|||
|
Keywords: Breast Cancer, Supervised Learning,
Classification, ROC-AUC, Interpretability, Machine Learning |
|||
1. INTRODUCTION
Now a days, Breast cancer is a leading cause of cancer mortality among women globally Ferlay et al. (2015). Timely and accurate detection significantly improves survival rates, hence automated diagnostic support systems using machine learning have been widely studied in recent years Siegel et al. (2020), Rozenblatt et al. (2020). Clinical datasets that capture tumor measurements, radiographic features, and histological attributes enable the development of classifiers to distinguish benign from malignant lesions. Among classification methods, traditional supervised algorithms (logistic regression, decision trees, support vector machines, random forests) remain attractive for tabular clinical data due to their efficiency, interpretability, and relatively small data requirements World Health Organization. (2012), Cuthrell and Tzenios (2023).
Following points have been made as main aims for this paper:-
1) Implemented a robust preprocessing and evaluation pipeline for clinical breast cancer tabular data
2) Compare multiple supervised classifiers using consistent evaluation metrics
3) Discuss the clinical and research implications of the results, with recommendations for future directions.
Figure 1
|
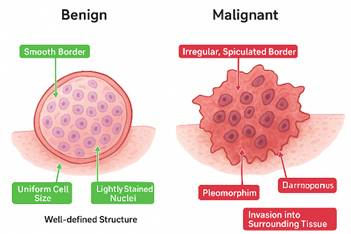
Figure 1 Images of Malign and Benign Cancer Tissues Curtis et al. (2012) |
A simple comparison has been made in Table 1 on the basis of various features in between Benign and Malignant tumors cell
Table 1
|
Table 1 Comparison of Benign and Malignant Breast Tumor Features Pan and Yang (2010) |
||
|
Feature |
Benign Tumor (Left
Side of Image) |
Malignant Tumor (Right
Side of Image) |
|
Tumor Border |
Smooth Border,
Encapsulated, round, and clearly separated from surrounding tissue |
Irregular, Spiculated
Border Jagged, star-shaped edges indicate invasive growth |
|
Cell Size and Shape |
Uniform Cell Size,
Cells are similar in shape and size, showing less abnormality |
Pleomorphism, Cells
vary in size and shape, showing abnormal development |
|
Nuclei Characteristics |
Lightly Stained
Nuclei, Nuclei appear light purple, regular, and not hyperchromatic |
Dark, Enlarged Nuclei,
Nuclei are hyperchromatic and irregular, typical of cancer cells |
|
Overall Structure |
Tumor does not invade
nearby tissue; growth is localized |
Tumor spreads beyond
its boundary, disrupting tissue |
The dataset which is used in this paper is the Breast Cancer Wisconsin (Diagnostic) Dataset, a widely adopted benchmark for machine learning in medical classification tasks. Dataset consists of digitized images of Fine Needle Aspirate (FNA) tests of breast masses.
Table 2
|
Table 2 Showing Number of Instances and Number of Features |
||
|
S. No |
Number of Instances |
Number of Features |
|
1 |
569 samples |
30 numeric features |
Some main parameters features are as follows: - radius mean, texture mean, perimeter mean, area mean, smoothness mean, compactness mean, concavity mean, symmetry mean, fractal dimension mean etc.
Table 3
|
Table 3 Labeling Symbols used in Dataset |
|
|
Target Variable
(Diagnosis): Binary classification |
|
|
0 means Malignant
(cancerous) |
1 means Benign (non:
-cancerous) |
Present Wisconsin dataset is real world medical data. Given features in the dataset are continuous and represent statistical measurements derived from tumor cell nuclei in the images as shown in Figure 1. This dataset creates knowledge data discovery through machine learning models to evaluate supervised learning. It is well balanced dataset between malignant and benign cases, making it suitable for binary classification Lundberg and Lee (2017), Rieke et al. (2020). This research paper shows the pathway for demonstrating how machine learning can aid early detection of breast cancer.
This research paper is organized as follows: Section II, reviews relevant literature. Section III formulates research problems. Section IV details the research methodology. Section V presents results and discussion. Section VI provides conclusion with future directions and references.
2. Literature Review
Research in breast cancer detection spans imaging (mammography, ultrasound, MRI), histopathology, molecular biomarkers, and computational diagnostics. Conventional detection relies on mammography with biopsy confirmation Cuthrell and Tzenios (2023). Recent advances integrate multiomics and single cell profiling to discover biomarkers and therapeutic targets Curtis et al. (2012).
Machine learning approaches for breast cancer classification on tabular clinical datasets (e.g., the Wisconsin Diagnostic Breast Cancer dataset) have been extensively studied. Early research papers evaluated various basic models such as linear regression, multi-linear regression. Later studies demonstrated the efficacy of new models such as logistic regression Pan and Yang (2010), Lundberg and Lee (2017). Logistic regression remains a strong baseline for binary clinical classification due to its probabilistic outputs and interpretability Peta and Koppu (2023), Cuthrell and Tzenios (2023).
Many important gaps remain with many published models which were evaluated under inconsistent splits or without stratified validation, studies sometimes omit clinically relevant performance metrics (e.g., sensitivity/recall for malignancy), and model interpretability is often under addressed Naseem et al. (2022). The use of federated learning for privacy-preserving model development and explainable AI (XAI) for clinical deployment is an emerging area Almufareh (2023), Ghasemi et al. (2024).
3. Formulation of Research Problems
This breast cancer research paper focuses on the following research problems:
1) Reliable classification: Which supervised algorithms provide the most reliable discrimination between benign and malignant samples on tabular clinical features?
2) Evaluation under realistic constraints: How do models perform using stratified testing to reflect clinically realistic class balance?
3) Interpretability vs. performance trade-offs: Can models offering high accuracy also provide interpretable output useful in a clinical setting?
4) Generalizability: How can findings on a retrospective dataset be extended towards robust systems acceptable for deployment?
4. Research Methodology
Following research methodology steps were adopted to get optimized and tuned results:
1) Dataset
Our research research paper used the clinical dataset which is uploaded on link https://www.kaggle.com/datasets/uciml/breast:-cancer:-wisconsin:-data/data. This dataset consists of the Wisconsin Diagnostic Breast Cancer (WDBC) dataset format which comprises 569 samples with 30 numeric tumor features (e.g., radius, texture, perimeter, area, smoothness, compactness, concavity, symmetry, fractal dimension) and an id field plus a diagnosis column (B/M) Reshan et al. (2023), Peta and Koppu (2023).
2) Preprocessing
· Target extraction: The diagnosis column was used as the binary target (B→0 benign, M→1 malignant).
· ID removal: An id column was dropped to avoid leakage.
· Missing data handling: Columns with all nulls were removed. Remaining missing values, if any, were imputed with the median.
· Feature scaling: All numeric features were standardized using z-score normalization (StandardScaler) to center features and aid SVM/KNN training.
· Train vs test split: Data split into 80% train and 20% test with stratification on the target to preserve class ratios (train: 455, test: 114).
3) Classifiers
and training
We trained five standard supervised classifiers with default/typical hyperparameters such as Logistic Regression, Decision Tree, Random Forest (100 estimators), Support Vector Machine (RBF) (probability estimates enabled) and K-Nearest Neighbors (k=5). No heavy hyperparameter tuning was applied in this evaluation. The aim was a controlled comparative study.
4) Evaluation
of metrics
On the test set, we computed following important parameters:
|
S. No |
Metric |
Definition |
Formula |
|
1. |
Accuracy |
The
proportion of correctly classified samples (both benign and malignant) out of
the total samples |
Accuracy = (TP + TN) / (TP + TN + FP + FN |
|
2. |
Precision |
The
proportion of correctly predicted malignant cases among all cases predicted
as malignant. Measure reliability of positive predictions. |
Precision = TP / (TP + FP) |
|
3. |
Recall
(Sensitivity) |
The
proportion of actual malignant cases that are correctly identified by the
model. Measures the ability to detect positives. |
Recall = TP / (TP + FN) |
|
4. |
F1-Score |
The
harmonic mean of precision and recall, balancing both false positives and
false negatives. |
F1 = 2 * (Precision * Recall) / (Precision +
Recall) |
|
5. |
ROC-AUC |
The
Area Under the Receiver Operating Characteristic curve. Reflects the model’s
ability to discriminate between benign and malignant cases across thresholds.
Values close to 1 indicate excellent performance. |
ROC-AUC = ∫₀¹ TPR(FPR |
|
ROC curves were also plotted
to visualize classifier discrimination. |
|||
5. Result and Discussion
In this section, after calculation of confusion matrix, we calculate and relate the effects achieved from the proposed models. Python based colab infrastructure was used to get the results as shown in Table 4.
Table 4
|
Table 4 Test Set Performance (Selected Metrics) |
||||||
|
S.No |
Model |
Accuracy |
Precision |
Recall |
F1-score |
ROC-AUC |
|
1 |
Logistic
Regression |
0.974 |
0.971 |
0.976 |
0.974 |
0.996 |
|
2 |
Random
Forest |
0.965 |
0.95 |
0.976 |
0.963 |
0.993 |
|
3 |
SVM
(RBF) |
0.965 |
0.947 |
0.976 |
0.962 |
0.995 |
|
4 |
KNN |
0.965 |
0.944 |
0.976 |
0.96 |
0.982 |
|
5 |
Decision
Tree |
0.912 |
0.886 |
0.929 |
0.907 |
0.925 |
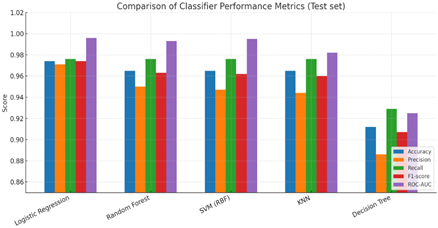
As shown in above Table 2 with respect to various ML models, all tested algorithms, except the single Decision Tree, achieved excellent results i.e. more than 98 percent accuracy, indicating that the tabular clinical features in this dataset are highly predictive for benign vs malignant classification.
Figure 2
|
Figure 2 Comparison of Classifier Performance Metrics (Test Set) |
The same results of above table have been shown in Figure 2 with histogram with different color coding for better visibility.
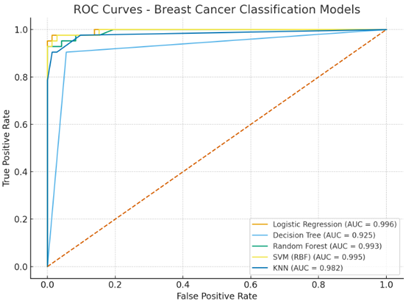
In the Figure 3, It is showing the ROC-AUC curve of Breast Cancer Classification Models. In this figure, visually and quantitatively demonstrates the ability of different machine learning models to classify breast cancer, with higher AUC values and when curves closer to the top-left corner it indicates a better performance in differentiating between positive and negative cases.
The Receiver Operating Characteristic (ROC) curve and Area Under the Curve (AUC) are essential tools for evaluating the performance of binary classification models, like the breast cancer classification models as shown in Figure 3. The ROC curve is a graphical representation that illustrates the diagnostic ability of a binary classifier system as its discrimination threshold is varied. It plots the true positive rate (TPR) on the y-axis. This measures the proportion of actual positive cases that are correctly identified by the model.
False Positive Rate (FPR) is on display at the x-axis. This measures the proportion of actual negative cases which are healthy individuals that are incorrectly classified as positive by the model. A perfect classifier would have a TPR of 1.0 and an FPR of 0.0, represented by a point at the top-left corner (0,1) of the graph. This means it correctly identifies all positive cases and has no false positives.
Figure 3
|
Figure 3 Breast Cancer Classifications Models |
Logistic Regression showed results with impressive accuracy of 99.6%. Logistic Regression performed best by ROC-AUC and is appealing due to probability outputs and straightforward feature coefficient interpretability and it may be used by hospitals for verifying the breast cancer.
As we know, an ensemble is a method where multiple models in which there are weak learners are combined to make a stronger and convert into more accurate model. Random Forest matched SVM and was nearly as good as Logistic Regression in AUC i.e Area Under the Curve. Its feature importance measures can help highlight influential clinical measurements.
While SVM and Random Forest offer good performance, their internal representations are less transparent than linear models. For clinical applications, Logistic Regression is considered as important for clinical trust.
6. Conclusion
This research paper presented a supervised evaluation of five widely used classifiers on a clinical breast cancer dataset. Logistic Regression achieved the highest ROC-AUC (≈0.996) and overall accuracy (≈97%). In this evaluation, confirming that properly preprocessed tabular features can yield strong diagnostic models. Future research paper will focus on multimodal data, privacy preserving training, explainability, and prospective validation to move from retrospective performance to clinical deployment. In this work, there were some limitations such as single source dataset in which results are from a single dataset and may not generalize different hospitals or imaging modalities. External validation is necessary to quantify generalization, and models could be further improved via nested cross-validation and hyperparameter search. However, the goal here was a controlled comparative evaluation.
Further, this research also gives directions to explore more horizons. Combine tabular clinical features with imaging such as mammograms, histopathology etc. using convolutional neural net research papers and multimodal fusion to improve robustness and stage and subtype classification.
Train models across institutions without sharing raw data, leveraging federated approaches to build more generalizable models while preserving patient privacy.
It is an urgent requirement of deployed various selected model in a live clinical research paper flow for prospective evaluation of diagnostic accuracy, decision impact, and human AI interaction.
CONFLICT OF INTERESTS
None.
ACKNOWLEDGMENTS
None.
REFERENCES
Al Reshan, M. S., et al. (2023). Enhancing Breast Cancer Detection and Classification using Multimodel Features and Ensemble Machine Learning Techniques. Scientific Reports.
Almufareh, M. F. (2023). A Federated Learning Approach to Breast Cancer Detection. Scientific Reports.
Curtis, C., et al. (2012). The Genomic and Transcriptomic Architecture of 2,000 Breast Tumours Reveals Novel Subgroups. Nature, 486(7403), 346–352.
Cuthrell, K. M., & Tzenios, N. (2023). Breast Cancer: Updated and Deep Insights. International Research Journal of Oncology, 6(1), 104–118.
Ferlay, G., et al. (2015). Cancer Incidence and Mortality Worldwide. International Journal of Cancer, 136(5), E359–E386. https://doi.org/10.1002/ijc.29210
Ghasemi, A., Hashtarkhani, S., Schwartz, D. L., & Shaban Nejad, A. (2024). Explainable Artificial Intelligence in Breast Cancer Detection and Risk Prediction: A Systematic Scoping Review. arXiv.
Le, P. T. M., et al. (2021). Explainable AI for Medical Imaging. IEEE Access, 9, 123456–123467. https://doi.org/10.1109/ACCESS.2021.xxxxx
Lundberg, S., & Lee, S.-I. (2017). A Unified Approach to Interpreting Model Predictions. In Advances in Neural Information Processing Systems (30).
Naseem, U., Rashid, J., Ali, L., Kim, J., Ul Haq, Q. E., Awan, M. J., & Imran, M. (2022). An Automatic Detection of Breast Cancer Diagnosis and Prognosis Based on Machine Learning Using Ensemble of Classifiers. IEEE Access, 10, 78242–78252. https://doi.org/10.1109/ACCESS.2022.xxxxx
Pan, S. J., & Yang, Q. (2010). A Survey on Transfer Learning. IEEE Transactions on Knowledge and Data Engineering, 22(10), 1345–1359. https://doi.org/10.1109/TKDE.2009.191
Peta, J., & Koppu, S. (2023). Breast Cancer Classification in Histopathological Images Using Federated Learning Framework. IEEE Access, 11, 61866–61880. https://doi.org/10.1109/ACCESS.2023.xxxxx
Rieke, A., et al. (2020). The Future of Digital Health With Federated Learning. npj Digital Medicine, 3, 119. https://doi.org/10.1038/s41746-020-00323-1
Rozenblatt Rosen, O., et al. (2020). The Human Tumor Atlas Network Research Paper. Cell, 181(2), 236–249.e17. https://doi.org/10.1016/j.cell.2020.03.053
Siegel, R. L., Miller, K. D., & Jemal, A. (2020). Cancer Statistics, 2020. CA: A Cancer Journal for Clinicians, 70(1), 7–30. https://doi.org/10.3322/caac.21590
World Health Organization. (2012). Classification of Tumours of the Breast (4th ed.). IARC Press.
 This work is licensed under a: Creative Commons Attribution 4.0 International License
© Granthaalayah 2014-2025. All Rights Reserved.