NAVIGATING FORENSIC ACCOUNTING BEHAVIORAL INTENTIONS THROUGH THE FRAUD DEVIATION MODEL
Dr. Seema Devi 1![]()
![]()
1 Assistant
Professor, Department of Commerce, C.D.R.J.M, Butana, Sonipat, Haryana, India
|
|
|
ABSTRACT |
|
|
Fraud remains
widespread in modern business. People who commit fraud often display warning
signs through their behavior and actions, which can escalate to aggressive
and violent conduct. Researchers have developed various theories to detect
and prevent fraudulent behavior, with each theory having specific strengths
and limitations depending on the situation. To better understand fraudulent
conduct, researchers combined existing fraud theories with behavioral models
from other fields to create the Fraud Deviation Model (FDM). This model was
validated using Structural Equation Modeling (SEM). The research included
primary data collected from 560 participants in India's National Capital
Region, comprising registered internal auditors, external auditors, government
auditors, and forensic auditors. |
|||
|
Received 10 June 2025 Accepted 15 July 2025 Published 12 August 2025 Corresponding Author Dr Seema
Devi, sdphougat@gmail.com DOI 10.29121/granthaalayah.v13.i7.2025.6290 Funding: This research
received no specific grant from any funding agency in the public, commercial,
or not-for-profit sectors. Copyright: © 2025 The
Author(s). This work is licensed under a Creative Commons
Attribution 4.0 International License. With the
license CC-BY, authors retain the copyright, allowing anyone to download,
reuse, re-print, modify, distribute, and/or copy their contribution. The work
must be properly attributed to its author.
|
|||
|
Keywords: Fraud, Fraudulent Behavior, Fraud
Deviation Model (FDM), Structural Equation Modeling (SEM) |
|||
1. INTRODUCTION
The Indians are considered diligent or hardworking all over the world. Although, the person with power called The Babu, controls the whole system. They spread the venom and slow down the progress. Taxes are the primary source of revenue for the government. However, as frauds increase with high tide, the taxpayers feel victimized. They want to support nations' progress and enlargement, not a fraudster. Fraud can be explained as the act of misleading someone or earning money illegally. It has dire ramifications for individuals, organizations, and the economy. Fraud is a savvy disease that arises from selfishness or deceit Silverstone et al. (2012). A report to the nations on a global survey of occupational fraud and abuse (2020), a survey based on 2504 cases in 125 countries, reported fraud causes more than $3.6 billion in yearly losses. The average loss per case is $1,509,000. The global economy is slowly being drained by these vast losses every year. Organizations often have difficulty assessing the extent of the fraud because frauds are not reported and investigated. Victims may not always be eligible for civil or criminal damages. In 68% of cases, there is no value recovery, directly impacting companies' ability to create new jobs KPMG (2009). Forensic accounting gained attention in the act of rapid development in fraud, auditors' shortcomings, lack of experience, and law enforcement agencies inability to discover crimes in time. In general, forensic accounting is mainly used in the legal system Durkin and Harry (1997), Bressler (n.d.). Honigsberg (2020) called it a crime scene investigation. A forensicc accountant has knowledge and skills in auditing and legal issues, so estimating the loss and presence in the court is not difficult. Fraud is unpredictable; thus, the forensic accountant can be called without prior notice. They are responsible for preventing fraud from occurring. Forensic accounting is a vast field that professional chartered accountants have found extremely useful. A forensic accountant's responsibilities extend even beyond the level of the organization. The big, chartered accounting firms with forensic accountants can offer their services in various areas, including consultation, legal servicing, a mediator approved via tribunals, expert presentation, along with any other court-related services.
Research by ASSOCHAM and Grant Thornton indicates India's highest susceptible fraud sectors as Real Estate & Infrastructure (52%), Financial Services (34%), Telecom (5%), Manufacturing (3%), Electronics & IT (2%), Hospitality & Tourism (2%) and other (2%). Some theories like fraud triangle, fraud diamond, fraud pentagon, fraud scale and Hollinger-Clark theory has been developed to understand the behavior of fraudster and the reasons for this alarming increase in fraud. The present study uses the following behavioral theories and models that help in developing Fraud Deviation Model.
Rogers (1975) created the Protection Motivation Theory (PMT), which studies coping mechanisms and fear reactions. PMT is similar to health practices when it comes to fraud prevention. In primary and secondary prevention, it includes threat and coping assessments. Rollo et al. (2017), Chamroonsawasdi et al. (2017), and Liñán et al. (2005) are notable examples of uses. Rosenstock (1974) created the Health Belief Model (HBM), which evaluates perceived benefits, barriers, severity, and susceptibility in order to predict health-related behaviors. HBM applies to accounting procedures Muthusamy et al. (2010) and fraud prevention Janz and Becker (1984), Harrison et al. (1992), with modifications to incorporate media impact Rosenstock et al. (1994). Ajzen and Fishbein (1980) created the Theory of Reasoned Action and Planned Behavior (TR&PA), which uses attitudes and subjective standards to forecast behavior. It has been used in the selection of foods Raats et al. (1995) and the drinking of beer without alcohol Thompson and Thompson (1996). Extending TRA, the Theory of Planned Behavior Thompson and Thompson (1996) covers behavioral control Fishbein and Ajzen (1977) and influences organizational decision-making Muthusamy et al. (2010). Lavidge and Steiner (1961) established the Hierarchy of Effects model (HOE), which describes a step-by-step progression from ignorance to supporting business operations, including knowledge, attitude formation, and behavior. Similarly, seven steps were recognized by Barry and Howard (1990). Murray and Vogel (1997) placed a strong emphasis on knowledge and awareness when applied to business appraisal. The model was modified for fraud detection by Muthusamy et al. (2010), who also emphasized the importance of demographic factors in increasing public knowledge of forensic accounting procedures.
1.1. THE PROPOSED RESEARCH MODEL: FRAUD DEVIATION MODEL (FDM)
Bsed on the above theories and model a model is proposed called Fraud Deviation Model as there are many similarities are found between the theories of PMT, TR&PA, HBM, and HOE. All of the concepts are predicated on the idea that strong expectations generate strong motivation since social cognition is built on achievement. The next component of these models is beliefs that are grounded on a strong conceptual foundation. Last but not the least, all theories are extensively used in behavior anticipation and precautionary measures Muthusamy et al. (2010), Noar and Rick (2005). Although these frameworks have some similarities, even then they each have their strengths and weaknesses. For example, threat perception belief is an essential component of the preventive behavior of threats which is not present in TR&PA or HOE. Secondly, PMT discovered a motivation factor that isn't included in other theories. The cognitive stage of HOE, which includes awareness and knowledge, is absent in HBM or TR&PA. However, awareness is crucial for creating desire. Muthusamy et al. (2010) combined the HOE with the TRA to analyze organizational tendency for usage of investigating audit services to detect or prevent scams from being committed by large Malaysian corporations. This investigation is business enterprises centered and provided novel insight into organizational decision-making. The current research focuses on services provided by auditors because fraud is universal. Other studies Rosenberg et al. (2008) also support the HOE model. These findings support that behavioral change can be facilitated by increased awareness. This study relies on the protection motivation theory, hierarchy of effect models, theory of reasoned and planned action, and theory of health belief models to support the final model.
1.2. HYPOTHESIS FOR THE PROPOSED RESEARCH MODEL
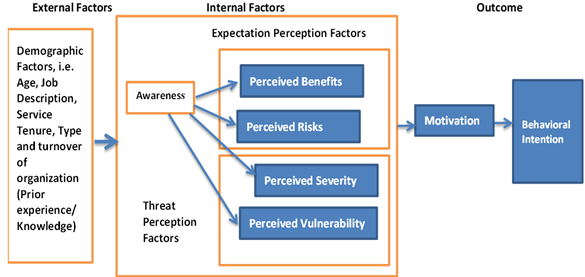
The study approach is built on four factors: external factor, internal factor, motivational factor, and behavioral intention as the outcome. With the exception of gender, the study postulates that internal elements like awareness are influenced by demographic factors such as age, job description, tenure, type, nature, and turnover of auditing companies. While awareness is unrelated to gender, it is influenced by age, job role, service tenure, and organization type; forensic auditors and professionals with longer tenure are predicted to have higher awareness.
Based on the study model, six hypotheses are created.
Hypothesis 1: Awareness of forensic accounting has a negative impact on the perceived benefits of using it against fraud.
Hypothesis 2: Awareness of forensic accounting has a negative impact on the perceived risks of using it against fraud.
Figure 1
|
Figure 1 Proposed
Model for the Study Source
Researchers’ Own Proposed Model |
In order to analyze hypotheses 1 and 2, it is required to assess advantages with dangers of utilizing investigative audit. It leads to development and implementation of an approach with consequent behavioral control. According to empirical studies, attitudes are influenced by both perceived risks and benefits. The studies on perceived benefits - Martins (2014), Quaddus and Hofmeyer (2005), Murphy et al. (2005) support the statement. Literature also contains studies of the negative effects on attitude Heijden et al. (2003), Lu et al. (2005), Gewald et al. (2006). The perceived benefits and risks in this study are evaluated using the composite models and theories like planned action and the health belief model Poss (2001), Ham (2017). They are made to directly impact behavior toward forensic accounting as an extraction to behavioral intention since both perceived benefits and risks are significant.
Hypothesis 3: Awareness of forensic accounting has a negative impact on the perceived susceptibility/vulnerability of using it against fraud
Hypothesis 4: Awareness of forensic accounting has a negative impact on the perceived severity of using it against fraud.
The influence of threat perception factors like vulnerability/susceptibility and severity on motivation to use forensic accounting can draw from protective motivation theory, where motivation is a mediating variable. KPMG fraud survey (2005) has consistently found even though organizations perceive that fraud can have severe consequences, there is an illusion of safety within their organization. Only when an organization realizes the severity of fraud and is, therefore, more susceptible to fraud will it take steps to reduce that risk.
Hypothesis 5: Perception of forensic accounting has a negative impact on the motivation to use it against fraud
Sub-Hypothesis 5.1: Perceived Benefits of forensic accounting has a negative impact on the motivation to use it against fraud
Sub-Hypothesis 5.2: Perceived Risks of forensic accounting have a negative impact on the motivation to use it against fraud
Sub-Hypothesis 5.3: Perceived vulnerability/Susceptibility of forensic accounting has a negative impact on the motivation to use it against fraud
Sub-Hypothesis 5.4: Perceived Severity of forensic accounting has a negative impact on the motivation of using it against fraud
Hypothesis 6: Motivation for forensic accounting negatively impacts behavioral intention to use it against fraud.
Abraham and Sheeran (2005) found a certain expectation and risk assessment play crucial part for inspiration. This cognitive trait allows individuals to choose to act to avoid adverse conditions. The organization can determine whether fraud costs are high or low by assessing the perceived severity. However, the perception of susceptibility allows them to recognize their vulnerability and those who may be prone to fraud Muthusamy et al. (2010). One of the ways an organization can combat the threat of fraud is to be able to use forensic accounting methods. Literature has demonstrated the impact of perceived fraud susceptibility Poss (2001), Roden (2004), Doukas et al. (2004), Muthusamy et al. (2010). Literature also supports the impact of behavioral intention and perceived fraud severity Roden (2004), Doukas et al. (2004), Lajunen and Räsänen (2004). By employing motivation as a mediating variable, the current study contends that threat perception strongly predicts an organization's readiness to adopt forensic accounting.
Fraud is a meticulously planned, long-term strategy rather than an instantaneous action. As a result, this study may make use TR&PA. Knowing that fraudsters are more likely to commit fraud than the organization, one can predict the fraudster's intent by analyzing others' influence. The health belief model hypothesis is useful for this research since it can be applied to combat fraud. It is due to perceptions and knowledge's importance in individual responsibility. The theory of the effects model, which is a logical progression that allows an individual to move from being unaware of forensic accounting to wanting to use it in a business environment to fight fraud, is also fundamental. The theory of protection motivation helps in the identification of motivational factors to apply forensic accounting. These theories were modified to create the research model.
2. REVIEW OF LITERATURE
The literature review provides a comprehensive overview of forensic accounting, highlighting its significance, methods, and impact on fraud detection and prevention. Dutta (2018) discussed forensic accounting's role in legal proceedings and the need for specialized skills to address financial fraud. Kumar et al. (2018) advocate the effectiveness of the Benish M-Square Model and stress the importance of transparency in financial statements. The increasing prevalence of financial frauds in India and propose measures, including establishing a forensic accounting cell Lama and Chaudhuri (2018). Lee and Nuxoll (2018) use a case study to illustrate the gap between employer expectations and student performance in forensic accounting, emphasizing the importance of critical thinking skills. Mui (2018) explores auditors' communication skills and knowledge in fraud detection, suggesting continuous learning and certification to enhance capabilities. Patel (2018) expands the fraud triangle to include capability and highlights the need for a proactive approach to prevent white-collar crime. Rathnasiri and Bandara (2018) survey accounting professionals, revealing the importance of multidisciplinary skills for forensic accountants. Waghray (2018) addresses the challenges posed by technological advancements in fraud and emphasizes legislative changes for effective forensic accounting in India. Alshurafat (2019) focuses on using pedagogical books to improve students' writing skills and ethics understanding in accounting. Hossain et al. (2020) underscore the responsibility of auditors and accountants in fraud detection, emphasizing the necessity of forensic accounting education. Ozili (2020) discusses accounting decisions' impact on forensic investigation, providing a theoretical framework for fraud detection and prevention. Rehman and Hashim (2020) link investigative audits to corporate governance sustainability, highlighting the paradigm shift in accounting. Shah (2020) introduces forensic accounting as a response to the uncertainties and complexities of financial statements, calling for regulatory recognition in India. Alhassan (2021) explores the relationship between forensic accounting and fraud detection in Nigeria, suggesting improved internal control systems and training for forensic accountants. Alshurafat et al. (2021) assess the obstacles to forensic accounting's growth in India, emphasizing its impact on the country's socio-economic development. Mbasiti et al. (2021) propose forensic accounting methods to prevent revenue leakage in Nigerian universities, highlighting the relevance of investigative audits. Yu and Rha (2021) evaluate the effectiveness of forensic accounting methods like network text analysis and trend analysis in identifying fraudulent activities. Alfordy (2022) examines fraud deterrence techniques recognized by auditors, emphasizing the need for effective regulatory structures in Saudi Arabia. Cheliatsidou et al. (2022) criticize the fraud triangle for its omission of fraud's nature and propose a theoretical model for global application. Chhabra and Prabhakaran (2022) address institutional-driven cyber fraud in Indian banks, recommending efficient response systems and countermeasures. Kaur et al. (2022) conduct a systematic literature review on forensic accounting methods, emphasizing the correlation between fraud detection and prevention strategies. Navarrete and Gallego (2022) discuss forensic accounting techniques like Benford's rules and fraudulent numerical patterns for preventing financial statement fraud. Owusu et al. (2022) applies the fraud triangle hypothesis to evaluate the determinants of fraud in state-owned businesses, emphasizing the role of pressure, opportunity, and reasoning. Rashid et al. (2023) assess auditors' perspectives on financial statements, revealing internal control issues and the need for improved regulations. Zainal et al. (2022) investigate fraud causes in small and medium-sized businesses, emphasizing the correlation between employee motivation, internal surveillance, and corruption. Konar and Aiyar (n.d.) provide a descriptive study on forensic accounting's global impact, calling for a multi-faceted approach to reduce white-collar crime. The literature collectively underscores the importance of forensic accounting in fraud detection and prevention, advocating for regulatory recognition, education, and multidisciplinary skills in the field.
3. RESEARCH METHODOLOGY
To know the impact of auditors’ awareness and perception on behavioral intention to use forensic accounting, the data has been collected on Five-point Likert Scale from 560 internal auditors, external auditors, govt. auditors and forensic auditors registered in National Capital Region, India where 1 - Strongly Disagree and 5- Strongly Agree. The total 90796 registered firms were categories based on number of firms below 500, 500-1000, 1000-1500, and 1500 above. On the basis of number of registered firms in random selection Rohtak, Gautam Budh Nagar, New Delhi, and South Delhi has been selected as a sample. The data was collected from online and offline questionnaire. To know impact of independent variables awareness and perception, on the dependent variable behavioral intention, Structural Equation Modeling is used. Here, motivation is taken as mediating variable.
4. ANALYSIS AND INTERPRETATION
4.1. FACTOR ANALYSIS
Factor analysis is a technique of data reduction; it combines many variables in one factor that is highly correlated within them and less correlated with other factors. This technique helps to convert a large set of uncontrollable variables into few manageable factors which help in decision-making. The variables having low communality i.e. less than 0.5 are deleted. The contributing components are identified using the extraction method PCA. The varimax rotation method is used for factor rotation because it uses a method based on science to maximize the low- or high-value factor loading and decrease the mid-value factor loading.
Table 1
|
Table 1 Summary of Factor Analysis Tables for Independent and Dependent Variables |
||||||
|
Statements/ Variables |
Factor Loadings |
Factor Order |
Labeling of Factor |
Total Variance Explained (%) |
Cronbach’s Alpha |
|
|
Awareness and perception |
||||||
|
PB1 |
Increase Auditor's
Responsibilities (S14) |
.831 |
Factor 1 |
Perceived Benefits (PB) |
18.219 |
.937 |
|
PB2 |
Forensic accounting is an
Anti-fraud pro-active strategy (S15) |
.811 |
||||
|
PB3 |
Win professional
reputation (S22) |
.805 |
||||
|
PB4 |
Attends court as an
expert witness (S23) |
.802 |
||||
|
PS1 |
Frauds are increasing at
an alarming rate (S11) |
.818 |
Factor 2 |
Perceived Severity (PS) |
16.691 |
.768 |
|
PS2 |
Larger the organization,
the more possibility of fraud (S13) |
.795 |
||||
|
PS3 |
Every part of the
organization is infected with fraud (S3) |
.765 |
|
|||
|
PS4 |
Forensic accounting
skilled auditors demand is increasing nowadays (S18) |
.725 |
||||
|
PV1 |
Investments are
decreasing due to the risk of fraud (S8) |
.847 |
Factor 3 |
Perceived Susceptibility/
Vulnerability (PV) |
12.825 |
.728 |
|
PV2 |
Financial fraud is very
common in organization (S6) |
.809 |
|
|||
|
PV3 |
My auditing organization
has been a victim of fraud (S5) |
.798 |
||||
|
PV4 |
Every organization is
susceptible to fraud (S7) |
.769 |
||||
|
A1 |
Forensic accounting is
more useful than financial accounting (S12) |
.794 |
Factor 4 |
Awareness (A) |
12.629 |
.827 |
|
A2 |
Forensic accounting is
related to fraud prevention and detection (S1) |
.793 |
||||
|
A3 |
The importance of
forensic accounting techniques has increased in the past few years (S2) |
.792 |
||||
|
PR1 |
Awareness of forensic
accounting will increase the cost of the audit (S16) |
.760 |
Factor 5 |
Perceived Risk (PR) |
8.082 |
.794 |
|
PR2 |
It will invite
competition among audit firms, legal firms, and specialized forensic audit
firms (S17) |
.773 |
||||
|
PR3 |
Forensic accounting
cannot help in stolen resources (S19) |
.711 |
||||
|
M1 |
We use forensic
accounting to reduce fraudulent activities (S4) |
.813 |
|
|
|
|
|
M2 |
Forensic accounting can
bridge the expectation gap between auditors and investors (S21) |
.770 |
Factor 6 |
Motivation (M) |
5.691 |
.883 |
|
Behavioral Intention |
||||||
|
Easily Identify red flags
(Fraud Signals) |
.840 |
Factor 1 |
Behavioral Intention to
use forensic accounting (BI) |
65.067 |
.811 |
|
|
Proper implementation of
forensic accounting techniques |
.810 |
|||||
|
Identify best-suited
fraud detection and prevention techniques for auditing organization |
.7890 |
|||||
|
BI1 |
Helpful for the proper
implementation of lawful activities |
.771 |
||||
|
Increase investigative
skills |
.700 |
|||||
|
Reduce fictitious
transactions |
.735 |
Factor 2 |
||||
|
Risk calculation will
help in locating fraud |
.782 |
|
||||
|
Auditors will take a
different approach in verifying books of accounts |
.720 |
|||||
|
BI2 |
Strengthen the
credibility of financial reporting |
.810 |
||||
|
Knowledge of forensic
accounting strengthens fraud control in the business |
.857 |
Factor 3 |
||||
|
BI3 |
A proper review of
management policies |
.729 |
||||
|
Segregation of accounting
function |
.753 |
|||||
|
Provide assistance in
cross-examination |
.818 |
Factor 4 |
||||
|
BI4 |
Forensic accounting would
go a long way in the fight against fraud |
.888 |
||||
|
Source Researcher’s Own Created
Through Various Factor Analysis Tables |
||||||
5. CONFIRMATORY FACTOR ANALYSIS
The main objective of CFA is to verify whether data fit the hypothesized measurement model. It is established on specific theories. This method allows us to determine if the observed variables represent a smaller set of constructs.
·
Evaluation of the Overall Measurement Model
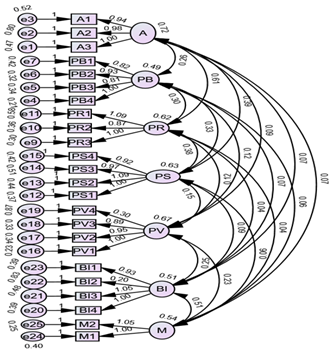
Items can only weight on one construct (i.e., there is no cross-loading), latent constructs may correlate, and all factor loadings for this developed measurement model are exempt (i.e., estimated). The model's seven structures are depicted in the Figure. The constructs are awareness of forensic accounting (A), perceived benefits (PB), perceived risks (PR), perceived severity of fraud (PS), perceived susceptibility/vulnerability (PV), and behavioral intention to use forensic accounting (BI). Variables A1, A2, and A3 are linked to the construct A. The term PB is linked to four different variables: PB1, PB2, PB3, and PB4.
Besides, four variables (PS1, PS2, PS3, and PS4) show the construct PS, while four (PV1, PV2, PV3, and PV4) are moderately connected with the construct PV. Three variables (PR1, PR2, and PR3) are related to the construct PR. The construct BI is finally described by the four variables BI1, BI2, BI3, and BI4. Additionally, each measurement variable includes a corresponding error term, abbreviated ‘er.’
Figure 2
|
Figure 2 Overall
Measurement Model Source Researchers’
Development Through SPSS AMOS 28 |
The unstandardized regression weights corresponding to the observed and unobserved variables are displayed in the Figure. It also displays the co-variances and variances. The figure shows, for example, that the associated unstandardized regression weight of A1 on A is β= 0.94 and A2 on A is β = 0.98, and so on
The above path model needs to be tested, whether it is fit or not. For this purpose, some parameters are measured. The likelihood ratio chi-square (χ2) statistic, most critical measure for overall fit, is only statistically based measure of goodness of fit in structural equation modeling Jöreskog and Sörbom (1993). Chi-square test is usually used to reject null hypotheses and support the alternative, i.e., there is a significant difference between observed and expected. Hence, the enormous value of Chi-square is considered good.
According to Ho (2006), when structural equation modeling is applied, the researcher should be looking for significant differences in the actual and predicted matrices. The researcher is not trying to reject null hypotheses in this instance. Therefore, the model's fit will be better if chi-square value is smaller than actual matrices. The chi-square will increase as the sample size increases because it is sensitive to variations from multivariate normality in observed variables. So, Chi-Square should be used in conjunction with other goodness-of-fit metrics.
CMIN/DF (Chi-Square Fit Statistics/Degree of Freedom), GFI (Goodness-of-Fit Index); AGI (Adjusted Goodness of Fit); RMR (Root Mean Square Residue); NFI (Normed Fit Index; CFI (Comparative Fit Index); PNFI (Parsimonious Normed Fit Index); and RMSEA (Root Mean Square Error of Approximation. McDonalds and Ho (2002) discovered that the most frequently reported fit indices are CFI, GFI, and NFI (TLI). Hu and Bentler (1999) recently developed the Threshold level. They suggested a two-index presentation format. It includes SRMR, NNFI (TLI), RMSEA, or CFI. Kline (2005) strongly advocates for Chi-Square test, RMSEA, CFI, and RMR. Boomsma (2000) offers similar recommendations but advises that the multiple squared correlations of each equation be reported.
Table 2
|
Table 2 Cutoff criteria for Fitness of the Model |
||||
|
Measures |
Terrible |
Acceptable |
Excellent |
Authors’ Reference |
|
CMIN/DF |
>5 |
>3 |
>1 |
Hu and Bentler (1999) |
|
GFI |
<.90 |
≥.90 |
≥.95 |
Shevlin and Miles (1998) |
|
AGFI |
<.90 |
≥.90 |
≥.95 |
Tabachnick and Fidell (2007) |
|
RMR |
>.08 |
<.08 |
<.05 |
Hu and Bentler (1999) |
|
NFI |
<.90 |
≥.90 |
≥.95 |
Hu and Bentler (1999) |
|
NNFI(TLI) |
<.90 |
≥.90 |
≥.95 |
Hu and Bentler (1999) |
|
CFI |
<.90 |
≥.90 |
≥.95 |
Hu and Bentler (1999) |
|
PNFI |
<.50 |
≥.50 |
≥.90 |
Mulaik et al. (1989) |
|
RMSEA |
>.08 |
>.05 |
<.05 |
Hu and Bentler (1999) |
|
Source Researchers Collected
Values from Various Sources |
||||
There are no universal rules to assess model fit. Therefore, it’s essential to report diversity of indices because contrasting indications can emulate distinctive conditions of model fit Crowley and Fan (1997).
Table 3
|
Table 3 Comparison of Threshold Values with the Default Model |
|||
|
Measures |
Threshold Level |
Default Model |
Remark |
|
CMIN/DF |
>3 |
3.503 |
Accepted |
|
GFI |
≥.90 |
.902 |
Accepted |
|
AGFI |
≥.90 |
.873 |
Rejected |
|
RMR |
<.08 |
.090 |
Rejected |
|
NFI |
≥.90 |
.884 |
Rejected |
|
NNFI(TLI) |
≥.90 |
.897 |
Rejected |
|
CFI |
≥.90 |
.914 |
Accepted |
|
PNFI |
≥.50 |
.740 |
Accepted |
|
RMSEA |
>.05 |
.065 |
Accepted |
|
Source Researchers Calculation
Through SPSS AMOS 28 |
|||
From the above table, it is clear that the model fits 5 criteria and is rejected in 4. The acceptance rate is more than 50%, but some modifications also allowed for fitting the model and completing most criteria. So, the researcher accepts the modifications. The following table shows the modifications allowed in the path model.
·
Modification Indices
Following table indicates the modification allowed in the measurement model.
Table 4
|
Table 4 Modification Indices |
||||
|
|
|
|
M.I. |
Par Change |
|
e22 |
<--> |
PS |
19.053 |
.110 |
|
e22 |
<--> |
PB |
29.223 |
.128 |
|
e19 |
<--> |
PV |
17.166 |
-0.128 |
|
e19 |
<--> |
PS |
30.428 |
.143 |
|
e19 |
<--> |
PR |
13.512 |
.078 |
|
e19 |
<--> |
PB |
34.997 |
.143 |
|
e19 |
<--> |
e22 |
45.892 |
.236 |
|
e13 |
<--> |
PR |
12.238 |
.059 |
|
e13 |
<--> |
e19 |
13.331 |
.105 |
|
e11 |
<--> |
A |
18.92 |
.092 |
|
e10 |
<--> |
e22 |
10.178 |
.077 |
|
e6 |
<--> |
e19 |
15.314 |
.093 |
|
e3 |
<--> |
e10 |
10.787 |
-0.069 |
|
e3 |
<--> |
e6 |
15.693 |
-0.080 |
|
e2 |
<--> |
e11 |
23.801 |
.157 |
|
Source Researchers' Calculation
Through SPSS AMOS 28 |
||||
·
Model fit after Modifications
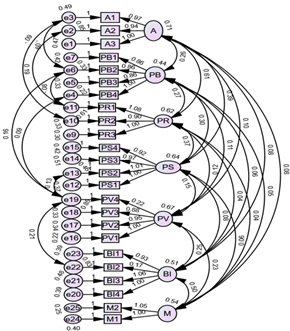
After doing the above modification, the researcher develops the following Overall Path Model.
Figure 3
|
Figure 3 Revise
the Overall Measurement Model After Modification Indices Source
Researchers' Development Through SPSS AMOS 28 |
The default model is compared with threshold levels to check whether the model is fit or not.
Table 5
|
Table 5 Comparison of Threshold Level with Default Model |
|||
|
Measures |
Threshold Level |
Default Model |
Remark |
|
CMIN/DF |
>3 |
2.819 |
Accepted and improved
from earlier |
|
GFI |
≥.90 |
.925 |
Accepted and improved
from earlier |
|
AGFI |
≥.90 |
.900 |
Accepted and improved
from earlier |
|
RMR |
≤.08 |
.088 |
Accepted and improved
from earlier |
|
NFI |
≥.90 |
.910 |
Accepted and improved
from earlier |
|
NNFI(TLI) |
≥.90 |
.925 |
Accepted and improved
from earlier |
|
CFI |
≥.90 |
.939 |
Accepted and improved
from earlier |
|
PNFI |
≥.50 |
.735 |
Accepted and improved
from earlier |
|
RMSEA |
≥.05 |
.055 |
Accepted and improved
from earlier |
|
Source Researchers' Calculation Through SPSS AMOS 28 |
|||
CMIN/DF (chi-square fit statistics/degree-of-freedom= 628.701/223) is 2.819, which shows an improvement over earlier. The major consideration for overall fit is the likelihood ratio of the Chi-square (χ 2) statistic. In structural equation modeling, it is also the solitary goodness of fit statistic Jöreskog and Sörbom (1993). When there is a substantial difference amidst observed and expected. Chi-Square test is usually implemented to reject H0 and support the alternative. The greater the chi-square value in this situation much better. Moreover, the researcher will be fronting since significant disparity amidst predicted as well as actual matrices when chi-square is used in structural equation modeling Ho (2006). Here, the researcher is not trying to reject null hypotheses. Therefore, the model's fit would better if Chi-Square value is smaller than actual matrices.
The Chi-square is conscious to observe variable deviation from multivariate normality and increases as sample size rises. So, Chi-Square should be used in combination with other goodness-of-fit metrics. There are more metrics available, including GFI and RMSEA. GFI and AGFI are measures of how well a model fits compared to no model Joreskog and Sorbom, 1989, Ho (2006). It is not based on statistics. It has a scale from 0 to 1, with 0 denoting a bad fit and 1 denoting a perfect fit. The table also shows the GFI value of .925 and AGFI Value of .900, which indicate a better fit. Data from current study fit the model perfectly. RMR is square root of the difference in the residuals from sample covariance matrix compared to hypothesized covariance model. Scales of each indicator determine RMR. If a questionnaire has items ranging from 1-5 or when it ranges from 1 to 7, it will be vice versa. Then, it cannot be easy to interpret the RMR Kline (2005). This problem is solved by the Standardized RMR (SRMR). RMR can give the best results because the study uses a 5-point Likert scale ranging from 1-5. RMR values ranging from 0-1 are good for a model's fit. Values closer to 0 indicate a better fit. RMR is 0.088, which indicates a good model. NFI (Normal Fit Index) evaluates model by comparing its value to null model. This statistic has a range of values amidst 0 to 1. Bentler and Bonett (1980) recommend values higher than 0.90 as sign of a good fit. The NFI value of the current study is .910. It clearly shows model fit. NFI has a major flaw. It is sensitive to sample size and underestimates fit for samples smaller than 200 Mulaik et al. (1989), Bentler (1990) and is not recommended to be solely relied on Kline (2005). The NNFI (Non-Normed Fit Index) is created to address this problem. It is also known as TLI-Tucker-Lewis Index. LTI index prefers simple models. However, NNFI can have a problem with its value exceeding 1, making it difficult to understand Byrne (1998). It is best to have NNFI's value >=.90. The table shows that the NNFI value is .925, which is acceptable. CFI is a modified version of the NFI that considers sample size. It performs well even with small sample sizes Tabachnick and Fidell (2007). This index is now included in all SEM programs. It is one of the most commonly reported fit indices because it is the least affected by sample size Fan et al. (1999). This statistic is similar to the NFI. Its values range from 0.0 to 1.0, with values closer than 1.0 meaning a good fit. Overall path model fulfills the cut-off criteria of CFI >= 0.90. PNFI adjusts for degrees of freedom. It is based on the NFI. The PNFI index severely penalizes model complexity, resulting in parsimony-fit index values significantly lower than other goodness-of-fit indices. Mulaik et al. (1989) note that parsimony fit index values can be obtained within the .50-.80 range, while other goodness-of-fit indices may achieve values exceeding .90. The model also has PNFI .735, a good fit model symptom. RMSEA measures discrepancy per degree that takes into account error in population approximation. Browne and Cudeck (1993), as cited in Ho (2006), (p. 285), state that RMSEA can be used to determine ‘How well the model with unknown but closer values would fit the population covariance matrix if measured’ Values ranging between 0.05 and 0.08 indicate acceptable fit, and values ranging from 0.08 and 0.10 indicate poor fitting. The RMSEA value of the measurement model in the current study is 0.055. The model is therefore acceptable.
·
Unstandardized and Standardized Regression
Weights
After satisfying the criteria, it is time to assess unstandardized regression weights and standardized regression weights derived from the maximum likelihood procedure. Each unstandardized regression coefficient is associated with the regression weights table by the critical ratio (C.R.) value and standard error (S.E). Expected variation of an estimated coefficient is standard error. It quantifies how independent variables accurately predict the dependent variables Ho (2006). All S.E. scores, in this case, are minimal. They can range from 0.043 to 0.061.
Table 6
|
Table 6 Unstandardized and Standardized Regression Weights |
|||||||||||
|
Estimate |
S.E. |
C.R. |
P |
Label |
Estimate |
||||||
|
A3 |
<--- |
A |
1.000 |
A3 |
<--- |
A |
.775 |
||||
|
A2 |
<--- |
A |
.939 |
.060 |
15.55 |
*** |
par_1 |
A2 |
<--- |
A |
.653 |
|
A1 |
<--- |
A |
.975 |
.054 |
17.951 |
*** |
par_2 |
A1 |
<--- |
A |
.763 |
|
PB4 |
<--- |
PB |
1.000 |
PB4 |
<--- |
PB |
.818 |
||||
|
PB3 |
<--- |
PB |
.861 |
.051 |
16.944 |
*** |
par_3 |
PB3 |
<--- |
PB |
.704 |
|
PB2 |
<--- |
PB |
.86 |
.051 |
16.994 |
*** |
par_4 |
PB2 |
<--- |
PB |
.704 |
|
PB1 |
<--- |
PB |
.861 |
.054 |
15.852 |
*** |
par_5 |
PB1 |
<--- |
PB |
.661 |
|
PR3 |
<--- |
PR |
1.000 |
PR3 |
<--- |
PR |
.822 |
||||
|
PR2 |
<--- |
PR |
.902 |
.045 |
20.095 |
*** |
par_6 |
PR2 |
<--- |
PR |
.780 |
|
PR1 |
<--- |
PR |
1.077 |
.056 |
19.164 |
*** |
par_7 |
PR1 |
<--- |
PR |
.734 |
|
PS1 |
<--- |
PS |
1.000 |
PS1 |
<--- |
PS |
.796 |
||||
|
PS2 |
<--- |
PS |
1.005 |
.053 |
19.043 |
*** |
par_8 |
PS2 |
<--- |
PS |
.764 |
|
PS3 |
<--- |
PS |
.971 |
.054 |
18.114 |
*** |
par_9 |
PS3 |
<--- |
PS |
.736 |
|
PS4 |
<--- |
PS |
.920 |
.050 |
18.505 |
*** |
par_10 |
PS4 |
<--- |
PS |
.750 |
|
PV1 |
<--- |
PV |
1.000 |
PV1 |
<--- |
PV |
.866 |
||||
|
PV2 |
<--- |
PV |
.947 |
.045 |
20.914 |
*** |
par_11 |
PV2 |
<--- |
PV |
.800 |
|
PV3 |
<--- |
PV |
.885 |
.043 |
20.507 |
*** |
par_12 |
PV3 |
<--- |
PV |
.783 |
|
PV4 |
<--- |
PV |
.224 |
.046 |
4.825 |
*** |
par_13 |
PV4 |
<--- |
PV |
.195 |
|
BI4 |
<--- |
BI |
1.000 |
BI4 |
<--- |
BI |
.753 |
||||
|
BI3 |
<--- |
BI |
1.056 |
.061 |
17.308 |
*** |
par_14 |
BI3 |
<--- |
BI |
.736 |
|
BI2 |
<--- |
BI |
.172 |
.055 |
3.125 |
0.002 |
par_15 |
BI2 |
<--- |
BI |
.133 |
|
BI1 |
<--- |
BI |
.931 |
.054 |
17.129 |
*** |
par_16 |
BI1 |
<--- |
BI |
.728 |
|
M1 |
<--- |
M |
1.000 |
M1 |
<--- |
M |
.758 |
||||
|
M2 |
<--- |
M |
1.045 |
.054 |
19.397 |
*** |
par_17 |
M2 |
<--- |
M |
.838 |
|
Source Researchers' Calculation Through SPSS AMOS 28 |
|||||||||||
Critical ratio (CR) is used to test the implication of the path coefficient. Path coefficient can be captured by dividing parameter estimates with corresponding standard error. It is located as z Ho (2006). So, the extreme value of CR can be ± 1.96, and its significance path is p < 0.05. Unstandardized regression weights fulfill this criterion in above table. Here, the critical ratio and significant value are > ± 1.96, p < 0.05, except for those parameters where the value is fixed to 1.
Standardized regression weights measure the standard deviation of dependent variables. It estimates how a dependent variable will transit when one standard deviation increases in the independent variable. The standardized regression estimate is almost more than .6, which indicates the goodness of model fit.
6. Evaluation OF THE STRUCTURAL MODEL (SEM)
After the modified measurement model is confirmed, fit of structural path model is checked. Structural modeling is used to know the causal relationship between the constructs. So, it is also called a casual model.
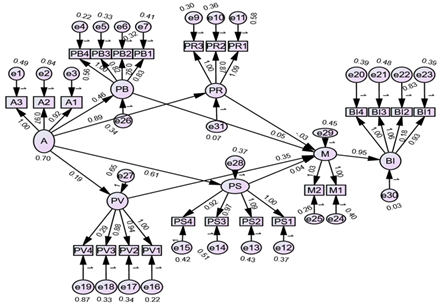
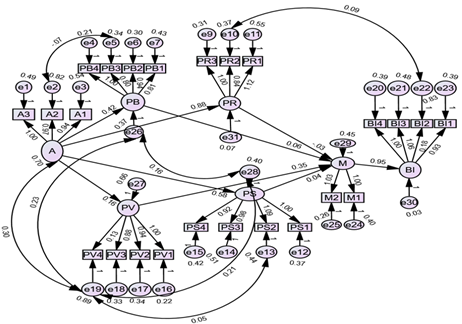
The graphical display of the structural model's findings, following figure, shows the unstandardized regression weights for each association as well as the accompanying variances and covariance. The figure, for instance, shows that the effect of Awareness (A) on Perceived Benefits (PB) is related to unstandardized regression weight β = 0.46, whereas that of A on Perceived Risks (PR) is β = 0.89. Variations for perceived fraud severity (PS) and perceived fraud susceptibility (PV) are also 0.61 and 0.19, respectively. Also, following figure further reveals that unstandardized regression weight of the influence of PB on M is β = 0.05. Similarly, variance for Perceived Severity of fraud, PS and Perceived Vulnerability/Susceptibility to fraud PV are 0.04 and 0.35 respectively. However, PR negatively influences M as β = -0.03.
Figure 4
|
Figure 4 Structural Equation Model Source Researchers' Development Through SPSS AMOS 28 |
The structural model also needs to complete the criteria. The following table shows the cut-off criteria for the structural model:
Table 7
|
Table 7 Comparison of Threshold level with the Default Model |
|||
|
Measures |
Threshold Level |
Default Model |
Remark |
|
CMIN/DF |
>3 |
3.756 |
Accepted |
|
GFI |
≥.90 |
0.882 |
Rejected |
|
AGFI |
≥.90 |
0.854 |
Rejected |
|
RMR |
<.08 |
0.099 |
Rejected |
|
NFI |
≥.90 |
0.869 |
Rejected |
|
NNFI(TLI) |
≥.90 |
0.886 |
Rejected |
|
CFI |
≥.90 |
0.9 |
Accepted |
|
PNFI |
≥.50 |
0.765 |
Accepted |
|
RMSEA |
≥.05 |
0.068 |
Accepted |
|
Source Researchers' Calculation
Through SPSS AMOS 28 |
|||
From the above table, it is clear that the model fits 4 criteria and is rejected in 5. The rejection rate is more than 50%, but some modifications also allowed for fitting the model and completing most of the criteria. So, the researcher accepts the modifications. The following table shows the modifications allowed in the path model.
·
Modification Indices
Table 8 shows the modification allowed to fit the structure model.
Table 8
|
Table 8 Modification Indices |
||||
|
M.I. |
Par Change |
|||
|
e28 |
<--> |
e27 |
10.039 |
0.081 |
|
e26 |
<--> |
e28 |
57.501 |
0.149 |
|
e22 |
<--> |
A |
40.044 |
0.211 |
|
e22 |
<--> |
e28 |
39.876 |
0.169 |
|
e22 |
<--> |
e26 |
51.122 |
0.18 |
|
e19 |
<--> |
A |
102.67 |
0.347 |
|
e19 |
<--> |
e28 |
57.113 |
0.207 |
|
e19 |
<--> |
e31 |
14.789 |
0.082 |
|
e19 |
<--> |
e26 |
66.499 |
0.211 |
|
e19 |
<--> |
e22 |
46.858 |
0.239 |
|
e13 |
<--> |
e31 |
11.33 |
0.058 |
|
e13 |
<--> |
e19 |
16.748 |
0.118 |
|
e11 |
<--> |
e28 |
14.493 |
-0.092 |
|
e11 |
<--> |
e26 |
17.102 |
-0.094 |
|
e10 |
<--> |
e22 |
11.219 |
0.081 |
|
e9 |
<--> |
e26 |
10.56 |
0.056 |
|
e6 |
<--> |
e27 |
11.292 |
0.076 |
|
e6 |
<--> |
e19 |
20.091 |
0.108 |
|
e4 |
<--> |
e28 |
11.603 |
0.057 |
|
e4 |
<--> |
e19 |
11.422 |
0.074 |
|
e3 |
<--> |
e26 |
18.531 |
-0.095 |
|
e3 |
<--> |
e10 |
12.855 |
-0.077 |
|
e3 |
<--> |
e6 |
18.937 |
-0.091 |
|
e2 |
<--> |
e11 |
28.588 |
0.173 |
|
e2 |
<--> |
e10 |
10.087 |
-0.081 |
|
e2 |
<--> |
e5 |
12.108 |
-0.086 |
|
Source Researchers' Calculation Through SPSS 28 |
||||
· Model Fit After modifications
After doing the above modification, the researcher develops the following Structural Model.
Figure 5
|
Figure 5 Structural
Equation Model After Modifications Source Researchers'
Development Through SPSS AMOS 28 |
The default model is compared with the threshold levels to check whether the model is fit or not.
Table 9
|
Table 9 Comparison of Threshold Value with the Default Model |
|||
|
Measures |
Threshold
Level |
Default
Model |
Remark |
|
CMIN/DF |
>3 |
2.520 |
Accepted and improved from earlier |
|
GFI |
≥.90 |
.926 |
Accepted and improved from earlier |
|
AGFI |
≥.90 |
.905 |
Accepted and improved from earlier |
|
RMR |
≤.08 |
.064 |
Accepted and improved from earlier |
|
NFI |
≥.90 |
.915 |
Accepted and improved from earlier |
|
NNFI(TLI) |
≥.90 |
.937 |
Accepted and improved from earlier |
|
CFI |
≥.90 |
.946 |
Accepted and improved from earlier |
|
PNFI |
≥.50 |
.782 |
Accepted and improved from earlier |
|
RMSEA |
≥.05 |
.050 |
Accepted and improved from earlier |
|
Source Researchers' Calculation Through SPSS AMOS 28 |
|||
After structural model fit, it is necessary to begin by assessing unstandardized regression weights and standardized regression weights generated from maximum likelihood procedure.
·
Unstandardized and Standardized Regression
Weights
The standard error and critical ratio values are listed next to each estimated unstandardized regression coefficient in regression weights table. Predicted variation of the calculated coefficient is represented by the standard error of the coefficients. It measures how well predictor factors performed in predicting endogenous variable Ho (2006). Usefulness of S.E. is that predictor variable is more effective smaller it is. All of the S.E. scores in this instance are low. They vary from 0.041 to 0.061. The critical ratio, which is calculated by dividing the parameter estimate by the corresponding standard error, evaluates the relevance of the route coefficient. It is generally distributed as z Ho (2006). Consequently, a critical ratio that is significantly different from ± 1.96 indicates a significant path (p < 0.05).
Table 10
|
Table 10 Unstandardized Regression Weights and Standardized Regression Weights |
|||||||||||
|
Estimate |
S.E. |
C.R. |
P |
Label |
Estimate |
||||||
|
PB |
<--- |
A |
.424 |
.041 |
10.416 |
*** |
par_18 |
PB |
<--- |
A |
.506 |
|
PS |
<--- |
A |
.576 |
.047 |
12.223 |
*** |
par_19 |
PS |
<--- |
A |
.606 |
|
PV |
<--- |
A |
.158 |
.047 |
3.398 |
*** |
par_20 |
PV |
<--- |
A |
.160 |
|
PR |
<--- |
A |
.880 |
.049 |
17.99 |
*** |
par_22 |
PR |
<--- |
A |
.940 |
|
M |
<--- |
PB |
.057 |
.064 |
.890 |
.373 |
par_23 |
M |
<--- |
PB |
.054 |
|
M |
<--- |
PR |
-0.03 |
.055 |
-0.532 |
.595 |
par_24 |
M |
<--- |
PR |
-0.032 |
|
M |
<--- |
PV |
0.348 |
.043 |
8.130 |
*** |
par_25 |
M |
<--- |
PV |
.392 |
|
M |
<--- |
PS |
.042 |
.061 |
.679 |
.497 |
par_26 |
M |
<--- |
PS |
.045 |
|
BI |
<--- |
M |
.947 |
.057 |
16.633 |
*** |
par_21 |
BI |
<--- |
M |
.973 |
|
A3 |
<--- |
A |
1.000 |
A3 |
<--- |
A |
.766 |
||||
|
A2 |
<--- |
A |
.968 |
.061 |
15.887 |
*** |
par_1 |
A2 |
<--- |
A |
.667 |
|
A1 |
<--- |
A |
.937 |
.054 |
17.413 |
*** |
par_2 |
A1 |
<--- |
A |
.728 |
|
PB4 |
<--- |
PB |
1.000 |
PB4 |
<--- |
PB |
.834 |
||||
|
PB3 |
<--- |
PB |
.805 |
.046 |
17.394 |
*** |
par_3 |
PB3 |
<--- |
PB |
.694 |
|
PB2 |
<--- |
PB |
.942 |
.048 |
19.429 |
*** |
par_4 |
PB2 |
<--- |
PB |
.767 |
|
PB1 |
<--- |
PB |
.815 |
.050 |
16.320 |
*** |
par_5 |
PB1 |
<--- |
PB |
.658 |
|
PR3 |
<--- |
PR |
1.000 |
PR3 |
<--- |
PR |
.817 |
||||
|
PR2 |
<--- |
PR |
.842 |
.044 |
18.960 |
*** |
par_6 |
PR2 |
<--- |
PR |
.735 |
|
PR1 |
<--- |
PR |
1.117 |
.057 |
19.633 |
*** |
par_7 |
PR1 |
<--- |
PR |
.762 |
|
PS1 |
<--- |
PS |
1.000 |
PS1 |
<--- |
PS |
.792 |
||||
|
PS2 |
<--- |
PS |
1.089 |
.055 |
19.718 |
*** |
par_8 |
PS2 |
<--- |
PS |
.795 |
|
PS3 |
<--- |
PS |
.976 |
.054 |
18.188 |
*** |
par_9 |
PS3 |
<--- |
PS |
.736 |
|
PS4 |
<--- |
PS |
.923 |
.050 |
18.541 |
*** |
par_10 |
PS4 |
<--- |
PS |
.749 |
|
PV1 |
<--- |
PV |
1.000 |
PV1 |
<--- |
PV |
.871 |
||||
|
PV2 |
<--- |
PV |
.940 |
.045 |
20.813 |
*** |
par_11 |
PV2 |
<--- |
PV |
.798 |
|
PV3 |
<--- |
PV |
.879 |
.043 |
20.460 |
*** |
par_12 |
PV3 |
<--- |
PV |
.783 |
|
PV4 |
<--- |
PV |
.134 |
.042 |
3.192 |
.001 |
par_13 |
PV4 |
<--- |
PV |
.115 |
|
BI4 |
<--- |
BI |
1.000 |
BI4 |
<--- |
BI |
.753 |
||||
|
BI3 |
<--- |
BI |
1.057 |
.061 |
17.289 |
*** |
par_14 |
BI3 |
<--- |
BI |
.736 |
|
BI2 |
<--- |
BI |
.182 |
.056 |
3.261 |
0.001 |
par_15 |
BI2 |
<--- |
BI |
.141 |
|
BI1 |
<--- |
BI |
.927 |
.054 |
17.024 |
*** |
par_16 |
BI1 |
<--- |
BI |
.725 |
|
M1 |
<--- |
M |
1.000 |
M1 |
<--- |
M |
.756 |
||||
|
M2 |
<--- |
M |
1.034 |
.054 |
19.323 |
*** |
par_17 |
M2 |
<--- |
M |
.827 |
|
Source Researchers' Calculation Through SPSS AMOS 28 |
|||||||||||
According to this criterion, Table's findings show critical ratio test of all the unstandardized regression weights are positive (> ± 1.96, p < 0.05) (except for those parameters that were fixed to 1). Standardized regression weight in above table indicates that awareness is positively related to PB, PS, PV, and PR (β = 0.506, .606, .160, .940, respectively).
Hence, more awareness will promote a more positive perception of forensic accounting. It, therefore, implies that greater awareness of forensic accounting, higher perceived benefits of using forensic accounting services. Similarly, perceived severity of fraud positively relates to awareness (β=0.606). Therefore, auditors will also intend to use forensic accounting services as the perceived severity of fraud increases. Furthermore, perceived susceptibility/vulnerability to fraud is significantly and positively related to awareness (β = 0.160). Hence, higher perceived susceptibility to fraud, more auditors will be aware of forensic accounting services. Moreover, awareness is positively related to perceived risk or barrier to using forensic accounting services (β =.940). Thus, there is more awareness and knowledge about the barriers and risks in implementing forensic accounting services. When Auditors perceive fewer risks or barriers in using forensic accounting, they will go for it. The risks or barriers here may be in terms of cost of acquiring services of expert forensic accountant and more competition among audit firms for providing forensic accounting services, which may hamper the quality of service, as forensic accounting does not take any guarantee of payback of stolen money, but, if the forensic accountant is called upon the reputation of the organization will be on the stake as investors will think something wrong is happening in the organization, so, the investment will reduce. Therefore, awareness regarding perceived barriers and risks can be used to overcome these obstacles.
The standardized regression weights in above table further reveal that the perceived benefits of using forensic accounting are positively related to motivation (β = 0.054). Additional advantages of forensic accounting encourage auditors to adopt these services. However, perceived risks negatively motivate to use of forensic accounting as Perceived Risk is negatively related to motivation (β = -0.032). It means that when the auditors are aware of the risks that cannot be controlled, it will negatively motivate them not to use forensic accounting. Perceived susceptibility/vulnerability and perceived severity also positively impact motivation as β = .392, and .045 respectively. Finally, motivation positively impacts behavioral intention to use forensic accounting services as β = .973, which is the highest and near 1.
·
Squared Multiple Correlations
Having assessed regression and standardized regression weights, one can now examine explanatory powers of the model. Falk and Miller (1992) suggest that minimum coefficient of determination, R2, should be 0.10 for a model to be considered influential. Below table shows squared multiple correlations of structural model. The Table 12 presents coefficients of determination and R2 of all endogenous constructs.
Table 11
|
Table 11 Squared Multiple Correlations of the Structural Model |
|||||||||
|
|
PV |
PS |
PR |
PB |
M |
BI |
M2 |
M1 |
BI1 |
|
Estimate |
0.026 |
0.368 |
0.884 |
0.256 |
0.163 |
0.947 |
0.685 |
0.572 |
0.526 |
|
BI2 |
BI3 |
BI4 |
PV4 |
PV3 |
PV2 |
PV1 |
PS4 |
PS3 |
|
|
Estimate |
0.02 |
0.542 |
0.568 |
0.027 |
0.613 |
0.637 |
0.759 |
0.561 |
0.542 |
|
PS2 |
PS1 |
PR1 |
PR2 |
PR3 |
PB1 |
PB2 |
PB3 |
PB4 |
|
|
Estimate |
0.631 |
0.628 |
0.581 |
0.541 |
0.667 |
0.433 |
0.589 |
0.482 |
0.696 |
|
A1 |
A2 |
A3 |
|||||||
|
Estimate |
0.53 |
0.444 |
0.587 |
||||||
|
Source Researchers Calculation
Through SPSS AMOS 28 |
|||||||||
Table 12
|
Table 12 Summary of coefficient of determination R2 for endogenous constructs |
|
|
Construct |
R2 |
|
Perceived Susceptibility/Vulnerability |
.026 |
|
Perceived Severity |
.368 |
|
Perceived Risk |
.884 |
|
Perceived Benefits |
.256 |
|
Motivation |
.163 |
|
Behavioral Intention |
.947 |
|
Source Researchers' Calculation Through SPSS AMOS 28 |
|
Above table shows all R2 values that are above the minimum requirement of 0.10. Above all, model's overall coefficient of multiple determination (R2) value is 0.947. It means that data fit the model well, and model explains 94.70 percent of deviation from the impulsion to adoption of forensic accounting services. The value is much greater than the recommendations of Muthusamy et al. (2010) and Efiong and Joel (2013) in which case the model was able to explain 39.50% and 68.20% of the total variance. For this study, unexplained 0.053 percent variance in the behavioral intention of using forensic accounting services is attributed to residual. Hence, a relatively high percentage of auditors intend to use forensic accounting in fraud prevention or detection.
7. TEST OF MODEL HYPOTHESIS
Hypothesis 1: Awareness of forensic accounting has an impact on the perceived benefits of using it against fraud.
H0: Awareness of forensic accounting has a negative impact on the perceived benefits of using it against fraud.
H1: Awareness of forensic accounting has a positive impact on the perceived benefits of using it against fraud.
The result of study shows that awareness of forensic accounting services positively influences the perceived benefits (β= 0.42) of using it. This finding is similar to that of Muthusamy et al. (2010), Efiong and Joel (2013), and Wei et al. (2017). It, therefore, means that more auditors are aware of forensic accounting services, more they will perceive the benefits of using it in their organizations.
Hypothesis 2: Awareness of forensic accounting has an impact on the perceived risks of using it against fraud.
H0: Awareness of forensic accounting has a negative impact on the perceived risks of using it against fraud.
H1: Awareness of forensic accounting has a positive impact on the perceived risks of using it against fraud.
The result of the study shows that awareness of forensic accounting services positively influences perceived risks (β= 0.88) of using it. It means that more auditors are aware of forensic accounting services, more they will perceive risks of using them and how to handle these risks or barriers in their organizations.
Hypothesis 3: Awareness of forensic accounting has an impact on the perceived susceptibility/vulnerability of using it against fraud.
H0: Awareness of forensic accounting has a negative impact on perceived susceptibility/vulnerability of using it against fraud.
H1: Awareness of forensic accounting has a positive impact on perceived susceptibility/vulnerability of using it against fraud.
In this hypothesis, researchers test the influence of awareness on the threat perception factor, i.e., Perceived Susceptibility/Vulnerability, as β = 0.16. This finding is similar to that of Muthusamy et al. (2010), Efiong and Joel (2013), and Wei et al. (2017). Therefore, it means that the more auditors are aware of fraud and its negative impact on the organization, the more they will use forensic accounting services.
Hypothesis 4: Awareness of forensic accounting has an impact on the perceived severity of using it against fraud.
H0: Awareness of forensic accounting has a negative impact on the perceived severity of using it against fraud.
H1: Awareness of forensic accounting has a positive impact on the perceived severity of using it against fraud.
Similarly, statistical analysis confirmed positive influence of awareness on the perceived severity of fraud as β is 0.58. Nowadays, frauds are increasing as the pandemic, and the need for more awareness arises. This finding also marked an improvement in the insignificant influence obtained by Muthusamy et al. (2010).
Hypothesis 5: Perceived benefits of forensic accounting have an impact on motivation to use it against fraud.
H0: Perceived benefits of forensic accounting have a negative impact on motivation to use it against fraud.
H1: Perceived benefits of forensic accounting have a positive impact on motivation to use it against fraud.
The overall structural model shows positive β = 0.06 with Motivation, so it can be said that perceived benefits have a positive impact on motivation to use forensic accounting services. So, H0 is not accepted.
Hypothesis 6: Perceived risks of forensic accounting have an impact on motivation to use it against fraud.
H0: Perceived risks of forensic accounting have a negative impact on motivation to use it against fraud.
H1: Perceived risks of forensic accounting have a positive impact on motivation to use it against fraud.
The figure shows negative β = -0.03 with Motivation, so it can be said that perceived risks have a negative impact on motivation to use it. So, H0 is accepted.
Hypothesis 7: Perceived susceptibility/vulnerability of forensic accounting has an impact on motivation to use it against fraud.
H0: Perceived susceptibility/vulnerability of forensic accounting has a negative impact on motivation to use it against fraud.
H1: Perceived susceptibility/vulnerability of forensic accounting has a positive impact on motivation to use it against fraud.
The overall structural model shows perceived susceptibility/vulnerability has positive β = 0.35 with motivation, so it can be said that perceived susceptibility/vulnerability positively impacts motivation to use it. So, H0 is not accepted.
Hypothesis 8: Motivation to use forensic accounting has an impact on behavioral intention to implement it for fraud prevention or detection.
H0: Motivation to use forensic accounting has a negative impact on behavioral intention to implement it for fraud prevention or detection.
H1: Motivation to use forensic accounting has a positive impact on behavioral intention to implement it for fraud prevention or detection.
Overall structural model shows motivation has a positive value of β = 0.95 with the behavioral intention to implement forensic accounting for fraud prevention or detection. So, H0 is not accepted.
8. CONCLUSION
Fraud is omnipresent in the corporate world. Fraud and its type have significant contribution in the severe financial crisis, and its negative consequences paralyze the economic entities all over the world. Hence, it is important to understand the nature of fraud and try to prevent before its occurrence. The traditional financial auditors are not capable enough to identify the red signals of fraudulent activities. They only come to know the fraud after its occurrence. The stakeholders expect from the financial auditors to provide them a true and fair position of the financial statement without any symptom of fraud, but the auditor’s perception is that they can provide their opinion on truthfulness; they are not trained to identify the fraud. Hence, an expectation gap is arising between auditors and stakeholders. Here, forensic accountants can play a major role to identify the fraud before its occurrence even they can assist in court. The forensic accountants not only recognize the fraud symptoms and typologies but also provide suggestions regarding human capital investment that increase employees’ sensitivity to identify the fraud and discourage the participation in financial crime.
There are many theories develop by eminent scholars which shows the factors that motivate an employee to commit fraud like fraud triangle, diamond theory of fraud, fraud pentagon, etc. This research provides new theoretical framework based on various models & theories and develop a new research model named as “Fraud Deviation Model”. The quantitative data was used to know the impact of auditor’s awareness and perception on forensic accounting. Furthermore, the gender has no association with level of awareness but the other demographic variables like age, job description, service tenure of auditor, type, nature, and turnover of the auditing organization have significant and positive relationships. The impact of awareness and perception on behavioral intention to use forensic accounting is analyzed with the help of structure equation modeling. The outcome shows that awareness positively impacts perceived benefits, perceived risk, perceived vulnerability/susceptibility, and perceived severity. Further, the three factors (perceived benefits, perceived vulnerability/susceptibility, and perceived severity) positively influence and motivate the use of forensic accounting, but the perceived risk negatively motivates forensic accounting. However, the negative influence of using forensic accounting is less in comparison to its positive impact. So overall, motivation creates positive behavior among auditors and organizations to use forensic accounting.
On the whole, the present research provides insights on current status of auditor’s awareness and perception on forensic accounting and its impact on behavioral intention to use forensic accounting technique as fraud detection and preventive tool. There is a need to increase level of awareness among auditors as well as top management. Forensic accounting should be part of curriculum that can help in spread out the awareness and in the aftermath promote the forensic accounting as fraud prevention and detective measure. Although forensic accounting is in its blossoming point in India but due to increasing scams and frauds it becomes a new emerging field of accounting now-a-days.
CONFLICT OF INTERESTS
None.
ACKNOWLEDGMENTS
None.
REFERENCES
Abraham, C., & Sheeran, P. (2005). The Health Belief Model. In M. Conner & P. Norman (Eds.), Predicting health behaviour: Research and practice with social cognition models (2nd ed., pp. 28–80). Open University Press.
Ajzen, I., & Fishbein, M. (1980). Understanding Attitudes and Predicting Social Behavior. Prentice-Hall. Retrieved from
Alfordy, F. D. (2022). Effective Detection and Prevention of Fraud: Perceptions Among Public and Private Sectors Accountants and Auditors in Saudi Arabia. E&M Economics and Management, 25(3), 106–121. https://doi.org/10.15240/tul/001/2022-3-007
Alhassan, I. (2021). Forensic Accounting and Fraud Detection and Prevention in the Nigerian Public Sector. International Journal of Empirical Finance and Management Sciences, 3, 12–22.
Alshurafat, H. A. (2019). Forensic Accounting Curricula and Pedagogies in Australian Universities: Analysis of Academic and Practitioner Perspectives. [Doctoral dissertation, University of Southern Queensland].
Alshurafat, H., Al Shbail, M. O., & Mansour, E. (2021). Strengths and Weaknesses of Forensic Accounting: An Implication on the Socio-Economic Development. Journal of Business and Socio-economic Development, 1(2), 135–148. https://doi.org/10.1108/JBSED-03-2021-0026
Association of Certified Fraud Examiners. (2020). Report to the Nations on Occupational Fraud and Abuse. ACFE.
Barry, T. E., & Howard, D. J. (1990). A Review and Critique of the Hierarchy of Effects in Advertising. International Journal of Advertising, 9(2), 121–135. https://doi.org/10.1080/02650487.1990.11107138
Bentler, P. M. (1990). Comparative Fit Indexes in Structural Models. Psychological Bulletin, 107(2), 238–246. https://doi.org/10.1037/0033-2909.107.2.238
Bentler, P. M., & Bonett, D. G. (1980). Significance Tests and Goodness of Fit in the Analysis of Covariance Structures. Psychological Bulletin, 88(3), 588–606. https://doi.org/10.1037/0033-2909.88.3.588
Boomsma, A. (2000). Reporting Analyses of Covariance Structures. Structural Equation Modeling, 7(3), 461–483. https://doi.org/10.1207/S15328007SEM0703_6
Bressler, L. (n.d.). The Role of Forensic Accountants in Fraud Investigations: Importance of Attorney and Judge's Perceptions. Journal of Finance and Accountancy, 1–9.
Browne, M. W., & Cudeck, R. (1993). Alternative Ways of Assessing Model Fit. In K. A. Bollen & J. S. Long (Eds.), Testing structural equation models (pp. 136–162). Sage.
Byrne, B. M. (1998). Structural Equation Modeling with LISREL, PRELIS, and SIMPLIS: Basic Concepts, Applications, and Programming. Lawrence Erlbaum Associates.
Chamroonsawasdi, K., Chottanapund, S., Tunyasitthisundhorn, P., Phokaewsuksa, N., Ruksujarit, T., & Phasuksathaporn, P. (2017). Development and Validation of a Questionnaire to Assess Knowledge, Threat, Coping Appraisal, and Intention to Practice Healthy Behaviors Related to Non-Communicable Diseases in the Thai Population. Behavioral Sciences, 7(2), Article 20. https://doi.org/10.3390/bs7020020
Cheliatsidou, A., Sariannidis, N., Garefalakis, A., Azibi, J., & Kagias, P. (2022). The International Fraud Triangle. Journal of Money Laundering Control. https://doi.org/10.1108/JMLC-09-2021-0103
Chhabra, R. N., & Prabhakaran, S. (2022). Internal-led Cyber Frauds in Indian Banks: An Effective Machine Learning–Based Defense System to Fraud Detection, Prioritization and Prevention. Aslib Journal of Information Management, 75(2), 246–296. https://doi.org/10.1108/AJIM-11-2021-0339
Clavería Navarrete, A., & Carrasco Gallego, A. (2023). Forensic Accounting Tools for Fraud Deterrence: A Qualitative Approach. Journal of Financial Crime, 30(3), 840–854. https://doi.org/10.1108/JFC-03-2022-0068
Crowley, S. L., & Fan, X. (1997). Structural Equation Modeling: Basic Concepts and Applications in Personality Assessment Research. Journal of Personality Assessment, 68(3), 508–531. https://doi.org/10.1207/s15327752jpa6803_4
Doukas, D., Localio, A., & Li, Y. (2004). Attitudes and Beliefs Concerning Prostate Cancer Genetic Screening. Clinical Genetics, 66(5), 445–451. https://doi.org/10.1111/j.1399-0004.2004.00305.x
Durkin, R. L., & Harry, E. P. (1997). Fraud Investigations in Litigation and Dispute Resolution Services: A Nonauthoritative Guide; Consulting Services Practice aid (97[1]). American Institute of Certified Public Accountants.
Dutta, P. P. (2018). Forensic Accounting in India: A New Vibrant Approach to Prevent White Collar Crimes: An Empirical Study. International Journal of Basic and Applied Research, 8(9), 1122–1137.
Efiong, E., & Joel. (2013). An Exploration of Forensic Accounting Education and Practice for Fraud Prevention and Detection in Nigeria. De Montfort University.
Falk, R. F., & Miller, N. B. (1992). A Primer for Soft Modeling. University of Akron Press.
Fan, X., Thompson, B., & Wang, L. (1999). Effects of Sample Size, Estimation Methods, and Model Specification on Structural Equation Modeling Fit Indexes. Structural Equation Modeling, 6(1), 56–83. https://doi.org/10.1080/10705519909540119
Fishbein, M., & Ajzen, I. (1977). Belief, Attitude, Intention, and Behavior: An Introduction to Theory and Research. Philosophy and Rhetoric, 10(2). Retrieved from
Gewald, H., Wüllenweber, K., & Weitzel, T. (2006). The Influence of Perceived Risks on Banking Managers' Intention to Outsource Business Processes: A Study of the German Banking and Finance Industry. Journal of Electronic Commerce Research, 7.
Ham, C. D. (2017). Exploring How Consumers Cope with Online Behavioral Advertising. International Journal of Advertising, 36(4), 632–658. https://doi.org/10.1080/02650487.2016.1239878
Harrison, J. A., Mullen, P. D., & Green, L. W. (1992). A Meta-Analysis of Studies of the Health Belief Model with Adults. Health Education Research, 7(1), 107–116. https://doi.org/10.1093/her/7.1.107
Heijden, H. van der, Verhagen, T., & Creemers, M. (2003). Understanding Online Purchase Intentions: Contributions from Technology and Trust Perspectives. European Journal of Information Systems, 12(1), 41–48. https://doi.org/10.1057/palgrave.ejis.3000445
Ho, R. (2006). Handbook of Univariate and Multivariate Data Analysis and Interpretation with SPSS. CRC Press. https://doi.org/10.1201/9781420011111
Honigsberg, C. (2020). Forensic Accounting. Annual Review of Law and Social Science, 16, 147–164. https://doi.org/10.1146/annurev-lawsocsci-020320-022159
Hossain, D. M., Mazumder, M., & Md. Saiful, A. (2020). Forensic Accounting and Fraud Investigation: A Conceptual Summary. The Cost and Management, 48(6), 1–9. https://doi.org/10.5860/CHOICE.50-0964
Hu, L.-t., & Bentler, P. M. (1999). Cutoff Criteria for Fit Indexes in Covariance Structure Analysis: Conventional Criteria Versus New Alternatives. Structural Equation Modeling, 6(1), 1–55. https://doi.org/10.1080/10705519909540118
Janz, N. K., & Becker, M. H. (1984). The Health Belief Model: A Decade Later. Health Education Quarterly, 11(1), 1–47. https://doi.org/10.1177/109019818401100101
Jöreskog, K. G., & Sörbom, D. (1993). LISREL 8: Structural Equation Modeling with the Simplis Command Language. Scientific Software International.
KPMG. (2009). Report on 2009 Inspection of KPMG LLP. Public Company Accounting Oversight Board (PCAOB Release No. 104-2010-132).
Kline, R. B. (2005). Principles and Practice of Structural Equation Modeling (2nd ed.). Guilford Press.
Konar, E. M., & Aiyar, S. (n.d.). A Study on Forensic Accounting Profession in India and Around the World. Tactful Management Research Journal, 85–91. ISSN: 2319-7943
Kumar, M. B., Nandeesh, & Ayyappa, R. (2018). Role of Forensic Accounting – An Analysis. International Journal of Research and Analytical Reviews (IJRAR), 5(4), 221–232.
Lajunen, T., & Räsänen, M. (2004). Can Social Psychological Models Be Used to Promote Bicycle Helmet Use Among Teenagers? A Comparison of the Health Belief Model, Theory of Planned Behavior, and the Locus of Control. Journal of Safety Research, 35(1), 115–123. http://dx.doi.org/10.1016/j.jsr.2003.09.020
Lama, P., & Chaudhuri, B. (2018). Forensic Accounting: A Study of Its Role in Investigating Corporate Frauds and Scams in India. 11th International Conference on Science, Technology, and Management, Osmania University Centre for International Program, Osmania University Campus, Hyderabad (India), 7(1), 72–84. Retrieved from
Lavidge, R. J., & Steiner, G. A. (1961). A Model for Predictive Measurements of Advertising Effectiveness. Journal of Marketing, 25(6), 59–62. https://doi.org/10.2307/1248516
Lee, C.-C., & Nuxoll, C. (2018). A Forensic Accounting Case: A Data Analytic Mindset. Journal of Forensic & Investigative Accounting, 10(3), 436–437.
Liñán, F., Rodríguez-Cohard, J. C., & Rueda-Cantuche, J. (2005). Factors Affecting Entrepreneurial Intention Levels. 45th Congress of the European Regional Science Association, Amsterdam, August 23–27.
Lu, H. P., Hsu, C. L., & Hsu, H. Y. (2005). An Empirical Study of the Effect of Perceived Risk Upon Intention to Use Online Applications. Information Management & Computer Security, 13(2), 106–120. https://doi.org/10.1108/09685220510589299
Martins, C., Oliveira, T., & Popovič, A. (2014). Understanding the Internet Banking Adoption: A Unified Theory of Acceptance and Use of Technology and Perceived Risk Application. International Journal of Information Management, 34(1), 1–13. https://doi.org/10.1016/j.ijinfomgt.2013.06.002
Mbasiti, H., Gyang, Y., & Fransis, O. (2021). An Assessment of Forensic Accounting Techniques in the Prevention of Revenue Leakages in Nigerian Federal Universities. Journal of Accounting, 4(1), 1–11. https://doi.org/10.47941/jacc.601
McDonald, R. P., & Ho, M.-H. R. (2002). Principles and Practice in Reporting Structural Equation Analyses. Psychological Methods, 7(1), 64–82. https://doi.org/10.1037/1082-989X.7.1.64
Mui, G. Y. (2018). Defining Auditor Expertise in Fraud Detection. Journal of Forensic & Investigative Accounting, 10(2), 168–186.
Mulaik, S. A., James, L. R., Alstine, J., Bennett, N., Lind, S., & Stilwell, C. D. (1989). Evaluation of Goodness-of-Fit indices for Structural Equation Models. Psychological Bulletin, 105(3), 430–445. https://doi.org/10.1037/0033-2909.105.3.430
Murphy, J. J., Allen, P. G., Stevens, T. H., & Weatherhead, D. (2005). A Meta-Analysis of Hypothetical bias in Stated Preference Valuation. Environmental and Resource Economics, 30(3), 313–325. https://doi.org/10.1007/s10640-004-3332-z
Murray, K., & Vogel, C. (1997). Using a Hierarchy-of-Effects Approach to Gauge the Effectiveness of Corporate Social Responsibility to Generate Goodwill Toward the Firm: Financial Versus Nonfinancial Impacts. Journal of Business Research, 38(2), 141–159. https://doi.org/10.1016/S0148-2963(96)00061-6
Muthusamy, G., Quaddus, M., & Evans, R. (2010). Organizational Intention to Use Forensic Accounting for Fraud Detection and Prevention By Large Malaysian Companies. In A. Gupta (Ed.), Proceedings of the 2010 Oxford Business & Economic Conference (OBEC), June 28–30, Oxford University. Retrieved from
Noar, S. M., & Rick, S. Z. (2005). Health Behavior Theory and Cumulative Knowledge Regarding Health Behaviors: Are We Moving in the Right Direction? Health Education Research, 20(3), 275–290. https://doi.org/10.1093/her/cyg113
Owusu, G. M. Y., Koomson, T. A. A., Alipoe, S. A., & Kani, Y. A. (2022). Examining the Predictors of Fraud in State-Owned Enterprises: An Application of the Fraud Triangle Theory. Journal of Money Laundering Control, 25(2), 427–444. https://doi.org/10.1108/JMLC-05-2021-0053
Ozili, P. K. (2020). Forensic accounting theory. In E. Özen & S. Grima (Eds.), Uncertainty and Challenges in Contemporary Economic Behaviour (pp. 49–60). Emerald Publishing. https://doi.org/10.1108/978-1-80043-095-220201005
Patel, N. B. (2018). A Study of Forensic Accounting: A Useful Tool to Combat Fraud. Research Review Journals, 3(6), 56–58.
Poss, J. E. (2001). Developing a New Model for Cross-Cultural Research: Synthesizing the Health Belief Model and the Theory of Reasoned Action. ANS Advances in Nursing Science, 23(4), 1–15. https://doi.org/10.1097/00012272-200106000-00002
Quaddus, M., & Hofmeyer, G. (2005). An Investigation Into the Factors Influencing the Adoption of B2B Trading Exchanges in Small Businesses in Western Australia. Proceedings of the 9th Pacific Asia Conference on Information Systems: IT and Value Creation, PACIS. Retrieved from
Raats, M. M., Shepherd, R., & Sparks, P. (1995). Including Moral Dimensions of Choice Within the Structure of the Theory of Planned Behavior. Journal of Applied Social Psychology, 25(6), 484–494. https://doi.org/10.1111/j.1559-1816.1995.tb01763.x
Rashid, M., Khan, N. U., Riaz, U., & Burton, B. (2023). Auditors' Perspectives on Financial Fraud in Pakistan – Audacity and the Need for Legitimacy. Journal of Accounting in Emerging Economies, 13(1), 167–194. https://doi.org/10.1108/JAEE-04-2021-0135
Rathnasiri, U. A. H. A., & Bandara, R. M. S. (2018). The Forensic Accounting in Sri Lanka: Perception of Professional Accountants. Kelaniya Journal of Management, 6(2), 68–82. https://doi.org/10.4038/kjm.v6i2.7546
Rehman, A., & Hashim, F. (2020). Can Forensic Accounting Impact Sustainable Corporate Governance? Corporate Governance: The International Journal of Business in Society, 21(1), 212–227. https://doi.org/10.1108/CG-06-2020-0269
Roden, J. (2004). Revisiting the Health Belief Model: Nurses Applying it to Young Families and Their Health Promotion Needs. Nursing & Health Sciences, 6(1), 1–10. https://doi.org/10.1111/j.1442-2018.2003.00167.x
Rollo, S., Gaston, A., & Prapavessis, H. (2017). Cognitive and Motivational Factors Associated with Sedentary Behavior: A Systematic Review. AIMS Public Health, 3(4), 956–984. https://doi.org/10.3934/publichealth.2016.4.956
Rosenberg, D. E., Bull, F. C., Marshall, A. L., Sallis, J. F., & Bauman, A. E. (2008). Assessment of Sedentary Behavior with the International Physical Activity Questionnaire. Journal of Physical Activity & Health, 5(1), 30–44. https://doi.org/10.1123/jpah.5.s1.s30
Rosenstock, I. M. (1974). The Health Belief Model and Preventive Health Behavior. Health Education Monographs, 2(4), 354–386. https://doi.org/10.1177/109019817400200405
Rosenstock, I. M., Strecher, V. J., & Becker, M. H. (1994). The Health Belief Model and HIV Risk Behavior Change. In R. J. DiClemente & J. L. Peterson (Eds.), Preventing AIDS: Theories and methods of behavioral interventions (pp. 5–24). Springer. https://doi.org/10.1007/978-1-4899-1193-3_2
Shah, N. K. (2020). Forensic Accounting: An Overview in Indian Context. Gap Gyan: A Global Journal of Social Sciences, 3(4), 36–47. https://doi.org/10.47968/gapgyan.34006
Shevlin, M., & Miles, J. N. V. (1998). Effects of Sample Size, Model Specification and Factor Loadings on the GFI in Confirmatory Factor Analysis. Personality and Individual Differences, 25(1), 85–90. https://doi.org/10.1016/S0191-8869(98)00055-5
Silverstone, H., Sheetz, M., Pedneault, S., & Rudewicz, F. (2012). Forensic Accounting and Fraud Investigation. John Wiley & Sons. https://doi.org/10.1002/9781119200635
Tabachnick, B. G., & Fidell, L. S. (2007). Using Multivariate Statistics (5th ed.). Allyn & Bacon/Pearson Education.
Thompson, N. J., & Thompson, K. E. (1996). Reasoned Action Theory: An Application to Alcohol‐Free Beer. Journal of Marketing Practice: Applied Marketing Science, 2(2), 35–48. https://doi.org/10.1108/EUM0000000000020
Waghray, R. B. (2018). Forensic Accounting in India. International Journal of Engineering Technology Science and Research, 5(1), 1–8.
Wei, N. S., Tazilah, M. D. A. B. K., Yen, S. S., Yee, C. H., Ying, S. W., & Jing, T. S. (2017). Behavioral Intention to Use Forensic Accounting Services Among Small and Medium Enterprises in Malaysia. Eastern European Business and Economics Journal, 3(4), 306–349.
Yu, S. J., & Rha, J. S. (2021). Research Trends in Accounting Fraud Using Network Analysis. Sustainability, 13(10), Article 5579. https://doi.org/10.3390/su13105579
Zainal, S. F., Hashim, H. A., Ariff, A. M., & Salleh, Z. (2022). Research on Fraud: An Overview from Small Medium Enterprises (SMEs). Journal of Financial Crime, 29(4), 1283–1296. https://doi.org/10.1108/JFC-09-2021-0205
 This work is licensed under a: Creative Commons Attribution 4.0 International License
© Granthaalayah 2014-2025. All Rights Reserved.