Impact of Urbanization in Ekamra Kshetra, Odisha: Parametric Analysis of variations
Gayatri Mukherjee 1![]()
![]() ,
Madhumita Roy 2
,
Madhumita Roy 2![]()
![]() , Sourovee
Dutta 3
, Sourovee
Dutta 3![]()
![]()
1 Research Scholar,
Jadavpur University, Kolkata, India
2 Professor,
Department of Architecture, Jadavpur
University, Kolkata, India
3 Assistant Professor, Department of Architecture, National Institute
of Technology Hamirpur (H.P.) India
|
|
|
ABSTRACT |
|
|
Urbanization
is a complex mechanism of development of spaces which have adversely affected
the historic towns in India. Ekamra Kshetra,
Bhubaneswar is one such historic settlement dating back to the 12th century
CE. The settlement has been dotted with several temples built across the 12th
to 18th century by the various dynasties who ruled Odisha and Ekamra Kshetra was considered as a pious religious centre with the settlements developed around the temples.
With the transformation of Bhubaneswar into a modern planned city of
independent India, in 1948, the original planned city was planned earmarking
the historic part as a separate entity with minimal effect of urban sprawl.
However, with the advent of industries and population explosion in
Bhubaneswar, especially after the 1980s, the historic part of the city has
been at the receiving end of rapid urban sprawl, with massive modern
constructions which have severely affected the original spatial nature and
eventually the historic fabric of the Ekamra
Kshetra has been lost. This paper attempts to undertake an analysis of these change in the historic fabric through definition of
various parameters following a detailed visual survey of a selected area in Ekamra Kshetra. Based on the findings, a regression and
ordinal analysis was undertaken to understand the calculate the likelihood of
change in the original fabric of the historic town. |
|||
|
Received 12 May 2025 Accepted 15 June 2025 Published 31 July 2025 Corresponding Author Gayatri
Mukherjee, argayatri@gmail.com DOI 10.29121/granthaalayah.v13.i7.2025.6276 Funding: This research
received no specific grant from any funding agency in the public, commercial,
or not-for-profit sectors. Copyright: © 2025 The
Author(s). This work is licensed under a Creative Commons
Attribution 4.0 International License. With the
license CC-BY, authors retain the copyright, allowing anyone to download,
reuse, re-print, modify, distribute, and/or copy their contribution. The work
must be properly attributed to its author.
|
|||
|
Keywords: Ekamra Kshetra,
Urbanization, Built Heritage, Historic Settlements |
|||
1. INTRODUCTION
As one of the world's fastest-developing nations, India grapples with the impact of progress on its ancient urban centers. Cities like Banaras, Prayagraj, Madurai, Mahabalipuram, Kolkata, Patna, and Delhi are living testaments to centuries of history and transformation. However, urban development in these historic locations, especially in recent decades, has caused them to grow into sprawling metropolises. This rapid expansion often sacrifices the distinctive qualities that once defined these urban cores, causing the rich history of many ancient cities to fade under the pressures of modern development Praharaj (2012). Our cities are slowly losing their heritage, with many historically significant zones now in disrepair. Originally, diverse religious and socio-cultural practices led to the creation of various sacred structures and their surrounding settlements. Over time, temples became central to civic and social life. These religious precincts in temple towns weren't just places of worship; they also served as cultural and philosophical hubs, actively boosting the city's economy through retail and commercial activities. Rajakumari and Sivakumar (2019) Odisha boasts a rich and diverse cultural heritage, evidenced by its Hindu, Buddhist, and Jain sculptures. References to Kalinga and Odra, ancient names for the region, appear as early as the Mahabharata Das (2019). The capital city of Bhubaneswar gets its name from Lord Shiva, its presiding deity, who is known as "Tribhuvaneswara"—meaning "The Lord of the three worlds." This name was popularly shortened to Bhubaneswar, giving the city its identity. As a significant religious hub, the temple town was also famously called "Ekamra Kshetra." According to legends, its sanctity originates from a time when a single mango tree stood over a Shivalinga. This religious center developed around that spot, culminating in the 11th-century Lingaraja Temple. This fully established Ekamra Kshetra as a major center of Saivism (Shiva culture). Despite centuries of change, Bhubaneswar remains a vibrant pilgrimage destination in Odisha Mishra (1989). The remains of Ekamra Kshetra — including Buddhist, Jain, and Hindu monuments spanning from Sishupalgarh Fort to the Khandagiri caves — still provide rich historical evidence. Ancient ponds and water bodies, crucial to Odishan societal traditions, are also present alongside the temples. These monumental developments suggest the historical formation of 'Asta-ayatana' (eight sacred complexes), strategically located based on geography. Regrettably, modern urban planning has entirely ignored these vital elements, effectively erasing the social and religious contours of this historic settlement. To effectively preserve our heritage buildings, we must identify what obstructs the continuity of their heritage values. This study of Ekamra Kshetra integrates historical and modern urban strategies, introduces a conceptual framework. This framework aims to analyse urbanization's impact on built heritage for offering practical guidelines to prevent unplanned, haphazard, and unnecessary alterations to historic buildings within the town's older areas. Ultimately, it's vital to revive the lost heritage essence and identity of urban historical centers from the damaging effects of urbanization. To achieve the objective of this study, key performance indicators/parameters were identified using secondary resources. The identified parameters are. Height of the building Lourenço (2013), Existing treatment of the façade Menon (2014), Category (use) of the building Mekonnen et al. (2022), Material used for construction Huq and Bhattacharya (2024), Construction technology used (RCC or Load bearing structure) Menon (2014), Footprint of the structure Attarian et al. (2022), Tentative year of construction Chen & Shen (2020), Floor to floor height as visible Attarian et al. (2022), Approximate size of the plot Lourenço (2013), Aspect ratio of the building (front width: side depth) Huq and Bhattacharya (2024), Any other significant observation Mekonnen et al. (2022). Based on these parameters, a comprehensive visual survey was conducted over three months. During this period, every street in the selected study area was visited, and all abutting houses were documented. In total, over 450 structures were surveyed.
2. Literature Study
Urbanization is the process by which a society becomes more urbanized, meaning a greater proportion of its population lives in towns and cities rather than in rural areas. It's a fundamental shift that brings about profound changes in a country's economic, social, cultural, and environmental landscape Davis (1965). Kiruthiga and Tamil (2019) in their the study provides empirical evidence of how the multifaceted process of urbanization can erode the historical integrity of places like Kumbakonam. It then offers a concrete and urgent policy recommendation for local authorities to mitigate these negative impacts and safeguard cultural heritage through structured planning. Sasidhar and Narayanasamy (2021) in their study provide crucial empirical evidence for the specific ways in which urbanization, particularly driven by commercial tourism, poses a direct threat to the tangible and intangible heritage of historic towns like Kanchipuram in India. The detailed observations, from land-use changes to the dramatic alteration of the skyline, underscore the urgency of implementing effective heritage conservation and urban planning strategies to balance development with the preservation of cultural identity. Chandan (2019) provide a valuable macro-level perspective and policy advocacy for integrating heritage conservation firmly into the core of India's urban planning efforts, particularly for its vulnerable pilgrim cities. Gupta (2024) offer a crucial perspective on how globalization, by altering the nature of religious tourism, poses a significant threat to the authenticity and sacredness of places like Vrindavan, underscoring the urgent need for robust regulatory measures to preserve their unique spiritual and historical identity. Vishaliny and Krishnan (2024) provide an insightful look into the challenges confronting Srirangam and, by extension, other Indian temple towns, advocating for integrated, innovative, and sustainable solutions to preserve their invaluable heritage.The study by Udeaja et al. (2020) on Surat, India, provides a critical perspective on the systemic issues affecting urban heritage in the country. It provides a strong argument that the challenges faced by India's historic urban areas are not merely localized issues but stem from a broader policy and planning vacuum. Their work underscores the urgent need for a fundamental reorientation of urban planning to prioritize heritage conservation and empower robust regulatory frameworks.
3. Research Methodology
This research adopt a visual survey method after enumerating the parameters. Based on the parameters, a key information indicator is prepared for detailed study of the each of the structures in the selected study area. After collection of data, the information is put together to prepare a chart. Based on the chart, a coding is developed to analyse the level of change viz., nominal, medium and significant. Based on these coding, the results are segregated and then model for regression and ordinal study in statistical methods are adopted to determine the level of change.
3.1. Study Area
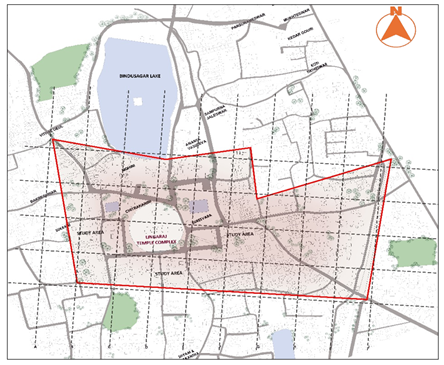
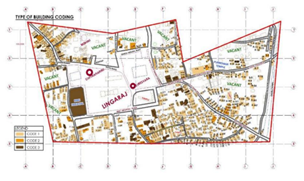
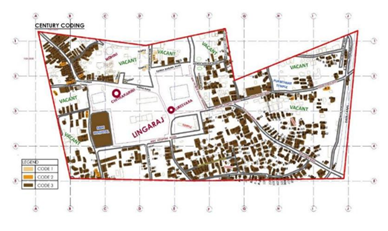
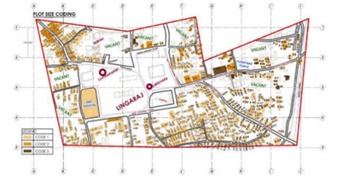
The Ekamra Kshetra – a settlement originated in the 12th century, which contained the Lingaraj Temple, Bindusagar and other significant temples was chosen as the study area. As indicated in Figure 1, an area covering over 3 lakhs square metres, encircling four significant temples – the Lingaraj, Chitrakarini, Mohini and Suresvara was considered for a detailed visual site survey. Significant lake,water tanks & Temples such as Bindusagar, Ananta Basudev etc are in the immediate vicinity of the selected area & effect the activities of the area to a great extent. Parameters of morphology were shortlisted and accordingly a set of analytical questions was prepared for the survey. To further corroborate the study, a set of questionnaires was prepared for response from various users which included users, residents and subject matter experts. The selected area as shown in Figure 1, contains a rich concentration of historically and culturally significant landmarks. It includes the renowned Lingaraj Temple, Suresvara Temple, Mohini Temple, Chitrakarini Temple and the Papanasini Tank, each of which holds immense religious and architectural importance. Additionally, the site is situated in close proximity to other key heritage structures such as the Ananta Basudeb Temple and the Bindusagar Lake, creating a unique cluster of sacred monuments and water bodies. Together, these elements form the core of the ancient human settlement known as Ekamra Kshetra, which has been a focal point of spiritual and social life for centuries. Over time, this area has seen significant development, reflecting its continuous relevance and vitality across different historical periods. Recognizing its cultural and historical value, several initiatives have already been undertaken, and more are being proposed, aimed at the conservation, restoration, and sustainable development of this heritage zone to ensure it’s preservation for future generations. Following the completion of the detailed visual survey of populated area, the inputs were carefully studied and outcomes were analysed to demarcate, highlight the key issues which needs to be addressed. The visual study was then analysed based on ordinal methodology to determine the extent of change or the impact of urban in correlation to the selected parameters. The following part of this paper provides an in-depth assessment conducted of the analysis for each parameters mentioned above.
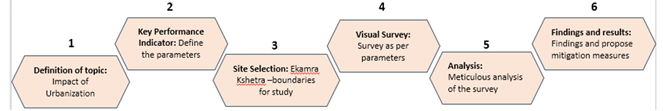
Figure 1
|
Figure 1 Study Area and its vicinity; Source Bhubaneswar CDP 2011 |
4. Analysis AND Discussion
1) Building
height
This parameter was selected to identify the quantum of changes in building height across the surveyed buildings, in order to assess whether the impact of urbanization is directly proportional to the number of taller buildings observed. It is important to note that in this ordinal regression model, the building height is not in the form of categories but as numerical values denoting actual height of the building.
Figure 2
|
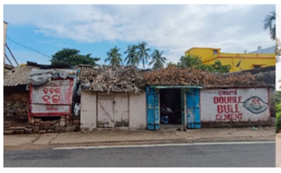
Figure 2 up to 3m |
Figure 3
|
Figure 3 3.1-6m |
Figure 4
|
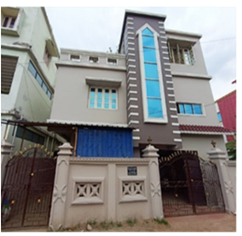
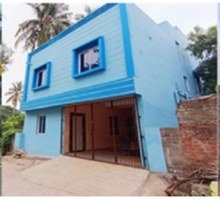
Figure 4 6.1 & above |
As mentioned in the Figure 2,Figure 3,Figure 4 the building height has been classified into 3 category - (1) up to 3m (2) 3.1– 6m (3) 6.1 & above. This is a simple classification of buildings based on their height, which can help in understanding the urban structure or development pattern of an area. Up to 3 meters category are low-rise buildings or single-storey structures. Usually just the ground floor. These are found in traditional residential areas or small shops. 3.1 to 6 meters category buildings typically have two storeys — Ground + One Floor (G+1). Slightly taller than the first category. These are found in moderately developed areas or expanded homes. The 6.1 meters and above category are multi-storeyed or high-rise buildings (G+2 and more). Often found in urban or commercial areas where space is limited, so people build vertically. These may include apartments, offices, or hotels. Figure 6 represents the building heights on the map.
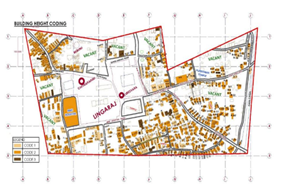
Figure 5
|
Figure 5 Building Height Colour Coded in Map |
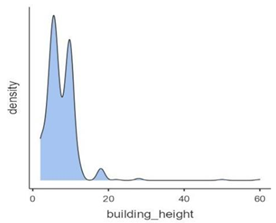
Table 1
|
Table 1 Frequency Distribution and Density Plot of Building Height |
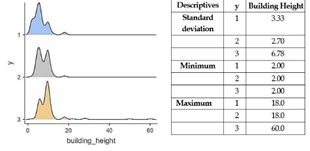
Table 2
|
Table 2 Frequency Distribution and Density Plot of Building Height (X1) for Different Build Categories 1,2 And 3 |
Observation: The above analysis Table 1 and Table 2 determines that the buildings heights are mostly concentrated within the 20 metres category. The standard deviation determines 6.78 metres, a maximum of 2.00metres and maximum of 60 metres of the building height.
Based on this, a regression model to determine the likelihood of change in the was undertaken. The frequency distribution model gave the following graph Table 3.
Table 3
|
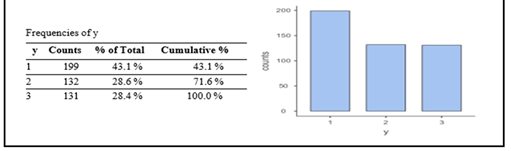
Table 3 Frequency Distribution of the Dependent Variable Y (the Level of Architectural Changes) with the Bar Plot |
Observation: Based on the graph and the category wise mean building heights for build categories 1,2 and 3, it is determined that buildings with lesser height less likely to have undergone architectural changes as compared to the buildings with greater height.
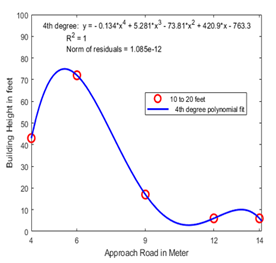
A comparative analysis of building height with respect to the approach road was also undertaken to determine the effect of road width on the height of the building. This was done to understand the effect of urbanisation on buildings.
Observation: The graph Figure 5 shows a relationship between road width and building height. It suggests that narrower roads tend to have higher building heights with higher population density, i.e., more people live in these areas. More buildings or closely spaced buildings exist. This is commonly observed in older parts of cities, like areas around temples or historical centers, where roads were originally designed to be narrow. Over time, these areas become more crowded due to urban growth and lack of space. The older "temple roads" are now densely populated and have more tightly packed buildings compared to newer, wider roads. In a gist, older areas are characterized with narrow roads now and have buildings with higher building heights.
Figure 6
|
Figure 6 Building Height in Relation to Approach Road |
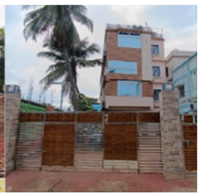
2) Storey
This parameter was selected to identify the quantum of changes in building storey across the surveyed buildings, in order to assess whether the impact of urbanization is directly proportional to the number of storeys. It is important to note that in our ordinal regression model, we did not include the form of categories but actual no. of storeys.
This refers to the number of levels or floors in a building. As seen in Figure 7,Figure 8 and Figure 9, the storeys can be classified into 3 categories. The buildings can be grouped into three types based on the height from the ground to the top of the structure. (1) Ground Floor - it usually means the building has only one level. These are called Ground storeyed buildings. (2) Ground Floor + First Floor - it typically includes two levels. These buildings are slightly taller than single-storey buildings. (3) Ground Floor + 2 or more floors - the building usually has G+2, G+3, etc. This category includes multi-storey and high-rise buildings.
Figure 7
|
Figure 7 Ground Floor |
Figure 8
|
Figure 8 G+1 |
Figure 9
|
Figure 9 G+2 or more |
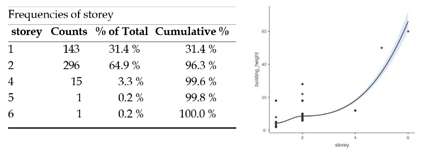
Table 4
|
Table 4 Frequency Distribution of Storey (X2) Which is a Ratio Variable |
Observation: Based on the graph as shown in Table 4, the two independents variable storey and building heights are related and if one increases, the other one also increases.
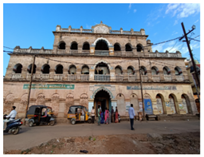
3) Facade
Treatment
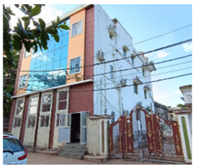
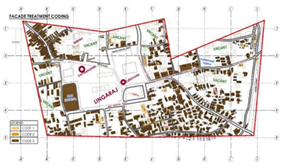
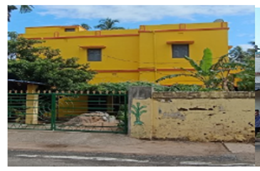
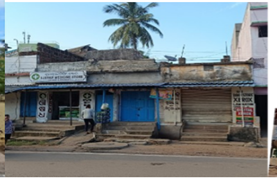
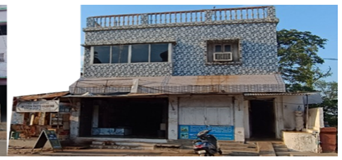
This parameter was selected to identify the quantum of changes that have occurred in the façade treatment of the building surveyed so as to understand if the impact of urbanization is directly proportional to the change in the number of built facades of the buildings. In this parameter, the structures are categorized based on the treatment of the facades as indicated in Figure 10,Figure 11 and Figure 12. In this case, (1) Classical represents facades which historically existed during the 19th and 20th century. These typically contained terracotta tiled roof brick walls and generally rose up to the maximum of G+1. (2) Colonial facades represent structures with exposed stone or brick walls with modern slope roofing such as asbestos, CGI sheets, etc. They rose up to a maximum of G+2. (3) Contemporary façade represents modern structures built since the formation of new capital of Bhubaneswar in 1951. Cement, steel, RCC, glass etc., are prime components of this particular façade treatment. Figure 13 represents the façade treatment categorised on the map.
Figure 10
|
Figure 10 Classical |
Figure 11
|
Figure 11 Colonial |
Figure 12
|
Figure 12
Contemporary |
Figure 13
|
Figure 13 Façade Treatment
Colour Coded on Map |
Table 5
|
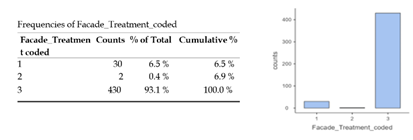
Table 5 Facade Treatment Coded Frequency Distribution and Bar Chart |
Observation: As per the modelling shown in Table 5, the category 2 – colonial buildings have only a handful structures which indicate that there has been minimal impact of colonization in this area.
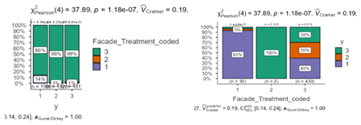
To understand the level of change that have occurred in the studied buildings, a correlation model (Pearson co-efficient and Cramer’s V) was studied to determine the distribution of façade treatment over the years and how likely it has changed over the years.
Table 6
|
Table 6 Distribution of Facade Treatment According to Y=1,2,3 and Distribution of Y According to Facade Treatment |
Observation: This graph above as shown in Table 6, determines that classical facade type (1) is likely to have the least architectural changes and buildings which have contemporary facade (3) is likely to have medium architectural changes, and buildings with colonial façade (2) is likely to have maximum architectural changes.
4) Types
of building
The type of building will help in determining the probability of change due to urbanization. In this parameter as shown in Figure 14,Figure 15 and Figure 16, the structures are categorized based on the types of building based on their usage. In this parameter (1) Residential category represents structures which are used typically for residential purpose. This includes both owned and rented houses of all sizes and heights. (2) Commercial category comprises of structures used for shops, public institutions, community centres or any building used for any commercial purpose. (3) Mixed category represents structures which have both commercial and residential usage. This can be a shop cum residence, shopping complex at ground level and residences above etc. The building are categorised on the selected area map as shown in Figure 17.
Figure 14
|
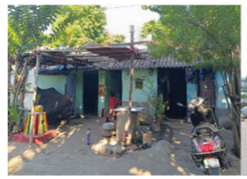
Figure 14 Residential |
Figure 15
|
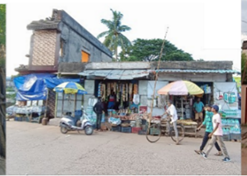
Figure 15 Commercial |
Figure 16
|
Figure 16 Mixed |
Figure 17
|
Figure 17 Type of Building
Colour Coded on Map |
Table 7
|
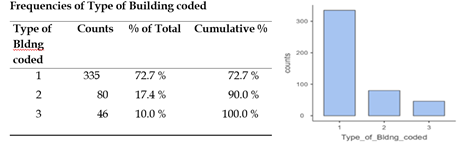
Table 7 Type of Building Coded Frequency Distribution and Bar Chart |
Observation: As per the model shown in Table 7, category 1, residential buildings are mostly present in the area. However, it is to be noted that many of these residential buildings actually are provided on rental basis to people without notice of authorities.
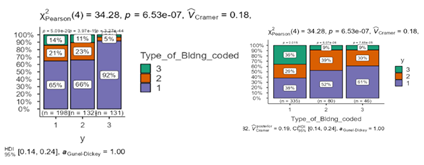
To understand the level of change that have occurred in the studied buildings, a correlation model (Pearson co-efficient and Cramer’s V) was studied to determine the distribution of type of buildings over the years and how likely it has changed over the years.
Table 8
|
Table 8 Distribution of Building Type According To Y=1,2,3 And Distribution of Y According to Building Types |
Observation: Based on the graph as shown in Table 8, it is ascertained that Residential cum shop buildings are likely to have least architectural changes. Buildings which are commercial they are more likely to have more architectural changes. Only residential buildings are the one with maximum architectural changes.
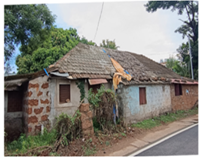
5) Material
Used
This parameter was selected to identify the quantum of changes occurred into the materials used of the building surveyed so as to understand the impact of Urbanization if directly proportional to the changed no.of materials used in the buildings.
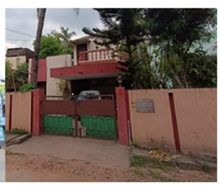
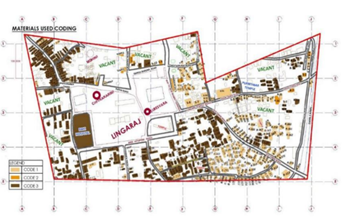
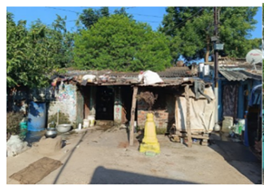
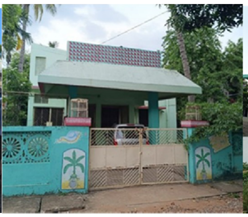
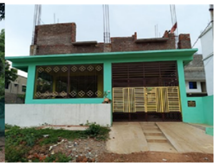
The structures are categorized based on the materials used in the buildings as represented in Figure 18,Figure 19and Figure 20. In this case (1) Temporary represents materials like Polythene and brick exposed, Bamboo framing & sheet, Brick, cement and Asbestos sheet roof, etc. (2) Historic/Traditional; facades represent structures with Brick, cement and tiled roof, Brick, Stone, sand etc. (3) Modern represents Cement plaster, steel, RCC, glass etc. Which are prime components of this particular façade treatment. Figure 21 indicates material used coded on the site map.
Figure 18
|
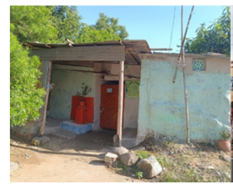
Figure 18 Temporary |
Figure 19
|
Figure 19 Historic |
Figure 20
|
Figure 20
Modern |
Figure 21
|
Figure 21 Material Used Coded on
Map |
Table 9
|
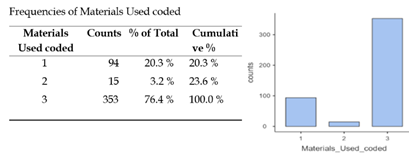
Table 9 Materials Used Coded Frequency Distribution and Bar Chart |
Observation: As per Table 9, the historic materials are used in only a handful of structures indicating many have vanished eventually. Most of the buildings have used modern materials and some significant number of temporary structures are also present.
To understand the level of change that have occurred in the studied buildings, a correlation model (Pearson co-efficient and Cramer’s V) was studied to determine the Distribution of materials used over the years and how likely it has changed over the years.
Table 10
|
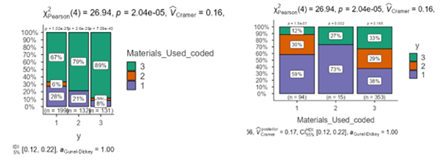
Table 10 Distribution of Materials Used According To Y=1,2,3 and Distribution of Y According to Materials Used |
Observation: The graph shown in Table 10 represents that building with material type 2 which is historic is likely to have least architectural changes. Building with material type 1 which is temporary is likely to have medium architectural changes and building with material type 3 which is modern is likely to have high architectural changes.
6) Technology
Used
This parameter was selected to identify the quantum of changes in construction technology across the surveyed buildings, in order to assess whether the impact of urbanization is directly proportional to the shift in building technologies.
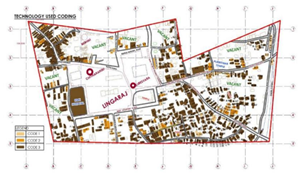
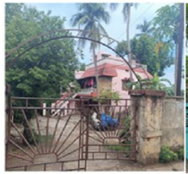
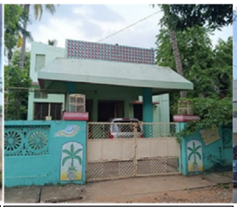
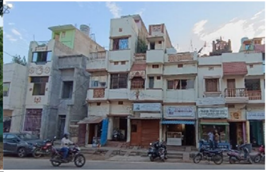
This parameter represents the various kinds of technology and techniques used for construction of the identified structures as shown in Figure 22,Figure 23, and Figure 24. The structures are classified into (1) Temporary category represents makeshift arrangements. (2) Load Bearing category represents structures built in traditional load bearing technology which was used before the propagation of RCC and steel structures. This category represents a mix of both historic and contemporary structures. (3) Column/framed technology represents structures built using RCC and steel. This is the modern technology which represents modern era technologies. Figure 25 represents the spread of technology used distributed on a map.
Figure 22
|
Figure 22 Temporary |
Figure 23
|
Figure 23 Load bearing |
Figure 24
|
Figure 24 Framed |
Figure 25
|
Figure 25 Technology Used
Coded on Map |
Table 11
|
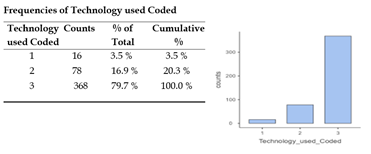
Table 11 Technology Used Coded Frequency Distribution and Bar Chart |
Observation: Based on the model given in Table 11, it is determined that major structures in the survey area have used column and framed structure technology. This is modernist and have undergone major/significant change from the traditional load bearing technology. This indicates that urbanization has severely affected traditional technology with almost 80% structures using column framed structure.
7) Ground
Coverage
This parameter will help in understanding the change in building pattern which was relating it to urbanization. It is important to note that although ground coverage is categorized as above for exploratory analysis, while carrying out the ordinal regression we incorporate them as the actual numerical values.
It analyses data of the ground area covered under construction with reference to the plot size. As represented in Figure 26,Figure 27 and Figure 28 (1) 0-20% represents coverage of upto 1/5th of the plot size. (2) 20%-50%represents buildings which covers up to half of the plot size. (3) 50% represents coverage above half of the plot area. The spread of ground cover is represented on a map in Figure 29
Figure 26
|
Figure 26 0-20% |
Figure 27
|
Figure 27 20-50% |
Figure 28
|
Figure 28 50% above |
Figure 29
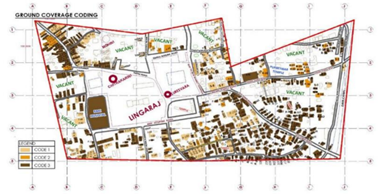
|
Figure 29 Ground Coverage Coded on Map |
Table 12
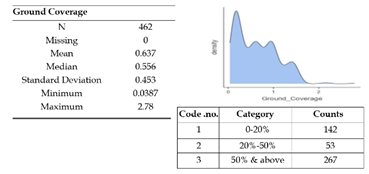
|
Table 12 Frequency Distribution and Density Plot of Ground Coverage (X7) Which is a Ratio Variable |
Observation: As per the analysis derived in Table 12, 57% of the houses have larger ground coverage indicating an adverse effect of urbanization. Buildings with less ground coverage have not been majorly affected by urbanization yet and are more likely to change with eventual urban progress.
8) Year
of Construction
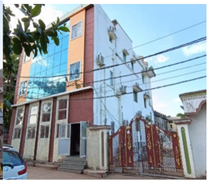
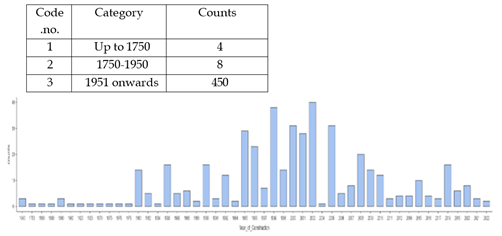
The construction year parameter will help in determining the factors which guided the construction. As represented in Figure 30, Figure 31 and Figure 32, the classification are (1) Upto 1750 represents structures which were built before any major British intervention in Odisha wherein the traditional architecture was prevalent (2) 1750 -1950 was predominantly the British era and any construction of this period had it’s significant influence. (3) 1951 onwards represent the construction post the establishment of a new capital, transforming from temple city to capital city. It is important to note that year of construction is categorized as above for exploratory analysis, but for carrying out the ordinal regression we incorporate them as the actual numerical values of the year. Year of construction is also mapped as shown on Figure 33.
Figure 30
|
Figure 30 Upto 1750 |
Figure 31
|
Figure 31 1750 - 1950 |
Figure 32
|
Figure 32 1951 onwards |
Figure 33
|
Figure 33 Year of Construction
Coded on Map |
Table 13
|
Table 13 Frequency Distribution and Bar Chart of year of Construction (x8) which is a Ratio Variable |
Observation: Based on Table 13, major construction have been undertaken since 1950. This is when the temple city transformed into capital city and urbanized rapidly. Only few remains of houses/structures built before 1950’s remain.
9) Floor
to Floor height
This parameter was selected to identify the changes in building construction styles which have been altered due to urbanization. It is important to note that although floor to floor height is categorized as above for exploratory analysis, while carrying out the ordinal regression we incorporate them as the actual numerical values in metres.
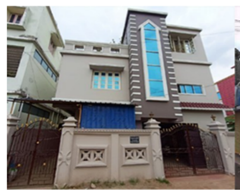
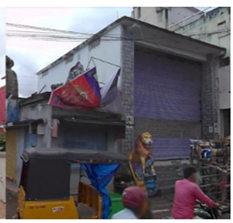
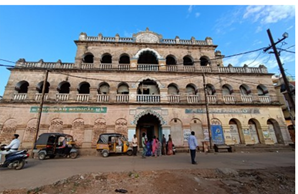
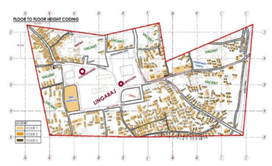
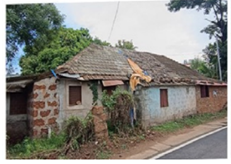
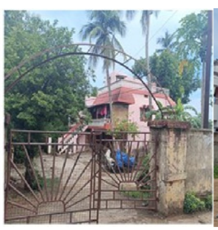
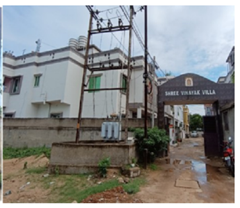
This parameter determines the difference between floors in a building. As shown in Figure 34,Figure 35 and Figure 36 case (1) Up to 3m represents modern houses built after 2000 (2) 3.1-6m represent middle aged structures which used to have greater heights as was the trend of that period of construction. It also represents modern non-residential structures. (3) 6.1 & above represents older structures which had greater Floor to Floor heights - generally used in traditional houses, palatial buildings and temples. Figure 37 represents this categorization on map.
Figure 34
|
Figure 34 Upto 3 mtr |
Figure 35
|
Figure 35 3.1 to 6 m |
Figure 36
|
Figure 36 6.1 m above |
Figure 37
|
Figure 37 Floor to Floor Height Coding on Map |
Table 14
|
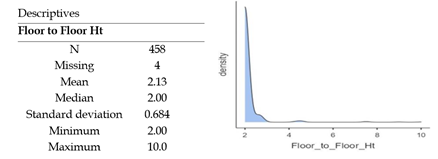
Table 14 Frequency Distribution and Frequency Density of Floor to Floor (x9) which is a Ratio Variable |
Table 15
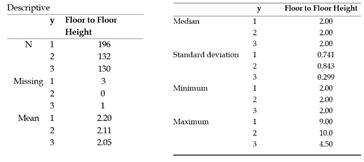
|
Table 15 Distribution of Floor to Floor Height According to y=1,2,3 |
Observation: The graph in Table 14 and Table 15 represents if floor to floor height increases then it is less likely to have architectural change and if floor to floor height decreases then it is more likely to have architectural changes. The ordinal regression model that we shall describe later suggests modern building with smaller floor to floor height are less likely to change since they have already been impacted.it is very likely that structures with greater floor to floor height will fall into the effects of urbanization and there will be a change in its character.
10) Plot Size
This parameter was selected to understand the eventual changes of the plot size with the advent of urbanization. As shown in Figure 38, Figure 39 and Figure 40, case (1) 0-100sqm represent plots which have become small eventually due to division of land caused by urbanization. (2) 101-300sqm represents plots from the 20th century (3) 301 sqm & above represents older plots. Group housing plots can also be attributed to this category. In the ordinal regression we incorporate plot size as the actual numerical values, and not as categories. Figure 41 shows the classification on the site map.
Figure 38
|
Figure 38 0-100 sqm |
Figure 39
|
Figure 39 101-300 sqm |
Figure 40
|
Figure 40 300 sqm above |
Figure 41
|
Figure 41 Plot Size Coded on Map |
Table 16
|
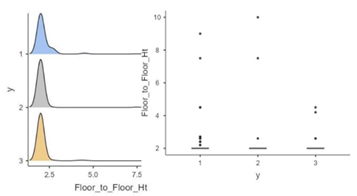
Table 16 Density Plots and Box-Plots for Floor-to-Floor Height of Buildings Falling in Category y=1, y=2 and y=3 |
Table 17
|
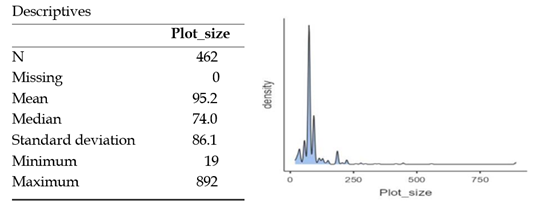
Table 17 Frequency Distribution and Frequency Density of plot Size (x10) which is a Ratio Variable |
Observation: From Table 16 and Table 17, it can be analysed that majority of the plots have eventually been divided into fragments. This is an outcome of rapid urbanization changing the original larger plots which would have been the original character of Ekamrakshtra. The bigger plots are highly likely to get further change or divided into smaller plots due to rapid urbanization.
11) Aspect
Ratio
This parameter was selected to identify the quantum of changes in the aspect ratio of the surveyed buildings, in order to understand whether the impact of urbanization is directly proportional to the number of altered aspect ratios. In the ordinal regression we incorporate aspect ratio as the actual numerical value, and not as categories.
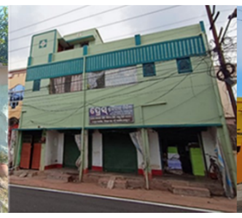
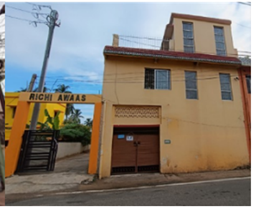
This parameter was selected to study the depth of the plot sizes with respect to it’s frontage. As shown in Figure 42, Figure 43 and Figure 44, case (1) Above 1-represents plots which are older and thus have front width. (2) 0.5- 1-This represents plots which have undergone limited partitions. (3) less than 0.5-It represents plots which have been affected by urbanization & population growth. Figure 45 represents the aspect ratio earmarked on map.
Figure 42
|
Figure 42 Above 1 |
Figure 43
|
Figure 43 0.5 - 1 |
Figure 44
|
Figure 44 less than 0.5 |
Figure 45
|
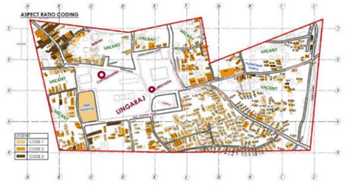
Figure 45 Aspect Ratio Coding
on Map |
Table 18
|
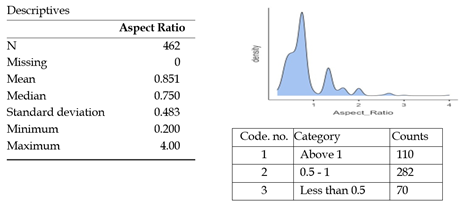
Table 18 Frequency Distribution and Frequency Density of Aspect-Ratio (X11) Which Is a Ratio Variable |
Observation: Table 18 suggests that aspect ratio of the plots have significantly changed from wider frontage to narrower frontage. This suggests division of plots in perpendicular to the access roads due to urbanization. There has been a noteworthy change in the original aspect ratio where the frontage of the plots would have been greater than the depth.
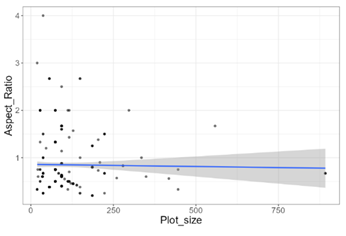
A linear regression as shown in Table 19, in corelation with plot size was undertaken to determine any relationship of aspect ratio with plot size. The details of the findings are as below.
Table 19
|
Table 19 Linear Regression of Aspect Ratio on Plot Size |
Observation: Table 19 suggests that there is no significant relation between plot size and aspect ratio as the correlation is weak. Thus, irrespective of the plot size, there has been a change in the aspect ratio. Ideally, the plot size and the aspect ratio should be inter-related in-case of a planned growth. This indicates there has been very little consideration of setbacks and offsets while the new buildings have been constructed. This shows a severe impact of urbanization.
12) Other
Correlation models
Similar to the aspect ratio and plot size, there were other correlations which were also explored to analyse the inter-relationships between the parameters to determine the analyse and determine the effect of urbanization on the temple town of Ekamra Kshetra. Detailed analysis is outlined in the following matters.
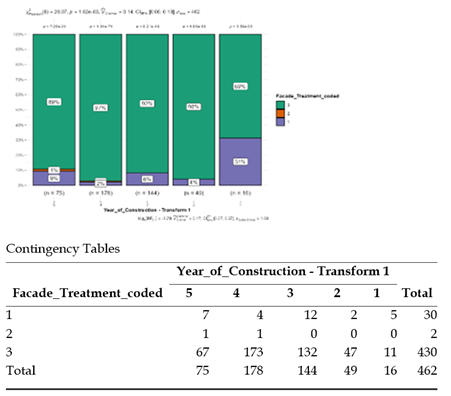
Façade treatment with the year of construction
To understand the change in the façade over the centuries or specifically the façade treatment before and after the creation of the capital city, there was a correlation model created to analyse the change.
To determine this, the year of construction was categorized into 5 categories 1040-1979 1; 1980-1989 2; 1990-1999 3; 2000-2009 4; 2009-2022 5
As shown in Table 20, we checked how the facade treatment type changes along the different year of construction categories 1,2,3,4 and 5.
Table 20
|
Table 20 Correlation of façade Treatment with year of Construction |
Observation: As evident from the Table 20 contingency tables, façade treatment has been directly affected by the year of construction. There is a significant change to the category 1 façade – classical façade (31%). This trend developed majorly since the 1980s when industrial growth commenced in Odisha and Bhubaneswar gained attention with opening of offices in Odisha.
5. Key Findings from the model analysis
Table 21
|
Table 21 Summary of variables |
||||
|
Variable |
Symbol |
Description |
Unit/scale of measurement |
Highest level of change (%) |
|
Dependent Variable - Change in built heritage |
Y |
The likelihood of modification made in each building
surveyed |
Measurement converted into ordinal values |
|
|
Building height |
X1 |
Height of the building surveyed |
Upto 3 metres, 3.1
to 6metres, 6.1 and above |
43.10% |
|
Storeys |
X2 |
The number of storeyes of
each building |
Ground, G+1, G+2 or more. |
64.90% |
|
Façade treatment |
X3 |
Description of the nature of façade treatment |
Classic, colonial, contemporary. |
93.10% |
|
Type of building |
X4 |
The nature of the use of the building |
Residential, Commercial, Mixed. |
72.70% |
|
Material Used |
X5 |
Variety of material used |
Temporary, historic, modern. |
76.40% |
|
Technology Used |
X6 |
Technology used for construction of the building |
Temporary, load bearing, framed. |
79.70% |
|
Ground Coverage |
X7 |
Coverage of ground by the building in respect to the
plot size |
Percentage. |
57.70% |
|
Year of Construction |
X8 |
Depicts the tentative year of construction of the
building |
Upto 1750,
1750 -1950, 1951 onwards. |
97.40% |
|
Floor to floor height |
X9 |
Depicts the height of each floor. |
Upto 3 metres, 3.1
to 6metres, 6.1 and above. |
42.40% |
|
Plot Size |
X10 |
Describes the area of each plot |
Upto 100
sqm, 101 -300 sqm, 301 sqm and above. |
28.60% |
|
Aspect Ratio |
X11 |
The proportion of width of the plot to the depth of the
plot |
Above 1, 0.5 to 1, less than 0.5. |
50.75% |
Based on the derivatives of Table 21, the analyses undertaken for the determination of change in the selected eleven parameters have highlighted the following key findings:
1) Façade treatment have been the major change as a result of urbanization. The facades have changed drastically to contemporary as against the classical style. The facades have either been largely altered or the old buildings have been demolished to give way for newer construction with modern facades to accommodate family division and number of members. This can also be related to the year of construction which depicts a significant increase due to urbanization in later years, majorly after the 1980s. The building height has increased with the growth of population and increase in the family size.
2) The technology used for construction of structures have eventually changed over the centuries. Local bricks, stones, clay tiles have eventually been replaced with modern materials such as cement blocks, RCC and steel. This has majorly affected the holistic appearance of the structures along the access road making the spatial appearance clumsy and confusing. The visual sanctity of the space is lost to a great extent.
3) The buildings would have historically developed as residences, some shops and also some rest shelters for the pilgrims – dharamshalas. These would have been built with wide frontage as compared to the depth for visibility with ample setbacks to allow proper lighting and ventilation which suits best for the climatic conditions of the space. However, with the advent of urbanization and population splurge, the nature of use of the structures have been largely altered. Many of these structures, as evident have been either demolished or renovated with modern interventions changing the profile of the buildings. Shops and residences have been developed together in a building. Generally the shops are in the ground floor and the residences are made on the upper floors. These upper floor residences too have been commercialised either for rental purposes or for tourist residences. Greed of the owners to get maximum have changed the use of the buildings with no setbacks, making it often uncomfortable for living.
4) The road width have no relation to the height of the buildings. Clearly there is either violation of building bye-laws or un-precedented approvals have been acquired through unfair means for vertical growth of the buildings.
5) Most of the buildings surveyed are residential buildings. This indicates the strong connection between the temple and the settlements nearby which still exists. However, this is also a visible change being observed with increase in mixed use buildings which is a part of sustainability for the local residents who are not associated with any other profession.
6) Use of materials for construction has eventually changed from historic to modern. Bricks, stones are being replaced with cement blocks, steel and glass. This poses a serious threat to the micro-climate of the space making it hotter and compelling use of artificial ventilation methods which further deteriorate the climate.
7) Traditional building technology have given way to modern construction techniques erasing the traditional features and thus affecting the façade of the building.
8) Most of the structures are built in the plot with little respect of the plot size and there is no consideration of aspect ratio, i.e., the width of the building to the depth of the building. As evident in one of the 18th century structures, these would have been otherwise. The gradual change is due to increase in population in the area and lack of any guideline for protection of the historic fabric.
6. Conclusion
This research has been successful to understand and evaluate the impact of the present urbanization happening on the morphological characteristics in the temple towns of Odisha. This research has enhanced the understanding of the evolution pattern of the historic towns of Odisha, assessed and analysed the impact of present urbanizations happening in the temple towns. It has successfully traced the historic growth patterns of temple towns in Odisha, offering insights into their traditional urban forms. Additionally, it has critically assessed the present-day urbanization trends and their tangible and intangible impacts on the urban morphology, thereby fulfilling the core aim of the study. The analyses undertaken for the study of the impact of urbanization on Ekamra Kshetra, Bhubaneswar, Odisha – a 12th-century urban settlement has been very vast and meticulous. Analysis of each of the parameter has ascertained the level of damage on the original fabric of the locality. Several other parameters such as change in occupancy, Land value, change in movement of circulation, etc also could have been undertaken. All of these would have required further detailed investigation and critical observation at site, demanding significant time, which was not possible currently. These research can be undertaken at a later stage and may form a larger study analysis of the given area to complete a holistic study of the effects of urbanization in Ekamra Kshetra. A pilot project may be established to assess an effective and practical solution for the key issues identified It will also be helpful to determine the steps required to ensure either reversal of the damage or restrict the damage to its current state. Based on these findings, there is need for development of adequate guidelines which are holistic in nature and also offer sustainable solutions to the current problems. The guidelines thus developed shall also have effectively implemented on the ground rather than a hogwash as has been the cases in many of the cities in India. Greater co-ordination amongst all the urban development authorities is needed to ascertain a model conservation and urban renewal of this area, for this study and analysis can form the basis.
CONFLICT OF INTERESTS
None.
ACKNOWLEDGMENTS
None.
REFERENCES
Attarian, K., Sarmadian, B., & Khaleghi, S. (2022). Eco-sustainable Methods for Local Conservation of Built Heritage in Sistan's Castles. Conservation, 2(2), 262-274. https://doi.org/10.3390/conservation2020018
Chandan, S. K. A. (2019). Challenges for Urban Conservation of Core Area in Pilgrim Cities of India. Journal of Urban Management, 8(3), 472-484. https://doi.org/10.1016/j.jum.2019.05.001
Chen, F. L. C., & Shen, O. (2020). Heritage Conservation Through Planning: A Comparison of Policies and Principles in England and China. Planning Practice & Research, 36(5), 578-601. https://doi.org/10.1080/02697459.2020.1752472
Das, M. K. B. (2019). History of Odisha (From earliest times to 1434 A.D.). DDCE/History (M.A)/SLM/Paper.
Davis, K. (1965). The urbanization of the human population. Scientific American, 213(3), 41-53. https://doi.org/10.1038/scientificamerican0965-40
Deng, Z., Wang, D., Liu, S., Tang,
Y., Xia, M., & Wu, Y. (2022). A Survey of Urban
Visual Analytics: Advances
and Future Directions. Computers, Environment and
Urban Systems.
Gupta, C. G. R. (2024). Impact of Globalization on Religious Tourism: The Case of Vrindavan, India. International Journal of Religious Tourism and Pilgrimage, 11(6).
Huq, S. A., & Bhattacharya, P. (2024). Assessing the Performance of Urban Heritage Conservation Projects - Influencing factors, Aspects and Priority Weights. Built Heritage, 8(4). https://doi.org/10.1186/s43238-024-00116-5
Kiruthiga, K., & Tamil K., T. (2019). Effects of Urbanization on Historical Heritage buildings in Kumbakonam, Tamilnadu, India. Frontiers of Architectural Research, 8(1), 94-105. https://doi.org/10.1016/j.foar.2018.09.002
Lourenço, P. (2013). Conservation of Cultural Heritage Buildings: Methodology and Application to Case Studies. Revista ALCONPAT, 3(2). https://doi.org/10.21041/ra.v3i2.46
Mekonnen, H., Belayneh, Z., & Bekele, K. (2022). Practices and Challenges of Cultural Heritage Conservation in Historical and Religious Heritage Sites: Evidence from North Shoa Zone, Amhara Region, Ethiopia. Heritage Science, 10, Article 172. [Online]. https://doi.org/10.1186/s40494-022-00802-6
Menon, A. (2014). Heritage conservation in India: Challenges and New Paradigms. Mexico City, Mexico: Author.
Mishra, S. (1989). Ekamra Kshetra Heritage Project. INTACH.
Praharaj, M. (2012). Historic Conservation and Sustainability: Case of Bindusagar Lake.
Rajakumari, M., & Sivakumar, R. K. S. B. (2019).
Urban Design and Spatial Layout of Temple and Temple Towns of Tamil Nadu-India. International Journal of
Innovative Studies in Sciences and Engineering Technology, 5(1), 4-8.
Sasidhar, K. J. D., & Narayanasamy, S. (2021). A Study on Kanchipuram Town Morphological and Revolution of Cultural Due to Historical Growth of Temple City in Tamilnadu, India. Turkish Journal of Physiotherapy and Rehabilitation, 32(2), 1751-1762.
Udeaja, C., Tanko, C., Akinwale, K., Musa, M., Bhattacharya, P., Das, M., & Lim, J. (2020). Urban Heritage Conservation and Rapid Urbanization: Insights from Surat, India. Sustainability, 12(6), 2172. https://doi.org/10.3390/su12062172
Vishaliny, V., & Krishnan, A. (2024). Retrofitting for Resilience − A Case of Srirangam temple town. In Retrofitting for Resilience (99-112). Springer Nature Singapore. https://doi.org/10.1007/978-981-96-0931-4_7
 This work is licensed under a: Creative Commons Attribution 4.0 International License
© Granthaalayah 2014-2025. All Rights Reserved.