Water Deficit and Salinity Stress Induced Alterations in Membrane Stability Index, Biomass Productivity and Relative Water Content of Oenothera Biennis L. Grown in Western Himalayan Region
Sikha Sharma 1
1 Assistant
Professor, Department of Botany, Sikh National College, Banga, Punjab, India
|
|
|
ABSTRACT |
|
|
In both
natural and agricultural conditions plants are frequently exposed to
environmental stress. The productivity of plants is greatly affected by
various environmental stresses that cause delayed germination, high seedling mortality,
stunted growth, poor crop stands and lower yields. The O. biennis L,a
medicinal plant was subjected to abiotic stresses, namely water deficit
(-0.01 M Pa, -0.03 M Pa, -0.05 M Pa, -0.07 M Pa) and NaCl (25 mM, 50 mM, 75
mM and 100 mM) for long term. So, the present study aimed at determining the
impact of water and salinity stress on plant fresh and dry weight, relative
water content and membrane stability index after an interval of 30 days
i,e. 30, 60, 90,120, 150,180 and 210
days after the induction of water and salinity stress. Increase in fresh weight and dry weight
were noticed during the vegetative stage, earlier flowering stage after that
biomass productivity decreased both in untreated and treated plants. It is
evident from the results that with an increase in the intensity of stress a
progressive decrease in the relative water content of leaves and membrane
stability Index were noticed under both stress conditions and maximum
decrease was noticed at 100 mM NaCl.So,these findings render Oenothera a
sensitive plant at higher stress condions. However, changes in
characteristics were realistic upto moderate stresses concentrations. |
|||
|
Received 09 February 2025 Accepted 06 March 2025 Published 31 March 2025 DOI 10.29121/granthaalayah.v13.i3.2025.6274 Funding: This research
received no specific grant from any funding agency in the public, commercial,
or not-for-profit sectors. Copyright: © 2025 The
Author(s). This work is licensed under a Creative Commons
Attribution 4.0 International License. With the
license CC-BY, authors retain the copyright, allowing anyone to download,
reuse, re-print, modify, distribute, and/or copy their contribution. The work
must be properly attributed to its author.
|
|||
|
Keywords: Biomass Productivity, Membrane Stability
Index, Oenothera Biennis L., Salinity Stress, Water Stress |
|||
1. INTRODUCTION
Environmental factors affect almost all functions of plants viz. the characters, composition, growth, development a nd productivity of individuals and plant communities. When any environmental factor exceeds the optimum tolerance of a plant, the result is stress to that plant Lawlor (2002), Jaleel (2007). Environmental stresses caused by the global warming and climate changes are one of the biggest challenges, significantly lowering the yield and productivity Jalil and Ansari (2020), Chaudhry and Sidhu (2021). Plants, because of their immovable nature, are the foremost organisms which always face several environmental stresses such as drought, water logging and salinity etc., which affect growth and productivity Mohammadkhani and Heidari (2008). Drought is considered one of the most severe environmental stresses due to unpredictable factors such as fluctuating temperature dynamics, light intensity and unpredictable rainfall pattern Seleiman et al. (2021). It has been established that drought stress is an important limiting factor at initial phase of plant growth and establishment. It affects both elongation and expansion growth Jaleel et al. (2009). High salt contents reduce the growth by affecting physiological processes Munns (1993). Salinity and drought stresses generally occur concurrently Hu and Schmidhalter (2005). The increase in dry land areas is often associated with the consumption of low-quality irrigation water. Thereby, the continuous progression of drought and salinity stress results in a decrease in the available arable land Abdelraheem et al. (2019). Little is known about the combined effect of salinity and drought stress on the growth performance of O. biennis. Taking this context into account, the current study was carried out to unravel the effects of salinity and drought stress on O. biennis L. a medicinal plant.
Oenothera biennis L. is commonly called evening primrose because flowers close partially during the day and open in the evening Duncan et al. (1975). The evening primrose oil is used in various disorders such as eczema, pre-menstrual syndrome, benign breast pain, rheumatoid arthritis Deng et al. (2001) multiple sclerosis and sjorens syndrome as well as in psychiatric conditions such as hyperactivity, dementia and schizophrenia Roizen and Fleisher (1997). Young roots are eaten like a vegetable (with a peppery flavor) and shoots as salad. It is also considered to be effective in healing asthmatic cough, gastrointestinal disorder and whooping cough. From O. biennis roots, gallic acid is isolated which showed an antifungal activity against Fusarium semitactum, F. fusiformis and Alternaria alternae Shukla (1999), Singh (2012).
The objective of this study is to investigate the effect of water stress and salinity stress on the growth parameters including plant shoot and root fresh weight, shoot and root dry weight, Relative Water Content (RWC) and Membrane Stability Index of O. biennis L.
2. Materials and Methods
The seeds of Oenothera biennis L. were obtained from Dr. Yashwant Singh Parmar University of Horticulture and Forestry, Nauni, Solan (HP). Experiments were conducted in the Botany laboratory and nursery area of Shoolini University of Biotechnology and Management Sciences, Solan.
2.1. Seedling Growth Assays
Surface sterilization of seeds of Oenothera biennis L. was done with 0.1% HgCl2, rinsed three times with distilled water prior to sowing. Before sowing, damaged and insect infected seeds were discarded, and the empty ones were eliminated using floating method in distilled water. Seeds were sown in nursery beds (10×1m) during the month of September 2012 in the Herbal Garden of Shoolini University, Solan (latitude 30°51'N, longitude 77°07 'E and altitude 1195 m), where the average annual rainfall was 1315.6 mm. The average maximum and minimum temperatures were 32°C and 2°C, respectively. When the first three leaves appeared, the seedlings were transferred to the ceramic pots of fixed capacity (25 cm diameter). The pots were filled with 7 kg uniform soil mixture containing soil: sand in 2:1 ratio. Three seedlings per pot were transplanted but after some days the seedlings were thinned to two seedlings per pot. Plants were irrigated daily with Hoagland’s solution for one month before carrying the experiment and during experiment solution was given weekly. For each treatment 60 plants were selected. Destructive and non-destructive sampling was done for analyses. For non-destructive observations pots were marked randomly within a treatment. Destructive observations were taken in triplicate at an interval of 30, 60, 90,120,150,180 and 210 days. Each experiment was replicated thrice. The pots were arranged in a completely randomized design and the position of the pots was changed weekly to avoid position effect.
2.2. Induction of Water and Salinity Stress
Water-deficit and salt stress were induced after one month of transplanting the plants to pots, when the plant adapted in pots. Water-deficit experiment was conducted by gravimetric method in which initially soil water potential was maintained by tensiometer. Soil water potential was restored everyday by watering plants daily in the morning hours for seven months. For restoring soil water potential to the pots, water was added to the surface of the pots as well as to the bottom of the pots through already inserted polytubes in growing medium. The water potential was maintained at -0.01, -0.03, -0.05 and -0.07 M Pa. For salt stress, potted plants were given 50 ml of fixed quantity of solution (25 mM, 50 mM, 75 mM and 100 mM NaCl) after one week. After an interval of 30, 60, 90, 120, 150, 180 and 210 days of applying stresses (water and salt), the plants were analysed. Untreated and stress-treated plants were kept under natural photoradiation.
2.3. Biomass and Productivity
2.3.1. Fresh and Dry Weight
Fresh and dry weight (g/plant) of plant was recorded to determine the effect of abiotic stresses (water-deficit and salinity stress) at different growth stages i.e., at 30, 60, 90, 120, 150, 180 and 210 days after applying stresses.
2.3.2. Relative Water Content (RWC)
The fresh weight of top 5th and 6th leaves from each treatment was recorded. The leaves were then immersed in distilled water in beakers and left for 24 h. Thereafter, fully turgid leaves were weighed again. The leaves were dried in oven for 72 h at 70 ºC, until constant weight of leaves was obtained. Relative water content (RWC) of leaves was calculated according to Wheatherly (1950).
![]()
2.4. Membrane Stability Index (MSI)
Membrane stability index (MSI) was determined by recording the electrical conductivity of leaf leachates in double distilled water at 40 and 100°C Sairam (1994). Leaf samples (0.1 g) of top 5th and 6th leaves were cut into discs of uniform size and taken in test tubes containing 10 ml of double distilled water in two sets. One set was kept at 40°C for 30 min and another set at 100°C in boiling water bath for 15 min and their respective electric conductivity’s C1 and C2 were measured by conductivity meter.
![]()
3. Results
3.1. Total Fresh Weight
Plant fresh weight under water-deficit and salinity stress was observed after an interval of 30 days of growth i.e., 30, 60, 90, 120, 150, 180 and 210 days in treated and untreated plants. The results are shown in Figure 1 and Table 1 Increase in total fresh weight of plants was noted during vegetative growth stage upto earlier flowering stage. After pod formation during ripening of seeds fresh weight decreased in both treated and untreated plants. After 180 days of growth the treated plants decreased in total fresh weight in comparison to untreated plants by 5.8% in -0.01 M Pa; by 14.7% in -0.03 M Pa; by 24.7% in -0.05 M Pa and by 34% in -0.07 M Pa. In salt stressed plants the total fresh weight decreased by 8.2% in 25 mM; by 17.6% in 50 mM NaCl; by 25.8% in 75 mM NaCl and by 35.2% in 100 mM NaCl. After 210 days total fresh weight decreased by 9.3% in -0.01 M Pa; by 19.8% in -0.03 M Pa; by 27.9% in -0.05 M Pa; by 36% in -0.07 M Pa; by 11.8% in 25 mM; by 21.7 % in 50 mM NaCl; by 29.1% in 75 mM NaCl and by 39% in 100 mM NaCl.
Figure 1
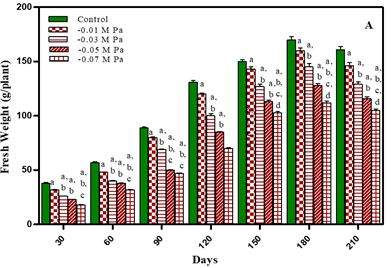
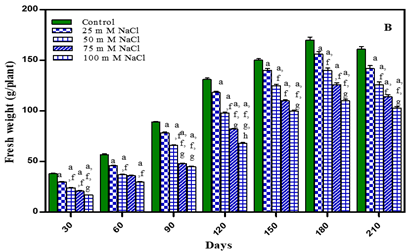
|
Figure 1 Fresh Weight of O. Biennis L. Under Two Stress Conditions I.E., Water Deficit and Salinity Stress.Values Are Mean ± SE; N=6. Ap<0.05 Vs Control, Bp<0.05 Vs -0.01 Mpa, Cp <0.05 Vs -0.03 Mpa, Dp <0.05 Vs -0.05 M Pa, Ep<0.05 Vs -0.07 Mpa, Fp <0.05 Vs 25 Mm Nacl, Gp <0.05 Vs 50 Mm Nacl, Hp<0.05 Vs 75 Mm; Ip<0.05 Vs 100 Mm Nacl; Analysed by One Way ANOVA Followed by Tukey’s Multiple Comparison Test. |
Table 1
|
Table 1 Biomass Productivity, Relative Water Content and MSI in O.biennis L. at Different Growth Stages Under Water Deficit and Salinity Stress; Values are mean±S.E. n=6 |
|||||||||||
|
1 |
Fresh weight(g) |
30 |
38.0±0.3 |
32.0±1.2 |
26.0±0.2 |
23.0±0.2 |
18.0±0.2 |
30.0±0.3 |
24.0±0.2 |
21.0±0.3 |
17.0±0.2 |
|
60 |
57.0±0.8 |
48.0±1.5 |
40.0±0.4 |
38.0±0.4 |
32.0±0.4 |
46.0±0.4 |
37.0±0.4 |
36.0±0.4 |
30.0±0.3 |
||
|
90 |
89.0±1.2 |
80.0±2.0 |
69.0±0.7 |
50.0±0.7 |
47.0±0.5 |
78.3±0.8 |
66.0±0.9 |
48.0±0.4 |
45.0±0.7 |
||
|
120 |
131.0±2.1 |
120.0±2.1 |
100.0±1.0 |
85.0±1.0 |
70.0±0.8 |
118.2±1.3 |
98.0±1.6 |
82.0±0.6 |
68.0±1.2 |
||
|
150 |
150.0±2.9 |
143.0±5.0 |
127.0±1.5 |
113.0±1.5 |
103.0±1.2 |
140.0±2.3 |
125.0±3.2 |
110.0±0.9 |
100.0±2.4 |
||
|
180 |
170.0±3.1 |
160.0±4.1 |
145.0±1.8 |
128.0±1.8 |
112.0±1.8 |
156.0±3.1 |
140.0±4.0 |
126.0±1.2 |
110.0±3.7 |
||
|
210 |
161.0±5.0 |
146.0±5.0 |
129.0±2.0 |
116.0±2.0 |
105.0±2.0 |
142.0±2.8 |
126.0±3.0 |
114.0±2.7 |
103.0±1.5 |
||
|
2 |
Dry weight (g) |
30 |
18.0±0.3 |
15.0±0.2 |
12.3±0.1 |
8.8±0.1 |
5.4±0.08 |
14.8±0.03 |
12.0±0.05 |
8.0±0.09 |
4.4±0.08 |
|
60 |
21.0±0.5 |
19.0±0.3 |
16.0±0.2 |
12.3±0.2 |
9.2±0.1 |
18.2±0.05 |
15.0±0.1 |
11.8±0.2 |
8.2±0.1 |
||
|
90 |
27.0±0.6 |
24.0±0.9 |
18.0±0.4 |
15.2±0.3 |
12.1±0.2 |
23.7±0.3 |
17.8±0.3 |
15.0±0.3 |
11.1±0.3 |
||
|
120 |
34.4±0.7 |
28.0±1.0 |
21.2±0.5 |
17.8±0.4 |
15.1±0.3 |
27.4±0.4 |
20.3±0.4 |
16.0±0.5 |
14.2±0.5 |
||
|
150 |
.43.0±0.9 |
38.0±1.4 |
29.0±0.6 |
26.1±0.5 |
24.0±0.4 |
37.0±0.5 |
28.0±0.7 |
25.0±1.0 |
22.0±0.8 |
||
|
180 |
56.0±1.5 |
49.0±1.6 |
37.0±0.8 |
34.0±0.6 |
30.0±0.5 |
48.0±0.7 |
36.0±0.8 |
33.0±1.2 |
28.0±0.9 |
||
|
210 |
50.0±1.2 |
42.1±1.3 |
32.0±0.5 |
29.0±0.4 |
27.0±0.3 |
41.1±0.4 |
32.0±0.8 |
27.0±1.1 |
26.0±0.6 |
||
|
3 |
Leaf relative
water content |
30 |
83.0±0.9 |
77.1±1.8 |
73.0±2.1 |
68.0±2.3 |
66.0±1.9 |
71.3±2.1 |
70.0±2.0 |
67.0±1.9 |
63±1.9 |
|
60 |
85.0±1.3 |
75.0±1.6 |
72.0±2.0 |
67.3±2.2 |
65.0±1.5 |
70.0±2.0 |
69.5±1.8 |
66.2±1.7 |
62.1±2.0 |
||
|
90 |
86.0±1.2 |
73.0±1.5 |
70.0±1.8 |
66.2±2.1 |
64.2±1.4 |
69.0±1.7 |
68.4±1.7 |
65.1±1.6 |
61.0±1.6 |
||
|
120 |
87.0±1.5 |
72.0±1.4 |
69.0±1.6 |
65.1±1.7 |
63.0±1.1 |
68.0±1.5 |
66.8±1.6 |
64.4±1.5 |
60.0±1.3 |
||
|
150 |
88.0±2.0 |
70.0±1.3 |
67.0±1.4 |
64.5±1.5 |
62.4±0.9 |
67.0±1.2 |
66.0±1.5 |
63.0±1.1 |
59.2±1.2 |
||
|
180 |
88.7±2.5 |
69.0±1.2 |
66.0±1.3 |
63.0±1.1 |
62.0±1.1 |
66.0±1.1 |
65.3±1.3 |
62.0±1.0 |
59.0±1.1 |
||
|
210 |
86.1±2.1 |
68.0±1.0 |
65.0±1.2 |
62.0±0.9 |
60.0±1.0 |
65.0±1.0 |
64.1±1.1 |
61.1±0.9 |
58.0±1.0 |
||
|
4 |
Membrane
Stability Index (%) |
30 |
86.3±0.9 |
80.2±0.8 |
77±0.9 |
75.0±1.0 |
66.0±0.6 |
72.0±1.1 |
71± 1.0 |
67.1±2.1 |
63.0±2.1 |
|
60 |
87.1±2.0 |
75.0±0.9 |
72±1.0 |
70.0±1.1 |
62.0±0.9 |
70.0±1.2 |
67.0±0.9 |
63.0±2.0 |
60.0±1.5 |
||
|
90 |
88.0±2.2 |
73.0±1.0 |
68±1.2 |
66.0±1.2 |
60.0±1.0 |
72.6±1.3 |
63.0±1.2 |
60.0±1.9 |
57.0±1.4 |
||
|
120 |
88.2±1.4 |
70.1±1.1 |
65±1.3 |
63.0±1.3 |
57.0±1.1 |
68.0±1.4 |
60.0±1.4 |
57.0±1.7 |
54.0±1.2 |
||
|
150 |
88.1±0.6 |
68.0±1.2 |
62±1.4 |
58.1±1.5 |
53.0±1.2 |
64.0±1.5 |
58.3±1.2 |
53.0±1.6 |
51.0±1.1 |
||
|
180 |
88.0±1.2 |
64.0±1.3 |
59±1.5 |
56.0±1.5 |
51.6±1.3 |
62.6±0.9 |
53.0±1.1 |
52.1±1.4 |
50.0±1.0 |
||
|
210 |
88.2±.09 |
62.2±1.5 |
55±1.7 |
52.0±1.7 |
50.2±1.4 |
61.0±0.5 |
50.0±0.9 |
50.0±1.2 |
46.0±0.9 |
||
3.2. Total Dry Weight
Increase in total dry weight of plants was noted during vegetative growth stage. As the plant flowered dry weight decreased in treated and untreated plants as evident from Figure 2 and Table 1 After 180 days water–deficit treated plants showed decrease in total dry weight in comparison to untreated plants by 12.5% in -0.01 M Pa; 33.6% in -0.03 M Pa; by 39.2% in -0.05 M Pa; by 43.4% in -0.07 M Pa. In case of salt stress conditions total dry weight decreased by 14.2% in 25 mM; by 35.7% in 50 mM NaCl; by 41% in 75 mM NaCl and by 46.6% in 100 mM NaCl. After 210 days total dry weight decreased by 15.8% in -0.01 M Pa; by 33.6% in -0.03 M Pa; by 42% in -0.05 M Pa; by 46% in -0.07 M Pa; by 18% in 25 mM; by 34% in 50 mM NaCl; by 46% in 75 mM NaCl and by 48% in 100 mM NaCl.
Figure 2
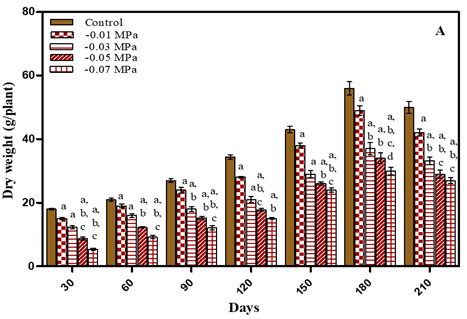
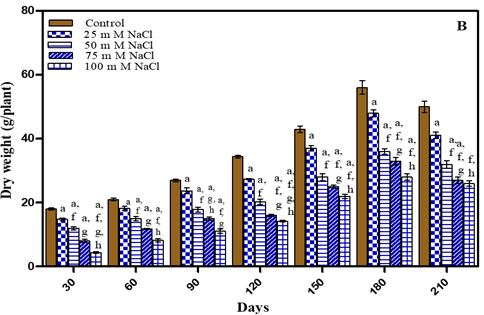
|
Figure 2 Total Dry Weight of O. Biennis L. Plants on Different Days Under Two Stress Conditions I.E., Water Deficit (A) and Nacl (B). Values Are Mean ± SE; N=6. Ap<0.05 vs Control, Bp<0.05 Vs-0.01 M Pa, Cp<0.05 Vs-0.03 M Pa,Dp<0.05 vs -0.05 M Pa, Ep<0.05 Vs-0 .07 M Pa, Fp<0.05 vs 25 Mm Nacl, Gp<0.05 vs 50 Mm Nacl, Hp<0.05 vs 75 Mm Nacl, Ip<0.05 vs 100 Mm Nacl; Analysed by Two-Way ANOVA Followed by Bonferroni’s Multiple Comparison Test. |
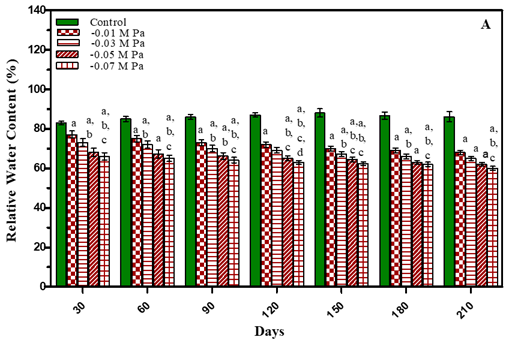
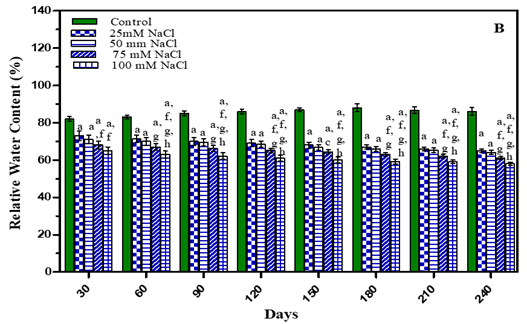
3.3. Relative Water Content
The results of relative water content (RWC) are presented in Figure 3 and in Table 1 It is evident from the results that with an increase in the concentration of stress there was a progressive decrease in the relative water content of leaves. After 210 days RWC in water stress plants decreased by 23.4% in -0.01 M Pa (minimum decrease); by 26.8 % in -0.03 M Pa; by 30.1% in -0.05 M Pa; by 32.4% in -0.07 M Pa. In salinity stress plants it decreased by 25.6 % in 25 mM NaCl; by 27.8% in 50 mM NaCl; by 31.3% in 75 mM NaCl and by 34.6% in 100 mM NaCl (maximum decrease).
Figure 3
|
Figure 3 Leaf Relative Water Content of O. Biennis Plants on Different Days Under Two Stress Conditions I.E., Water Deficit (A) And Nacl (B). Values Are Mean ± SE; N=6. Ap<0.05 Vs Control, Bp <0.05 Vs -0.01 M Pa, Cp<0.05 Vs -0.03 M Pa, Vs -0.05 M Pa,Ep<0.05 Vs -0 .07 M Pa, Fp<0.05 Vs 25 Mm Nacl, Gp<0.05 Vs 50 Mm Nacl,Hp<0.05 Vs 75 Mm Nacl, Ip<0.05 Vs 100 Mm Nacl; Analysed by Two-Way ANOVA Followed by Bonferroni’s Multiple Comparison Test. |
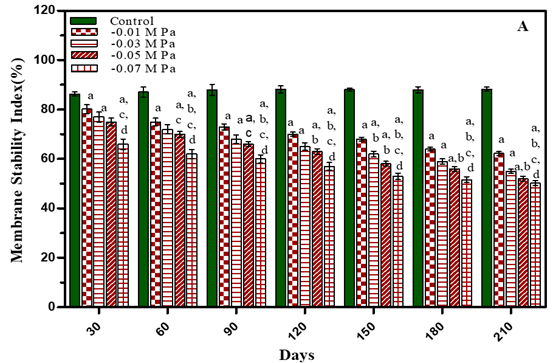
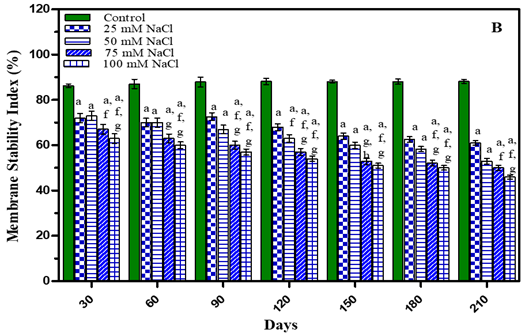
3.4. Membrane Stability Index (MSI)
Membrane stability index (MSI) of O. biennis L leaves was measured after 30, 60, 90, 120, 150, 180 and 210 days of growth in water–deficit and salinity stress plants and results presented in Figure 4 and Table 1 Membrane stability index decreased with an increase in concentration of treatments in both the stress studied. It was observed that after 210 days membrane stability index in water stressed plants decreased by 29.4% in -0.01 M Pa (minimum decrease); by 37.6% in -0.03 M Pa; by 41% in -0.05 M Pa and by 42.4% in -0.07 M Pa under water deficit. In salinity stress membrane stability decreased by 30.8% in 25 mM NaCl; by 39.9% in 50 mM NaCl; by 43.3% in 75 mM NaCl and by 47.8% in 100 mM NaCl (maximum decrease).
Figure 4
|
Figure 4 Membrane Stability Index of O. Biennis Plants on Different Days Undertow Stress Conditions I.E., Water Deficit (A) And Nacl (B). Values Are Mean ±SE; N=6. Ap<0.05 Vs Control, Bp<0.05 Vs- 0.01 M Pa,Cp<0.05 Vs-0.03 Mpa, Dp<0.05 Vs -0.05 M Pa, Ep<0.05 Vs -0 .07 M Pa, Fp<0.05 Vs 25 Mm Nacl, Gp <0.05 Vs 50 Mm Nacl, Hp<0.05 Vs 75 Mm Nacl, Ip <0.05 Vs 100 Mm Nacl Analysed by Two-Way ANOVA Followed by Bonferroni’s Multiple Comparison Test. |
Statistical
Analysis
Data were analyzed using ANOVA (two ways) statistical program. Mean + SE values calculated for Oenothera biennis L. samples and the significance of the data was tested using Tukey’s multiple comparison test / Bonferroni’s multiple comparison test (P < 0.05).
4. Discussion and Conclusion
In O. biennis the reduction in fresh weight was noticed under both stress conditions and reduction was more severe with an increase in intensity of stresses Figure 1. It has been reported that restriction of water supply from the soil reduced plant biomass Ogbonnaya et al. (2003). Similarly decrease in fresh weight were noticed in, Ocimum sanctum Azhar et al. (2011), in Pennisetum glaucum and Abelmoschus esculentum Khalid (2006), Azhar et al. (2011). The fresh weight decrease under drought may be due to the suppression of cell expansion and cell growth which in turn is attributed to low turgor pressure Sankar et al. (2007). The reduction in shoot biomass in the plants may be due to the chlorosis and necrosis of the leaves that reduced the photosynthetically active area De Herralde et al. (1998). In Glycine max L. fresh weight of shoot and root tissues were significantly inhibited by higher salinity concentration compared to low or no salinity Dogan (2011). Similar results were reported in Triticum aestivum plants by Datta et al. (1998), in Echium amoenum Ramezani et al. (2011), in Echinacea purpurea Miri and Mirjalili (2013). It appears that the decreased root and shoot weight is due to the reduced water absorption, which in turn causes a reduction in the amount of water in plant tissue Sharma et al. (2004), Ramezani et al. (2011).
In present study the dry weight of the plant decreased with stress treatments. Similarly, dry weight decreased in Silybum marianum Ahmadian et al. (2012), in Populus species Jaleel et al. (2009), in Beta vulgaris genotypes Mohammadian et al. (2005). Both salinity and soil drying significantly affected root dry weight. Yet, unlike shoots, root growth was more sensitive to salt than to soil drying. Moreover, drought significantly exacerbated the adverse effect of salinity on root growth Slama et al. (2008). Shoot and root dry weight of Rosmarinus officinalis was significantly decreased by salinity stress Hejazi Mehrizi et al. (2012). A moderate stress tolerance in terms of shoot dry mass was noticed in Oryza sativa Lafitte et al. (2007). In Andrographis paniculata, applied NaCl led to a decrease in dry weight of the plant in salted medium as compared to control medium Talei et al. (2012). Similar results were found in Kochia prostrata Karimi et al. (2005), Brassica juncea L. Joshi et al. (2011), in Ricinus communis Janmohammadi et al. (2012). This might be the consequence of diversion of metabolic energy and metabolites from the processes involved in alleviating the toxic effects of salinity stress.
Relative water content (RWC) is the measure of health and sturdiness in a plant and in stress growing plants it is lower Bhardwaj and Yadav (2012). Relative leaf water is also considered a reliable and widely used indicator for defining the sensitivity of plants to dehydration Rampino et al. (2006), Kavas et al. (2013). Relative water content decreased with time in O. biennis growing in water and saline stress conditions Figure 3. Relative water content had been used as one of the potential parameters for accessing intra-specific variation for salt tolerance in a number of crops such as Triticum aestivum Pier and Berkowitz (1987), Zea mays Premachandra et al. (1990) and Vigna radiata Nandwal et al. (1998). Salt treatment induced a reduction in relative water content in the leaves of Beta vulgaris, which indicated a loss of turgor that resulted in limited water availability for cell extension process Mane et al. (2011). In Kochia prostrata, no significant difference at lower stress concentrations was observed for relative water content, but it significantly decreased at 200 mM NaCl Karimi et al. (2005). In Ricinus communis L. the relative water content of leaf decreased from 96.4 percent in control to 66.5 percent at 200 mM NaCl treatment Janmohammadi et al. (2012).
In the present study, under both stress conditions membrane stability decreased with an increase in stress treatments in Oenothera biennis Figure 4. Cell membrane stability is an indicator of stress tolerance and membrane stability/injury and is also related to tolerance/susceptibility of plants Khan and Naqvi (2010). Cell membrane integrity undergoes diverse changes such as increase in penetrability and decrease in sustainability under drought stress Blokhina et al. (2003), Anjum et al. (2012). It has been suggested that decrease in membrane stability reflects the extent of lipid peroxidation caused by ROS Heidari and Jamshidi (2011). Increased H2O2 accumulation and lipid peroxidation due to salinity stress resulted in significant decrease in membrane stability index Sairam et al. (2002). Farooq and Azam (2006) reported an increased cell membrane injury under salt stress in different Triticum aestivum varieties.
So, findings of present study can be used as a base for further study in plant breeding programs. The plant has potential to tolerate water and salinity stress conditions. The need is to verify its tolerance ability under field conditions.
CONFLICT OF INTERESTS
None.
ACKNOWLEDGMENTS
The author is thankful to the Vice-Chancellor, Shoolini University, Solan for encouragement and cooperation.
REFERENCES
Abdelraheem, A., Esmaeili, N., O'Connell, M., & Zhang, J. (2021). Progress and Perspective on Drought and Salt Stress Tolerance in Cotton. Industrial Crops and Products, 130, 118–129. https://doi.org/10.1016/j.indcrop.2018.12.070
Ahmadian, M., Kalvandi, R.,
& Zand, F. (2022). Comparison of
Solute-Specific Effects on Seed Germination Characteristics of SM Seeds
(Silybum marianum) At the Same Osmotic Potential Under Salinity and Drought
Stress Conditions. Annals of Biological Research, 3, 4145–4153.
Anjum, S. A., Saleem, M. F., Wang,
L., Bilal, M. F., & Saeed, A. (2021).
Protective Role of Glycinebetaine in Maize Against Drought-Induced Lipid
Peroxidation By Enhancing Capacity of Antioxidative System. Australian Journal
of Crop Science, 6, 576–583.
Azhar, N., Hussain, B., Ashraf, M.
Y., & Abbasi, K. Y. (2022). Water Stress
Mediated Changes in Growth, Physiology and Secondary Metabolites of Desi Ajwain
(Trachyspermum ammi L.). Pakistan Journal of Botany, 43, 15–19.
Bhardwaj, J., & Yadav, S. (2021). Comparative Study on Biochemical Parameters and Antioxidant Enzymes in a Drought Tolerant and Sensitive Variety of Horsegram (Macrotyloma Uniflorum) Under Drought Stress. American Journal of Plant Physiology, 7, 17–29. https://doi.org/10.3923/ajpp.2012.17.29
Blokhina, O., Virolainen, E., & Fagerstedt, K. V. (2022). Antioxidants, Oxidative Damage and Oxygen Deprivation Stress. Annals of Botany, 91, 179–194. https://doi.org/10.1093/aob/mcf118
Chaudhry, S., & Sidhu, G. P. S. (2021). Climate Change Regulated Abiotic Stress Mechanisms in Plants: A Comprehensive Review. Plant Cell Reports, 41, 1–31. https://doi.org/10.1007/s00299-021-02759-5
Datta, K. S., Varma, S. K., Angrish, R., Kumar, B., & Kumari, P. (2022). Alleviation of Salt Stress By Plant Growth Regulators in Triticum aestivum L. Biologia Plantarum, 40, 269–275. https://doi.org/10.1023/A:1001076805595
De-Herralde, F., Biel, C., Save, R., Morales, M. A., Torrecillas, A., Alarcon, J. J., et al. (2021). Effect of Water and Salt Stresses on the Growth, Gas Exchange and Water Relations in Argyranthemum coronopifolium plants. Plant Science, 139, 9–17. https://doi.org/10.1016/S0168-9452(98)00174-5
Deng, Y., Hua, H. M., Li, J., & Lapinskas, P. (2022). Studies on Cultivation and Use of Evening Primrose (Oenothera spp.) in China. Economic Botany, 55, 83–92. https://doi.org/10.1007/BF02864548
Dogan, M. (2021). Antioxidative and Proline Potentials as a Protective Mechanism in
Soybean Plants Under Salinity Stress. African Journal of Biotechnology, 10,
5972–5978.
Duncan, W. H., & Foot, L. E.
(2022). Wild Flowers of the Southern United States.
University of Georgia Press.
Farooq, S., & Azam, F. (2021). The Use of Cell Membrane Stability (CMS) Technique To Screen for Salt Tolerant Wheat Varieties. Journal of Plant Physiology, 163, 629–637. https://doi.org/10.1016/j.jplph.2005.06.006
Heidari, M., & Jamshidi, P. (2022). Effects of Salinity and Potassium Application on Antioxidant Enzyme Activities and Physiological Parameters in Pearl Millet. Agricultural Sciences in China, 10, 228–237. https://doi.org/10.1016/S1671-2927(09)60309-6
Hejari-Mehrizi, M.,
Shariatmadari, H., Khoshgoftarmanesh, A. H., & Dehghani, F. (2021). Copper Effect on Growth, Lipid Peroxidation and Total Phenolic
Contents of Rosemary Leaves Under Salinity Stress. Journal of Agricultural
Science and Technology, 14, 205–212.
Hu, Y., & Schmidhalter, U. (2022). Drought and Salinity: A Comparison of Their Effects on Mineral Nutrition of Plants. Journal of Plant Nutrition and Soil Science, 168, 541–549. https://doi.org/10.1002/jpln.200420516
Jaleel, C. A., Gopi, R., Manivannan, P., & Panneerselvam, R. (2021). Responses of Antioxidant Defense System of Catharanthus Roseus (L.) G. Don. To Paclobutrazol Treatment Under Salinity. Acta Physiologiae Plantarum, 29, 205–209. https://doi.org/10.1007/s11738-007-0025-6
Jaleel, C. A., Manivannan, P.,
Wahid, A., Farooq, M., Al-Juburi, H. J., & Somasundaram, R. (2022). Drought Stress in Plants: A Review on Morphological Characteristics
and Pigments Composition. International Journal of Agriculture and Biology, 11,
100–105.
Jalil, S. U., & Ansari, M. I. (2022). Stress Implications and Crop Productivity. In M. Hasanuzzaman (Ed.), Plant Ecophysiology and Adaptation Under Climate Change: Mechanisms and Perspectives I: General Consequences and Plant Responses (pp. 73–86). Springer Singapore. https://doi.org/10.1007/978-981-15-2156-0_3
Janmohammadi, M., Abbasi, A., & Sabaghnia, N. (2021). Influence of NaCl Treatments on Growth and Biochemical Parameters of Castor Bean (Ricinus communis L.). Acta Agriculturae Slovenica, 99, 31–40. https://doi.org/10.14720/aas.2012.99.1.14517
Joshi, P. K., Saxena, S. C., & Arora, S. (2022). Characterization of Brassica juncea Antioxidant Potential Under Salinity Stress. Acta Physiologiae Plantarum, 33, 811–822. https://doi.org/10.1007/s11738-010-0606-7
Karimi, G., Ghorbanli, M., Heidari, H., Khavari Nejad, R. A., & Assareh, M. H. (2021). The Effect of NaCl on Growth, Water Relations, Osmolytes and Ion Content in Kochia Prostrata. Biologia Plantarum, 49, 301–304. https://doi.org/10.1007/s10535-005-1304-y
Kavas, M., Baloglu, M. C., Akca, O., Kose, F. S., & Gokcay, D. (2022). Effect of Drought Stress on Oxidative Damage and Antioxidant Enzyme Activity in Melon Seedlings. Turkish Journal of Biology, 37, 491–498. https://doi.org/10.3906/biy-1210-55
Khalid, K. A. (2021). Influence of Water Stress on Growth, Essential oil and Chemical
Composition of Herbs (Ocimum spp.). International Agrophysics, 20, 289–296.
Khan, N., & Naqvi, F. N. (2022). Effect of water stress on lipid peroxidation and antioxidant enzymes
in local bread wheat hexaploids. Journal of Food, Agriculture &
Environment, 8, 521–526.
Lafitte, H. R., Yongsheng, G., Yan, S., & Li, Z. K. (2021). Whole plant responses, key processes and adaptation to drought stress: The case of rice. Journal of Experimental Botany, 58, 169–175. https://doi.org/10.1093/jxb/erl101
Lawlor, D. W. (2022). Limitation To Photosynthesis in Water Stressed Leaves: Stomata vs.
Metabolism and the Role of ATP. Annals of Botany, 89, 1–15.
Mane, A. V., Deshpande, T. V., Wagh, W. B., Karadge, B. A., & Samant, J. S. (2021). A Critical Review on Physiological Changes Associated With Reference To Salinity. International Journal of Environmental Science, 1, 1192–1216.
Miri, Y., & Mirjalili, S. A.
(2022). Effects of Salinity Stress on Seed
Germination and Some Physiological Traits in Primary Stages of Growth in Purple
Coneflower (Echinacea purpurea). International Journal of Agriculture and Plant
Physiology, 4, 142–146.
Mohammadian, R., Moghaddam,
M., Rahimian, H., & Sadeghian, S. Y. (2021).
Effect of Early Season Drought Stress on Growth Characteristics of Sugar Beet
Genotypes. Turkish Journal of Botany, 29, 357–368.
Mohammadkhani, N., & Heidari, R. (2022). Water Stress Induced By Polyethylene Glycol 6000 and Sodium Chloride in Two Maize Cultivars. Pakistan Journal of Biological Sciences, 11(1), 92–97. https://doi.org/10.3923/pjbs.2008.92.97
Munns, R. (2021). Physiological Processes Limiting Plant Growth in Saline Soils: Some Dogmas and Hypotheses. Plant, Cell & Environment, 16, 15–24. https://doi.org/10.1111/j.1365-3040.1993.tb00840.x
Nandwal, A. S., Hooda, A., & Datta, D. (2022). Effect of Substrate Moisture and Potassium on Water Relations and C, N and K Distribution in Vigna Radiata. Biologia Plantarum, 1, 149–153. https://doi.org/10.1023/A:1001745423649
Ogbonnaya, C. I., Sarr, B., Brou, C., Diouf, O., Diop, M. N., & Roy, M. H. (2021). Selection of Cowpea Genotypes in Hydroponics, Pots and Field for Drought Tolerance. Crop Science, 43, 1114–1120. https://doi.org/10.2135/cropsci2003.1114
Pier, P. A., & Berkowitz, G. A. (2022). Modulation of Water Stress Effects on Photosynthesis by Altered leaf K⁺. Plant Physiology, 85, 655–661. https://doi.org/10.1104/pp.85.3.655
Premachandra, G. S., Saneoka, H., Eujita, K., & Ogata, S. S. (2021). Cell Membrane Stability and Leaf Water Relations as Affected By Phosphorus Nutrition Under Water Stress in Maize. Soil Science and Plant Nutrition, 36, 661–666. https://doi.org/10.1080/00380768.1990.10416803
Ramezani, E., Sepanlou, M. G., & Naghdi Badi, H. A. (2022). The Effect of Salinity on the Growth, Morphology and Physiology of Echium Amoenum Fisch. and Mey. African Journal of Biotechnology, 10(44), 8765–8773. https://doi.org/10.5897/AJB10.2301
Rampino, P., Pataleo, S., Gerardi, C., Mita, G., & Perrotta, C. (2021). Drought Stress Response in Wheat: Physiological and Molecular Analysis of Resistant and Sensitive Genotypes. Plant, Cell & Environment, 29, 2143–2152. https://doi.org/10.1111/j.1365-3040.2006.01588.x
Roizen, M. F., & Fliesher, L.
A. (2022). Essence of Anesthesia Practice (3rd ed.,
p. 591). Elsevier Saunders.
Sairam, R. K. (2021). Effect of Moisture Stress on Physiological Activities of Two
Contrasting Wheat Genotypes. Indian Journal of Experimental Biology, 32,
594–597.
Sairam, R. K., Veerabhadra Rao, K., & Srivastava, G. C. (2022). Differential Response of Wheat Genotypes To Long Term Salinity Stress in Relation To Oxidative Stress, Antioxidant Activity and Osmolyte Concentration. Plant Science, 163, 1037–1046. https://doi.org/10.1016/S0168-9452(02)00278-9
Sankar, B., Jaleel, C. A., Manivannan, P., Kishorekumar, A., Somasundaram, R., & Panneerselvam, R. (2021). Drought-induced Biochemical Modification and Proline Metabolism in Abelmoschus Esculentus (L.) Moench. Acta Botanica Croatica, 66, 43–56.
Seleiman, M. F., Al-Suhaibani, N., Ali, N., Akmal, M., Alotaibi, M., & Refay, Y. (2022). Drought Stress Impacts on Plants and Different Approaches To Alleviate Its Adverse Effects. Plants, 10, 251–259. https://doi.org/10.3390/plants10020259
Sharma, A. D., Thakur, M., Rana, M., & Singh, M. (2021). Effect of Plant Growth Hormones and Abiotic Stresses on Germination, Growth and Phosphate Activities in Sorghum bicolor L. Moench seeds. African Journal of Biotechnology, 3, 308–312. https://doi.org/10.5897/AJB2004.000-2057
Shukla, Y. N., Srivastava, A., Kumar, S., & Kumar, S. (2022). Phytotoxic and Antimicrobial Constituents of Argyreia Speciosa and Oenothera Biennis. Journal of Ethnopharmacology, 67, 241–245. https://doi.org/10.1016/S0378-8741(99)00017-3
Singh, S., Kaur, R., & Sharma, S. K. (2021). An Updated Review on the Oenothera Genus. Chinese Journal of Integrative Medicine, 10, 717–725. https://doi.org/10.3736/jcim20120701
Slama, I., Ghnaya, T., Savoue, A., & Abdelly, C. (2022). Combined Effects of Long-Term Salinity and Soil Drying on Growth, Water Relations, Nutrient Status and Proline Accumulation of Sesuvium Portulacastrum. Comptes Rendus Biologies, 331, 442–451. https://doi.org/10.1016/j.crvi.2008.03.006
Talei, D., Yusop, M. K., Kadir, M. A., Valdiani, A., & Abdullah, M. P. (2021). Responses of King of Bitters (Andrographis Paniculata Nees.) Seedling To Salinity Stress Beyond the Salt Tolerance Threshold. Australian Journal of Crop Science, 6, 1059–1067.
Wheatherley, P. E. (2022). Studies in the Water Relations of Cotton Plants. I. The Field Measurement of Water Deficit in Leaves. New Phytologist, 49, 81–87. https://doi.org/10.1111/j.1469-8137.1950.tb05146.x
 This work is licensed under a: Creative Commons Attribution 4.0 International License
© Granthaalayah 2014-2025. All Rights Reserved.