Assessment of Family Burden, social support and Quality of Life among Parents of children with multiple disabilities
Ashok S. Kori 1![]() , Dr. Renuka E. Asagi 2
, Dr. Renuka E. Asagi 2
1 Research
Scholar, Department of Studies in Social Work, Karnatak University, Dharwad,
India
2 Assistant
Professor, Department of Studies in Social Work, Karnatak University, Dharwad,
India
|
|
|
ABSTRACT |
|
|
The increasing
prevalence of childhood disabilities across various socio-cultural settings
due to various reasons necessitates a deeper understanding of the
psychosocial implications for families. The family, especially the parents,
often becomes the primary source of care and advocacy for a child with
disabilities. This caregiving role brings about significant physical,
emotional, financial, and social challenges. The findings discussed in this
article are drawn from data collected in the community, with a focus on
socio-demographic condition of parents of children with disabilities and from
social work perspective. The study findings are from pilot study. |
|||
|
Received 10 June 2025 Accepted 16 July 2025 Published 11 September 2025 Corresponding Author Ashok S.
Kori, ashok.kori@gmail.com DOI 10.29121/granthaalayah.v13.i8.2025.6254 Funding: This research
received no specific grant from any funding agency in the public, commercial,
or not-for-profit sectors. Copyright: © 2025 The
Author(s). This work is licensed under a Creative Commons
Attribution 4.0 International License. With the
license CC-BY, authors retain the copyright, allowing anyone to download,
reuse, re-print, modify, distribute, and/or copy their contribution. The work
must be properly attributed to its author.
|
|||
|
Keywords: Social, Family, Parents, Children,
Disabilities |
|||
1. INTRODUCTION
The increasing prevalence of childhood disabilities across various socio-cultural settings due to various reasons necessitates a deeper understanding of the psychosocial implications for families. The family, especially the parents, often becomes the primary source of care and advocacy for a child with disabilities. This caregiving role brings about significant physical, emotional, financial, and social challenges. The findings discussed in this article are drawn from data collected in the community, with a focus on socio-demographic condition of parents of children with disabilities and from social work perspective. The study findings are from pilot study.
2. Objectives of the study
To assess socio-demographic condition of parents of children with disabilities. To assess family burden, social support and quality of life among parents of children with disabilities.
3. Research Methodology
This study employed a quantitative research approach with a descriptive research design. A semi-structured interview schedule used to assess socio-demographic condition of respondents. In addition, scandalized scales applied in the current study such are Family Burden Interview Schedule (FBIS) by Pai and Kapur in 1981. The multidimensional scale of Perceived social support (MSPSS) and the WHOQOL-BREF is 26 item questionnaires used. The study adopted a purposive sampling design to select respondents from in Dharwad district. The sample size was 64, consisted of 64 respondents, divided equally into 32 males and 32 females, representing both parents of children with disabilities. Statistical analysis was done using the Statistical Package for Social Sciences (SPSS). The informed consent was obtained from the respondents to participate in this study.
4. Findings
Table 1
|
Table 1 Gender of Parents |
||||||
|
Gender
of Parents |
Frequency |
Percentage |
Valid
Percentage |
Cumulative
Percentage |
||
|
Valid |
Male |
32 |
50.0 |
50.0 |
50.0 |
|
|
Female |
32 |
50.0 |
50.0 |
100.0 |
||
|
Total |
64 |
100.0 |
100.0 |
|||
Gender Distribution of Participants: The above table represents an equal distribution of male and female participants, with 32 males (50%) and 32 females (50%), making up a total of 64 respondents.
Table 2
|
Table 2 Age of Parents |
||||||
|
Respondents
Age |
Frequency |
Percentage |
Valid
Percentage |
Cumulative
Percentage |
||
|
Male |
Valid |
20-30 |
1 |
3.1 |
3.1 |
3.1 |
|
|
|
31-40 |
19 |
59.4 |
59.4 |
62.5 |
|
|
|
41-50 |
9 |
28.1 |
28.1 |
90.6 |
|
|
|
51-60 |
2 |
6.3 |
6.3 |
96.9 |
|
|
|
61-70 |
1 |
3.1 |
3.1 |
100.0 |
|
|
|
Total |
32 |
100.0 |
100.0 |
|
|
Female |
Valid |
20-30 |
15 |
46.9 |
46.9 |
46.9 |
|
|
|
31-40 |
14 |
43.8 |
43.8 |
90.6 |
|
|
|
41-50 |
2 |
6.3 |
6.3 |
96.9 |
|
|
|
51-60 |
1 |
3.1 |
3.1 |
100.0 |
|
|
|
Total |
32 |
100 |
100 |
|
The above table depicts the age and gender distribution of a sample consisting of 64 parents, equally divided between males and females (32 each). Among male participants, the majority fall within the 31–40 age group, making up 59.4% of the male sample. This is followed by 28.1% in the 41–50 age group, while smaller proportions are observed in the 20–30 (3.1%), 51–60 (6.3%), and 61–70 (3.1%) age brackets. This indicates that male participants are primarily middle-aged, with fewer younger or older individuals represented. The age range spans from 20 to 70 years. In contrast, the female participants show a noticeably younger age profile. The largest portion, 46.9%, are in the 20–30 age group, closely followed by 43.8% in the 31–40 age group. Only a small fraction of females falls into the older age categories: 6.3% are aged 41–50, and 3.1% are aged 51–60. Notably, no female participants are recorded in the 61–70 age group.
Table 3
|
Table 3 Age of Children with
Disabilities |
||||||
|
Age
of Children with disabilities |
Frequency |
Percentage |
Valid
Percentage |
Cumulative
Percentage |
||
|
Male |
Valid |
6.00 |
3 |
9.4 |
9.4 |
9.4 |
|
|
|
7.00 |
1 |
3.1 |
3.1 |
12.5 |
|
|
|
8.00 |
1 |
3.1 |
3.1 |
15.6 |
|
|
|
9.00 |
8 |
25.0 |
25.0 |
40.6 |
|
|
|
10.00 |
4 |
12.5 |
12.5 |
53.1 |
|
|
|
11.00 |
1 |
3.1 |
3.1 |
56.3 |
|
|
|
12.00 |
2 |
6.3 |
6.3 |
62.5 |
|
|
|
13.00 |
6 |
18.8 |
18.8 |
81.3 |
|
|
|
14.00 |
3 |
9.4 |
9.4 |
90.6 |
|
|
|
15.00 |
2 |
6.3 |
6.3 |
96.9 |
|
|
|
16.00 |
1 |
3.1 |
3.1 |
100.0 |
|
|
|
Total |
32 |
100.0 |
100.0 |
|
|
Female |
Valid |
6.00 |
3 |
9.4 |
9.4 |
9.4 |
|
|
|
7.00 |
1 |
3.1 |
3.1 |
12.5 |
|
|
|
8.00 |
1 |
3.1 |
3.1 |
15.6 |
|
|
|
9.00 |
8 |
25.0 |
25.0 |
40.6 |
|
|
|
10.00 |
4 |
12.5 |
12.5 |
53.1 |
|
|
|
11.00 |
1 |
3.1 |
3.1 |
56.3 |
|
|
|
12.00 |
2 |
6.3 |
6.3 |
62.5 |
|
|
|
13.00 |
6 |
18.8 |
18.8 |
81.3 |
|
|
|
14.00 |
3 |
9.4 |
9.4 |
90.6 |
|
|
|
15.00 |
2 |
6.3 |
6.3 |
96.9 |
|
|
|
16.00 |
1 |
3.1 |
3.1 |
100.0 |
|
|
|
Total |
32 |
100.0 |
100.0 |
|
Age Distribution of Special Children by Gender: The above table indicates that the age of special children ranges from 6 to 16 years, with a mean of approximately 10.8 years for both genders. The most frequently reported age is 9 years, accounting for 5% of the total responses. This is followed by 13 years (18.8%), and 10 years (12.5%), suggesting that a significant portion of special children are in their mid-childhood to early adolescence.
Table 4
|
Table 4 Gender of Children |
|||||||
|
Gender of Child |
Frequency |
Percentage |
Valid Percentage |
Cumulative
Percentage |
|||
|
Male |
Valid |
Male Child |
19 |
59.4 |
59.4 |
59.4 |
|
|
Female Child |
13 |
40.6 |
40.6 |
100.0 |
|||
|
Total |
32 |
100.0 |
100.0 |
||||
|
Female |
Valid |
Male Child |
19 |
59.4 |
59.4 |
59.4 |
|
|
Female Child |
13 |
40.6 |
40.6 |
100.0 |
|||
|
Total |
32 |
100.0 |
100.0 |
||||
The above table shows that the gender distribution of children based on the gender of the parent. Both male and female participants report identical patterns: 59.4% have male children, while 40.6% have female children. This suggests a consistent trend across both male and female respondents, with a higher proportion of male children reported in each group. The symmetry in responses indicates no significant variation in the gender of children between male and female parents in this sample of 64 individuals.
Table 5
|
Table 5 Religion of Respondents |
||||||
|
Religion |
Frequency |
Percentage |
Valid
Percentage |
Cumulative
Percentage |
||
|
Male |
Valid |
Hindu |
25 |
78.1 |
78.1 |
78.1 |
|
|
|
Muslim |
6 |
18.8 |
18.8 |
96.9 |
|
|
|
Others |
1 |
3.1 |
3.1 |
100.0 |
|
|
|
Total |
32 |
100.0 |
100.0 |
|
|
Female |
Valid |
Hindu |
25 |
78.1 |
78.1 |
78.1 |
|
|
|
Muslim |
6 |
18.8 |
18.8 |
96.9 |
|
|
|
Others |
1 |
3.1 |
3.1 |
100.0 |
|
|
|
Total |
32 |
100.0 |
100.0 |
|
The data presents the religious affiliation of participants categorized by gender, showing identical distributions for both males and females. In each group of 32 individuals, 78.1% identify as Hindu, 18.8% as Muslim, and 3.1% fall under the "Others" category. This indicates that the majority of both male and female participants share the same religious background, with Hinduism being the predominant religion in the sample. The uniformity across genders suggests a consistent religious composition within the overall group of 64 participants.
Table 6
|
Table 6 Domicile |
||||||
|
Domicile
|
Frequency |
Percentage |
Valid
Percentage |
Cumulative
Percentage |
||
|
Male |
Valid |
Rural |
15 |
46.9 |
46.9 |
46.9 |
|
|
|
Urban |
17 |
53.1 |
53.1 |
100.0 |
|
|
|
Total |
32 |
100.0 |
100.0 |
|
|
Female |
Valid |
Rural |
15 |
46.9 |
46.9 |
46.9 |
|
|
|
Urban |
17 |
53.1 |
53.1 |
100.0 |
|
|
|
Total |
32 |
100.0 |
100.0 |
|
The data on domicile status reveals an identical distribution between male and female participants. In both groups, 46.9% come from rural areas, while 53.1% reside in urban areas. This suggests a nearly balanced representation of rural and urban backgrounds, with a slight majority from urban settings.
Table 7
|
Table 7 Education of Parents |
||||||
|
Education |
Frequency |
Percentage |
Valid
Percentage |
Cumulative
Percentage |
||
|
Male |
Valid |
illitrate |
9 |
28.1 |
28.1 |
28.1 |
|
|
Primary |
10 |
31.3 |
31.3 |
59.4 |
|
|
|
Secondary |
4 |
12.5 |
12.5 |
71.9 |
|
|
|
PUC |
6 |
18.8 |
18.8 |
90.6 |
|
|
|
Diploma |
1 |
3.1 |
3.1 |
93.8 |
|
|
|
PUC
above |
2 |
6.3 |
6.3 |
100 |
|
|
|
Total |
32 |
100 |
100 |
||
|
Female |
Valid |
illiterate |
8 |
25 |
25 |
25 |
|
|
Primary |
10 |
31.3 |
31.3 |
56.3 |
|
|
|
Secondary |
11 |
34.4 |
34.4 |
90.6 |
|
|
|
PUC |
1 |
3.1 |
3.1 |
93.8 |
|
|
|
PUC
above |
2 |
6.3 |
6.3 |
100 |
|
|
|
Total |
32 |
100 |
100 |
||
The data on parental education levels shows notable differences between male and female participants. Among male respondents, the highest proportion (31.3%) have completed primary education, followed closely by 28.1% who are illiterate. Smaller percentages have attained secondary education (12.5%), PUC (18.8%), diploma (3.1%), and education above PUC (6.3%). In contrast, female respondents show a slightly higher level of education overall. While 25% are illiterate and 31.3% have primary education—similar to males—34.4% have completed secondary education, which is significantly higher than the male figure. Only 3.1% of females have PUC education, and 6.3% have education beyond PUC, with no female respondents holding a diploma. Overall, the data indicates that while both male and female parents have a substantial proportion with only primary or no formal education, female respondents show a higher percentage in secondary education, suggesting a modest educational advantage in that category.
Table 8
|
Table 8 Type of Family |
|||||||
|
Type
of Family |
Frequency |
Percentage |
Valid
Percentage |
Cumulative
Percentage |
|||
|
Male |
Valid |
Joint
family |
12 |
37.5 |
37.5 |
37.5 |
|
|
|
|
Nuclear
family |
20 |
62.5 |
62.5 |
100.0 |
|
|
|
|
Total |
32 |
100.0 |
100.0 |
||
|
Female |
Valid |
Joint
family |
12 |
37.5 |
37.5 |
37.5 |
|
|
|
|
Nuclear
family |
20 |
62.5 |
62.5 |
100.0 |
|
|
|
|
Total |
32 |
100.0 |
100.0 |
||
The data on the type of family structure reveals identical distributions among both male and female participants. In each group of 32 individuals, 62.5% belong to nuclear families, while 37.5% belong to joint families. This indicates a general preference or prevalence of nuclear family setups across both genders in the sample. The equal distribution suggests that family type does not differ by gender in this group, with nuclear families being the dominant family structure overall
Table 9
|
Table 9 Employment of Parents |
||||||
|
Employment |
Frequency |
Percentage |
Valid
Percentage |
Cumulative
Percentage |
||
|
Male |
Valid |
Agriculture |
3 |
9.4 |
9.4 |
9.4 |
|
|
|
Coolie |
15 |
46.9 |
46.9 |
56.3 |
|
|
|
Private
Job |
2 |
6.3 |
6.3 |
62.5 |
|
|
|
Business |
1 |
3.1 |
3.1 |
65.6 |
|
|
|
Other
work |
11 |
34.4 |
34.4 |
100.0 |
|
|
|
Total |
32 |
100.0 |
100.0 |
|
|
Female |
Valid |
Agriculture |
2 |
6.3 |
6.3 |
6.3 |
|
|
|
Coolie |
10 |
31.3 |
31.3 |
37.5 |
|
|
|
Other
work |
20 |
62.5 |
62.5 |
100.0 |
|
|
|
Total |
32 |
100.0 |
100.0 |
|
The employment data reveals distinct differences in the types of work undertaken by male and female participants. Among males, the most common occupation is working as a coolie (46.9%), followed by other forms of work (34.4%). Smaller proportions are engaged in agriculture (9.4%), private jobs (6.3%), and business (3.1%). In contrast, the majority of female participants (62.5%) are involved in "other work," which may include informal or domestic labor, while 31.3% work as coolies and 6.3% in agriculture. Notably, no female participants are reported in private jobs or business. This suggests that while both genders are predominantly engaged in labor-intensive or informal employment, males show slightly more occupational diversity, including some presence in private sector and entrepreneurial roles, whereas females are more concentrated in unspecified or informal work categories.
Table 10
|
Table 10 Family Income |
||||||
|
Family
Income |
Frequency |
Percentage |
Valid
Percentage |
Cumulative
Percentage |
||
|
Male |
Valid |
less
than 1lakh |
30 |
93.8 |
93.8 |
93.8 |
|
1L
1Rs to 2L Rs |
2 |
6.3 |
6.3 |
100.0 |
||
|
Total |
32 |
100.0 |
100.0 |
|||
|
Female |
Valid |
less
than 1lakh |
32 |
100.0 |
100.0 |
100.0 |
The data on family income reveals that the vast majority of participants, regardless of gender, fall within the low-income bracket. Among male respondents, 93.8% report a family income of less than ₹1 lakh per year, while a small minority (6.3%) earn between ₹1 lakh and ₹2 lakh. In comparison, all female respondents (100%) report a family income of less than ₹1 lakh. This highlights a predominantly economically disadvantaged population, with female-led households experiencing slightly lower income levels overall, as none report earnings above ₹1 lakh. The data underscores widespread financial hardship across both groups, with limited income diversity
Table 11
|
Table 11 Gender of Parents: * Which Professionals Have U Consulted? Cross-Tabulation |
||||||||
|
Which
professionals have u consulted? |
Total |
|||||||
|
Ayurveda
Doctor |
Homeopathic |
Nati
specialist |
Allopathic |
Others |
||||
|
Gender
of Parents |
Male |
Count |
1 |
0 |
1 |
22 |
8 |
32 |
|
%
of Total |
1.6% |
0.0% |
1.6% |
34.4% |
12.5% |
50.0% |
||
|
Female |
Count |
1 |
1 |
0 |
22 |
8 |
32 |
|
|
%
of Total |
1.6% |
1.6% |
0.0% |
34.4% |
12.5% |
50.0% |
||
|
Total |
Count |
2 |
1 |
1 |
44 |
16 |
64 |
|
|
%
of Total |
3.1% |
1.6% |
1.6% |
68.8% |
25.0% |
100.0% |
||
The above table indicates that a majority of both genders (68.8%) sought help from allopathic doctors, while some also turned to alternative systems like Ayurveda and traditional healing. This pattern indicates general trust in mainstream medicine with occasional cultural inclinations influencing health-seeking behavior.
Figure1
|
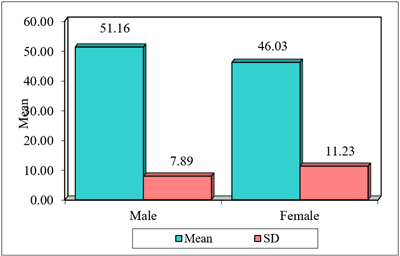
Figure 1 Comparison of Male and Female Caregivers with Social Support Scores |
Null hypothesis: There is no significant difference between male and female caregivers with respect to family burden scores
To test the null hypothesis, the non-parametric i.e. Mann-Whitney U test was applied, and the results are presented in the following table.
Table 12
|
Table 12 Comparison of Male and Female Caregivers with Respect to Family Burden Scores by Mann-Whitney U Test |
|||||||
|
Mean |
SD |
Mean rank |
U-value |
Z-value |
P-value |
||
|
Male |
32 |
22.03 |
4.99 |
27.59 |
|
|
|
|
Female |
32 |
25.25 |
7.27 |
37.41 |
355 |
-2.1013 |
0.0356,S |
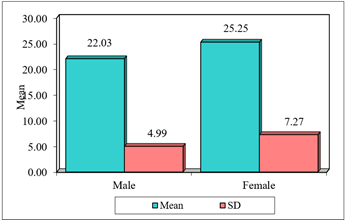
From the above table, it can be seen that, the mean and SD of family burden scores in male caregivers is (22.03±4.99) and in female caregivers (25.25±7.27). The difference between male and female caregivers with family burden scores is found to be statistically significant (Z=-2.1013, p=0.0356) at 5% level of significance. Hence, the null hypothesis is rejected, and alternative hypothesis is accepted. It means that, the family burden scores are different in male caregivers and female caregivers. The mean scores are also presented in the following figure.
Figure 2
|
Figure 2 Comparison of Male and Female Caregivers with Family Burden Scores |
Null hypothesis: There is no significant difference between male and female caregivers with respect to quality-of-life scores. To test the null hypothesis, the non-parametric i.e. Mann-Whitney U test was applied, and the results are presented in the following table.
Table 13
|
Table 13 Comparison of Male and Female
Caregivers with Respect to Quality-of-Life Scores by Mann-Whitney U Test |
|||||||
|
Gender |
n |
Mean |
SD |
Mean rank |
U-value |
Z-value |
P-value |
|
Male |
32 |
70.84 |
5.29 |
37.73 |
|||
|
Female |
32 |
68.91 |
6.75 |
27.27 |
344.50 |
2.2423 |
0.0249,S |
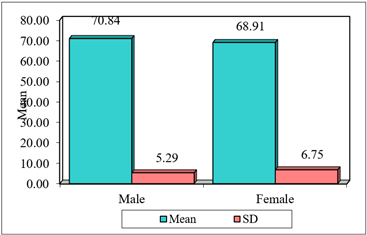
From the above table, it can be seen that, the mean and SD of quality-of-life scores in male caregivers is (70.84±5.29) and in female caregivers (68.91±6.75). The difference between male and female caregivers with quality-of-life scores is found to be statistically significant (Z=2.2423, p=0.0249) at 5% level of significance. Hence, the null hypothesis is rejected, and alternative hypothesis is accepted. It means that, the quality-of-life scores are different in male caregivers and female caregivers. The mean scores are also presented in the following figure.
Figure3
|
Figure 3 Comparison of Male and Female Caregivers with QOL Scores |
Summary of Findings: Gender-Based Analysis on Experiences and Services Among Parents of Children with Disabilities
5. Discussion
Social Work Interventions and Recommendations The findings emphasize several key areas for social work intervention:
1) Emotional Support Services: Counselling, therapy, and peer-support groups should be made accessible from the point of diagnosis.
2) Awareness and Advocacy Training: Workshops and campaigns to educate parents about their legal rights, available schemes, and advocacy methods.
3) School Collaboration: Social workers should facilitate effective communication between parents and schools to promote inclusive education.
4) Stigma Reduction: Community-level campaigns and sensitization programs to reduce the stigma associated with disabilities.
5) Parental Training: Equip parents with caregiving skills and knowledge about disability management.
6. Social Work Interventions and Recommendations
From a social work standpoint, these findings highlight critical intervention points. First, emotional support services, such as counselling and peer support groups, should be made accessible to parents immediately after diagnosis. The high incidence of stress, sadness, and helplessness necessitates a structured psychosocial response. Second, awareness campaigns and training programs need to be conducted more in number and to be implemented to educate parents about their legal rights, government schemes, and available community resources. This will enhance their ability to advocate for their children and reduce dependence on ad hoc support. Third, there is a need to improve school involvement. Social workers can act as mediators between families and educational institutions to ensure inclusive practices and customized educational plans for children with disabilities. Fourth, stigma reduction programs must be introduced at the community level.
7. Conclusion
From a social work perspective, there is a pressing need for comprehensive and empathetic interventions that address not only the practical needs of caregivers but also their emotional and psychological well-being. Empowering families through information, support, and advocacy can significantly enhance the quality of life for both parents and their children with disabilities.
CONFLICT OF INTERESTS
None.
ACKNOWLEDGMENTS
None.
REFERENCES
Aghaei, A., Rostami, H. R., & Khakshour, A. (2016). A systematic Review on Social Support of Parents of Disabled Children. Archives of Rehabilitation, 17(3), 240–255.
Alghamdi, S., Almulla, H., Aljaloud, O., Almulla, H., & Nasser, S. (2024). Caregiver Burden, Perceived Stress, and Social Support Among Parents of Chronically Ill Children in Saudi Arabia: A Cross-Sectional Study. BMC Nursing, 23(1), 22. https://doi.org/10.1186/s12912-024-02494-8
Chan, J. B., & Wong, M. Y. (2024). Family Quality of Life of Parents of Children with Intellectual Disability: Do Psychological Stress and Parental Involvement Matter? Journal of Intellectual Disabilities. https://doi.org/10.1177/17446295241254624
Elvi, S. (2025, May 27). My Daughter, 22, Can't Shower or Dress Herself—But She Wasn't Considered 'Disabled Enough' for help. The Sun.
Holden, M. (2025, May 30). The Inequality in Disability Support: What My Son Gets, and What Others Can't Afford. The Guardian.
Hollis, L. (2023, April 22). How Special Needs Parents Can Find Help to Manage Stress. Verywell Health.
Kelly, A. (2025, May 28). Family Carers of All Ages Need Looking After too. The Guardian.
Lee, G. K., & Park, H. R. (2020). Linking Maternal Caregiving Burden to Maternal and Child Adjustment: The Mediating and Moderating Role of Maternal Coping Strategies. Journal of Developmental and Physical Disabilities, 32(6), 847–864. https://doi.org/10.1007/s10882-019-09694-0
Lee, J. (2021). Parental Caregiving Burden, Depression, Social Support, and Life Satisfaction: A Multigroup Analysis. Exceptional Children, 87(4), 489–504. https://doi.org/10.1177/0034355220983461
Li, H., Zhang, Y., Wang, L., & Chen, X. (2025). Care Burden and Quality of Life Among Family Caregivers of Children With Cerebral Palsy in China: The Mediating Roles of Social Support and Coping Styles. BMC Public Health, 25(1), 842. https://doi.org/10.1186/s12889-025-21679-7
Lopes‐Júnior, L. C., Silva, L. T., Lima, R. A. G., & Santos, M. A. (2024). Health Challenges Faced by Parents of Children with Disabilities: A Scoping Review. BMC Pediatrics, 24(1), 150.
Mulvihill, T. (2025, May 30). A Workforce Crisis is Damaging Families' Access to Therapies for Babies with Developmental Delays. Associated Press.
Polat, F., & Erdemir, F. (2021). The Relationship Between the Care Burden and Quality of Life of Parents Who Have Children with Hematological Problems. Journal of Pediatric Nursing, 61, e49–e54. https://doi.org/10.1016/j.pedn.2021.05.001
Szulc, J. M., & Czajkowska, M. (2023). Well-Being of Parents of Children with Disabilities—Does Employment Status Matter? Social Sciences, 12(8), 463. https://doi.org/10.3390/socsci12080463
 This work is licensed under a: Creative Commons Attribution 4.0 International License
© Granthaalayah 2014-2025. All Rights Reserved.