Water Deficit and Salinity Stress Induced Alterations in the Morphological Characteristics of Oenothera Biennis L. Grown in Western Himalayan Region
Dr. Kumari Sikha 1
1 Assistant
Professor, Department of Botany Sikh National College Banga, S. B. S. Nagar,
Punjab, India
|
|
|
ABSTRACT |
|
|
The present
study aimed at determining the morphological response of Oenothera biennis L. under water stress and salinity stress caused
by altering climatic conditions in the present scenario. Water deficit and
salinity stress are one of the major abiotic stress factors show negative
impact on growth, development and yield on different agricultural activities.
Thus demands the need of developing water deficit and salt tolerant plant
varieties. Oenothera biennis L. is one of the
important medicinal plant with several medicinal
properties, but information related to morphological response which helps in
determining the level of water and salinity stress tolerance in Oenothera biennis L. has not been reported yet. So, the present
study is carried out to investigate the effect of water stress and salinity
stress under different concentrations i.e, water stress (-0.01 M Pa, -0.03 M
Pa, -0.05 M Pa and -0.07 M Pa) and salinity stress (25 mM, 50 mM, 75 mM and
100 mM NaCl) on shoot length, no. of leaves, no. of flowers, no. of nodes,
seed yield and root length. At lower water and salinity stress concentrations
the Oenothera biennis L. has shown tolerance in
terms of morphological features. These findings render Oenothera a sensitive
plant at higher stresses concentration.
However, changes in characteristics were realistic up to moderate
stresses concentration. |
|||
|
Received 10 January 2024 Accepted 12 February 2025 Published 15 March 2025 DOI 10.29121/granthaalayah.v13.i2.2025.6227 Funding: This research
received no specific grant from any funding agency in the public, commercial,
or not-for-profit sectors. Copyright: © 2025 The
Author(s). This work is licensed under a Creative Commons
Attribution 4.0 International License. With the
license CC-BY, authors retain the copyright, allowing anyone to download,
reuse, re-print, modify, distribute, and/or copy their contribution. The work
must be properly attributed to its author.
|
|||
|
Keywords: Water Stress, Salinity Stress, Medicinal Plant,
Morphological Responses, Productivity |
|||
1. INTRODUCTION
Plants exposure to abiotic stresses viz. water stress and salinity stress cause imbalance in the natural status of plants and it influence the germination, character composition, growth, development and yield of individual plant and plant communities. Severe drought and high salinity also promote desertification and salinization of agricultural land area. Further, increase soil salt concentration decreases plant water uptake leading to an apparent water limitation and later to the accumulation of toxic ions in various plant organs which negatively affect plant growth and productivity and this situation will become worse in the upcoming years. Therefore, drought and salinity stresses have been the subject of intense research in the present scenario. So, in the present study an attempt has been made to determine the influence of abiotic stresses viz. water-deficit and salinity stress on morphological characteristics of Oenothera biennis L., commonly called evening primrose, an important medicinal plant. The evening primrose oil is used in various disorders such as eczema, pre-menstrual syndrome, benign breast pain, rheumatoid arthritis Deng et al. (2001) multiple sclerosis and sjorens syndrome as well as in psychiatric conditions such as hyperactivity, dementia and schizophrenia Roizen and Fleisher (1997). Young roots are eaten like a vegetable (with a peppery flavor) and shoots as salad. It is also considered to be effective in healing asthmatic cough, gastrointestinal disorder and whooping cough.
2. Materials And Methods
Materials: The seeds of Oenothera biennis L. were obtained from Dr. Yashwant Singh Parmar University of Horticulture and Forestry, Nauni, Solan (HP). Experiments were conducted in the Botany laboratory and nursery area of Shoolini University of Biotechnology and Management Sciences, Solan.
Experimental Set-Up: Surface sterilization of seeds of Oenothera biennis L. was done with 0.1% HgCl2, rinsed three times with distilled water prior to sowing. Seeds were sown in nursery beds (10×1m) during the month of September in the Herbal Garden of Shoolini University, Solan (latitude 30°51'N, longitude 77°07 'E and altitude 1195 m), where the average annual rainfall was 1315.6 mm. The average maximum and minimum temperatures were 32°C and 2°C, respectively. When the first three leaves appeared, the seedlings were transferred to the ceramic pots of fixed capacity (25 cm diameter). The pots were filled with 7 kg uniform soil mixture containing soil: sand in 2:1 ratio. Three seedlings per pot were transplanted but after some days the seedlings were thinned to two seedlings per pot. Plants were irrigated daily with Hoagland’s solution for one month before carrying the experiment and during experiment solution was given weekly. For each treatment 60 plants were selected. Destructive and non-destructive sampling was done for analyses. For non-destructive observations pots were marked randomly within a treatment. Destructive observations were taken in triplicate at an interval of 30, 60, 90,120,150,180 and 210 days. Each experiment was replicated thrice. The pots were arranged in a completely randomized design and the position of the pots was changed weekly to avoid position effect.
Water-deficit and salt stress were induced after one month of transplanting the plants to pots, when the plant adapted in pots. Water-deficit experiment was conducted by gravimetric method in which initially soil water potential was maintained by tensiometer. The water potential was maintained at -0.01, -0.03, -0.05 and -0.07 M Pa. Drought stress was imposed by watering while weighing method was used to control water potential to meet the experimental requirements. The gravimetric determination of water content by weighing soil samples before and after oven drying to constant weight at 80 °C was used to calibrate all measurement of the water potential of soil in pots. A preliminary experiment to select different stress levels in both stresses showed that seedling failed to survive at water potential beyond -0.07 MPa and 100 m MNacl . Therefore, different stress levels from water potentials -0.01 to -0.07 MPa were selected for the experiment. For salt stress, potted plants were given 50 ml of fixed quantity of solution (25 mM, 50 mM, 75 mM and 100 mM NaCl) after one week. After an interval of 30, 60, 90, 120, 150, 180 and 210 days of applying stresses (water and salt), the plants were analysed for morphological features viz plant height, number of leaves, leaf area, stem diameter, number of nodes, number of flowers, seed yield and root length. Untreated and stress-treated plants were kept under natural photoradiation.). Shoot length was measured starting exactly above the root-shoot junction respectively of the randomly selected plant. For the purpose of measurement of total root length, plants were dug out along with huge mass of soil. Soil masses were washed with tap water. Care was taken to wash all root systems in the same way (i.e., using the same spatial washing pattern and total washing time). The root system was placed on a clear plastic sheet and the total root length was determined by measuring tape. Leaf number per plant was measured accurately, stem diameter (by digital caliper) and seed yield was calculated after 210 days of stresses per pot (gm). Leaf Area measurements were taken on five leaves per treatment. For measuring leaf area fully expanded leaf was selected and leaf area was measured with leaf area meter LI-3100C.
3. Results And Discussion
Under both stress conditions i.e, in water deficit and salinity stress, plant height was maximum in untreated plants in all growth stages. It was found to be inhibited by 27.2% in -0.01 M Pa; by 36.3% in -0.03 M Pa; by 43.1% in -0.05 M Pa and by 53.4% in -0.07 M Pa. Under salinity stress, plant height was found to be inhibited by 20.4% in 25 mM NaCl; by 34.09 % in 50 mM NaCl; by 47.7% in 75 mM and 56.8% in 100 mM NaCl after 210 days (Fig. 1 (A, B) and Table 1). Minimum decrease was found in 25 mM NaCl and maximum decrease in plant height was found in 100 mM NaCl. It had been established that drought stress during initial phase of plant growth and establishment affects both elongation and expansion of cells and thereby reduce plant height growth Anjum et al. (2003), Shao et al. (2008). In Vigna subterranea plant height reduced significantly in water stressed plants compared to non-stressed plants Vurayai et al. (2011). Similarly plant height decreased significantly in Oryza sativa Bakul et al. (2009), Glycine max Specht et al. (2001) and Gossypium hirsutum Burke et al. (1995) under water deficit conditions. Similar results were found under salinity stress in Catharanthus roseus Jaleel et al. (2007), Aloe vera Moghbeli et al. (2012); Lycopersicon llycopersicum Ztekin and Tuzel (2011), Leptochloa fusca Abd-Elbar et al. (2012) and Echinacea purpurea Miri and Mirjalili (2013). This reduction was closely linked to slower cell production and development of smaller stems Dadkhah, (2010).
As expected, a progressive increase in number of leaves was noted in the vegetative stage with growth of plants. After seed set there was no increase in number of leaves. The treated plants exhibited less number of leaves with an increase in stress concentrations in comparison to untreated plants as shown in Fig. 2 (A-B) and Table 1. After 210 days the number of leaves decreased by 18.75% in -0.01 M Pa (minimum decrease); by 25% in -0.03 M Pa; by 48.75% in- 0.05 M Pa; by 55% in -0.07 M Pa; by 15% in 25 mM NaCl; by 28.7% in 50 mM NaCl; by 47.5% in 75 mM NaCl and by 62.5% in 100 mM NaCl. Reduction in leaf number under extreme water deficit may be due to reduction in leaf formation which ultimately leads to reduction in transpiration, hence water loss. Similar results were observed in Mangifera indica rootstock, which showed a decline in number of leaves due to drying or senescence of lower mature leaves Luvaha et al. (2008).
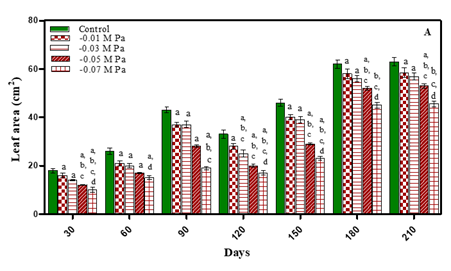
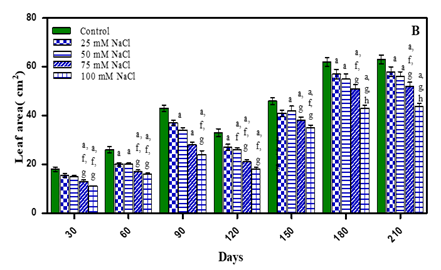
A progressive increase in leaf area was noted during different growth stages but when the plants bolted new leaves area was comparatively less initially but then increased with age of plant. The treated plants exhibited reduced leaf area with an increase in stress concentration as shown in Fig. 3(A-B) and Table 1. Leaf area after 210 days decreased with increasing concentration of stress i.e., by 7.9% in -0.01 M Pa (minimum decrease); by 11.1% in -0.03 M Pa; by 17.4% in- 0.05 M Pa; by 28.5% in -0.07 M Pa; by 9.5% in 25 mM NaCl; by 12.6% in 50 mM NaCl; by 19.04% in 75 mM NaCl and by 31.7 % in 100 mM NaCl (maximum decrease). Similar results were observed under drought stress in Abelmoschus esculentum Bhatt and Srinivas Rao (2005). Reddy et al. (2004) reported that the number of leaves per plant and leaf size reduced in decreasing soil water potential. They attributed that leaf area expansion depends on leaf turgor, temperature and assimilates supply for growth, which are affected by drought. In Aloe vera Moghbeli et al. (2012), Lycopersicon esculantum Oztekin and Tuzel (2011) and five Coleus spp. Kotagiri and Kolluru (2017) salinity decreased number of leaves with an increase in salinity.
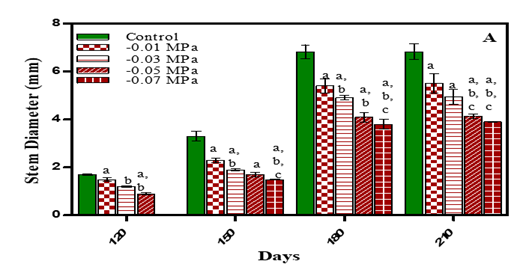
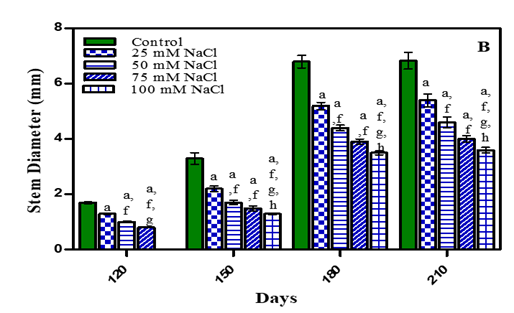
Stem diameter results are given in Fig. 4. (A, B) and Table 1. Stem diameter was maximum in untreated plants. In 210 days, plants it was less by 19.3% in -0.01 M Pa (minimum decrease); by 27.6% in -0.03 M Pa; by 39.5% in -0.05 M Pa and 42.6% in -0.07 M Pa when compared with control. In salinity stress plants the stem diameter reduced by 20.5% in 25 mM NaCl; by 32.3% in 50 mM NaCl; by 41.1% in 75 mM NaCl and by 47% in 100 mM NaCl (maximum decrease) when compared to control. Similar results were noticed in Solanum melongena, Mangifera indica, Ocimum basilicum (purple basil) Kirnak et al. (2001), Luvaha et al. (2008), Alishah et al. (2006). Under salinity stress, Raphanus sativus seedlings Cavusoglu et al. (2008) and Brassica napus plants, with increasing salinity level, the stem diameter decreased El-Hadidi et al. (2007).
Total number of nodes decreased and the effect intensified with an increase in stress concentrations. Total number of nodes decreased on 210 days by 17.3% in -0.01 M Pa (minimum decrease); by 40.3% in -0.03 M Pa; by 57.6% in -0.05 M Pa and by 61.5% in -0.07 M Pa under water deficit conditions. In case of salinity stress the decrease in number of nodes was 21.1% in 25 mM NaCl; 42.3% in 50 mM NaCl; 59.6% in 75 mM NaCl and 65% in 100 mM NaCl (maximum decrease) as given in Fig.5 (A-B) and Table 1. In Medicago sativa Rostami and Yazdi (1989) and Glycine max Daneshian et al. (2010) the number of nodes also decreased with an increase in drought stress. The reduction in number of nodes due to stress is responsible for reduction in plant growth. In two Vigna subterranea genotypes number of nodes decreased with salinity as compared to control Najafian et al. (2008).
Flowering is sensitive to water stress, probably due to susceptibility of pollen development, anthesis and fertilization leading to lower seed yield Champolivier and Merrin (1996), Farji et al. (2009). Limitation of water at flowering stage not only reduced flower formation but also increased flower shedding Vijitha and Mahendran (2010). Flowering in O. biennis L. plants initiated by 180 days. By 210 days of growth number of flowers were maximum in untreated plants. In treated plants it was less by 29.6% in -0.01 M Pa (minimum decrease); by 48.1% in -0.03 M Pa; by 62.9% in -0.05 M Pa and by 70.3% in -0.07 M Pa. In salinity stress treated plants, number of flowers reduced by 37 % in 25 mM NaCl; by 51.8 % in 50 mM NaCl; by 66.6% in 75 mM NaCl and by 74.07% in 100 mM NaCl (maximum decrease) as is evident from Fig. 6 (A, B) and Table 1. Sionit and Kramer (1977) found that subjecting Glycine max to water stress during flower induction shortened the flowering period and caused flower fall. In Brassica napus under salinity stress number of flowering branches decreased with increasing salinity stress El-Hadidi et al. (2007).
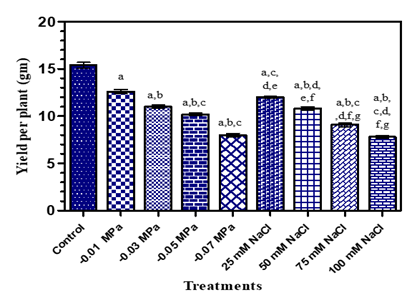
Crop yield in the plants under stress is the result of the combined effects on growth, photosynthesis, respiration, metabolic processes, reproduction and other physiological and metabolic processes Vijitha and Mahendran (2010). In the present study, a decreasing trend in seed yield was observed under both stress conditions with an increase in concentration of treatments (Fig.7, Table1). Water stress occurring at any time during growth of plant result in a drastic reduction in seed yield. Reduction in seed yield due to water deficit was observed in Brassica napus Gan et al. (2004) and Helianthus annuus Pourtaghi et al. (2011). Similar results were obtained in Silybum marianum and Trachyspermum ammi Said-Al Ahl and Omer (2011) in salinity stress plants. According to Flowers et al. (1977), Lauchli and Luttge (2002) and Liu et al. (2006) the reduction in yield under salinity stress could be due to reduction in photosynthesis, disturbance iin mineraluptake, protein synthesis or carbohydrates metabolism. In addition, the yield may be reduced due to decrease in xylem and phloem tissue thickness, resulting in lower accumulation of water necessary for photosynthesis and slow translocation of photosynthesis towards the developing seeds El-Hadidi et al. (2007).
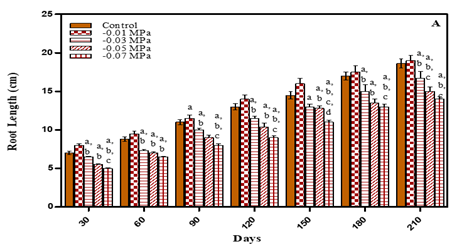
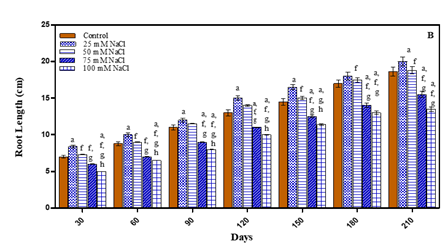
Besides shoots and leaves, root growth is also an important parameter for plant tolerance to drought stress, as roots are the main engine for meeting transpiration demand and play an important role in making water and nutrient available to plants Huang and Gao (1999). After 210 days the low stress concentrations showed more increase in root length in comparison to untreated plants. The root length increased by 2.1% in case of -0.01 M Pa; by 7.5% in 25 mM NaCl and by 1.0% in 50 mM NaCl. However, at higher stress concentrations the treated plants exhibited reduced root length. In case of water deficit treated plants the root length decreased in- 0.03 M Pa by 10.2%; in -0.0 5 M Pa by 19.3%; and in -0.07 M Pa by 24.7%. In 75 mM NaCl the root length decreased by 16.6% and in 100 mM NaCl by 27.4% in comparison to untreated plants as is evident from Fig. 8 (A-B) and Table 1. The decline in root length in response to water-deficit is attributed to either decrease in cell elongation resulting from the inhibitory effect of water shortage on growth promoting hormones which, in turn, lead to decrease in cell turgor, cell volume and eventually cell growth Banon et al. (2006). Root length in seven Lycopersicon esculentum cultivars decreased under water deficit Nahar and Gretzmacher (2011). Nayar and Gupta (2006) also reported that drought stress decreased the root length in Triticum aestivum and Zea mays. Salinity result in reduction of water absorbance, so, cell division and differentiation reduce and reduction of root length is explainable Keshavarzi (2011). In Catharanthus roseus, Withinia somnifera and Salvodora persica root length was reduced with increase in salinity comparison to untreated plants Jaleel et al. (2008).
Statistical Analysis: Data were analyzed using ANOVA (one way / two ways) using Graph Pad Prism®. Mean + SE values calculated for Oenothera biennis L. samples and the significance of the data was tested using Tukey’s multiple comparison test / Bonferroni’s multiple comparison test (P < 0.05).
Conclusions: The results obtained from the present study revealed that water and salinity stress negatively affect Oenothera plants growth, where the response varied depending upon different concentrations of stresses, as at lower stress conditions at -0.01 M Pa,-0.03 MPa, 25 mM and 50 mM salt concentrations have encountered negligible detrimental effect; other higher treatments reveal a significant decrease in growth and development. Therefore, further investigation into the properties demonstrate that plant is tolerant to low stress conditions and hence, stress tolerant species can be developed through extensive screening procedures or by applying genetic engineering methods if investigated further.
Acknowledgements: The author is highly thankful to the Shoolini University of Biotechnology and Management Sciences,Solan for providing the lab facilities and facilitating the research work.
Figure 1
|
|
|
Figure 1 Plant height (cm) of O. biennis L. on Different
Days Under Two Stress Conditions i.e., Water Deficit (A) and NaCl (B). Values
are mean ± SE; n=6. ap <0.05 vs control,bp<0.05
vs-0.01 M Pa,cp<0.05 vs-0.03 M Pa, dp<0.05 vs -0.05 M ep<0.05 vs -0 .07 M Pa, fp <0.05 vs 25 mM NaCl, gp<0.05
vs 50 mM NaCl,hp<0.05 vs 75 mM NaCl, ip<0.05 vs 100 mM NaCl; analysed by Two-way ANOVA
followed Bonferroni’s Multiple Comparison Test. |
Figure 2
|
Figure 2 Number of leaves of O. biennis L. on Different
Days Under Two Stress Conditions i.e., Water Deficit (A) and NaCl (B). Values are mean ± SE; n=6. ap <0.05 vs Control, bp< 0.05 vs
-0.01 M Pa, cp<0.05 vs -0.03 M Pa, dp<0.05 vs
-0.05 M Pa, ep<0.05 vs -0 .07 MPa, fp<0.05 vs
25 mM NaCl, gp<0.05 vs 50 mM NaCl, hp <0.05 vs 75 mM NaCl, ip<0.05 vs 100mM NaCl; Analysed by Two-way ANOVA
followed by Bonferroni’s Multiple Comparison Test. |
Figure 3
|
Figure 3 Leaf area (cm2) of O. biennis L. on Different
Days Under Two Stress Conditions i.e., Water Deficit (A) and NaCl (B). Values are mean ± SE; n=6. ap <0.05 vs Control,
bp<0.05 vs -0.01 M Pa, cp<0.05 vs-0.03 M Pa, dp<0.05
vs -0.05 M Pa, ep<0.05 vs -0.07 M, fp<0.05 vs
25 mM NaCl, gp<0.05 vs 50 mM NaCl, hp<0.05 vs
75 mM NaCl, ip <0.05 vs 100 mM NaCl; Analysed by
Two-way ANOVA followed by Bonferroni’s Multiple Comparision
Test. |
Figure 4
|
Figure 4 Diameter of stem of O. biennis L. on Different Days Under Two Stress Condition i.e., Water deficit
(A) and NaCl (B). Values are mean ± SE;
n=6. ap < 0.05 vs Control, bp<0.05 vs -0.01 M Pa, cp<0.05 vs -0.03 M
Pa,dp<0.05 vs –0.05 M Pa,ep<0.05 vs-0.07 MPa,fp<0.05 vs 25 mM NaCl,gp<0.05vs 50 mM NaCl, hp<0.05 vs75 mM NaCl, ip<0.05 vs
100 mM NaCl analysed by Two-way ANOVA Followed by Bonferroni’s Multiple
Comparison Test. |
Figure 5
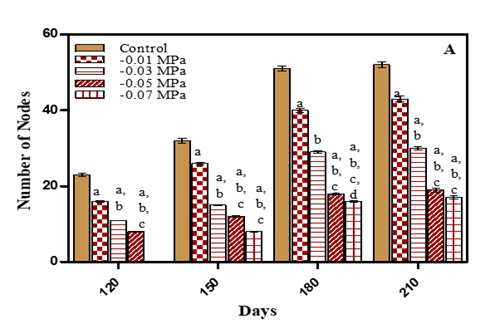
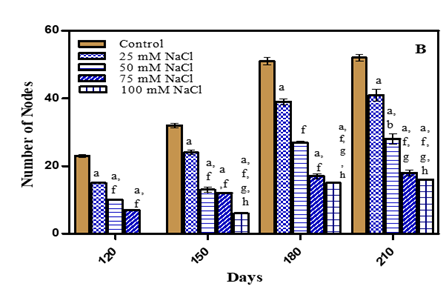
|
Figure 5 Number of nodes of O. biennis on Different Days Under Two Stress Conditions i.e. Water deficit (A) and NaCl (B). Values are mean ± SE; n=6. ap<0.05 vs control, bp<0.05 vs- 0.01 M Pa, cp<0.05 vs-0.03 M Pa, dp<0.05 vs -0.05 M Pa, ep<0.05 vs -0.07 MPa, fp<0.05 vs 25 mM NaCl, gp<0.05 vs 50 mM NaCl, hp<0.05 vs75 mM NaCl, ip<0.05 vs 100 mM NaCl; Analysed by Two-way ANOVA followed by Bonferroni’s Multiple Comparison Test. |
Figure 6
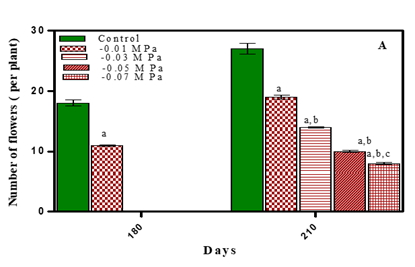
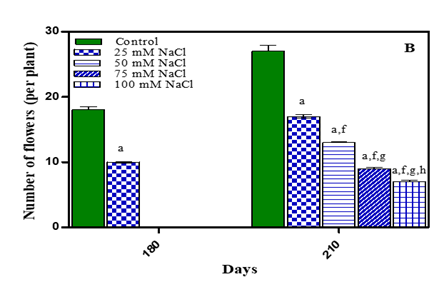
|
Figure 6 Numbers
of Flowers of O. biennis on Different Days Under Two
Stress Conditions i.e.waterdeficit (A) and NaCl (B). Values are mean± SE; n=6.ap <0.05 vs Control,
bp<0.05 vs -0.01 M Pa, cp<0.05 vs -0.03 M Pa, dp<0.05
vs –0.05 M Pa, ep < 0.05 vs -0.07 MPa, fp<0.05
vs 25 mM NaCl, gp<0.05 vs 50 mM NaCl, ip<0.05 vs 100 mM NaCl; analysed by Two-way ANOVA
followed by Bonferroni’s Multiple Comparison test. |
Figure 7
|
Figure 7 Seed yield of O. biennis L. Under two Stress Conditions i.e., Water Deficit and Salinity Stress. Values are mean ± SE; n=6. ap <0.05 vs Control, bp<0.05 vs -0.01 M Pa, cp<0.05 vs -0.03 M Pa, dp <0.05 vs -0.05 MPa, ep<0.05 vs -0.07 MPa, fp<0.05 vs 25 mM NaCl, gp<0.05 vs 50 mM NaCl, hp<0.05 vs 75Mm NaCl; ip<0.05 vs 100 mM NaCl; analysed by One-way ANOVA followed by Tukey’s Multiple Comparison Test. |
Figure 8
|
Figure 8 Root length of O. biennis on Different days
Under Two Stress
Conditions i.e., water Deficit (A) and NaCl (B).Values are mean ±SE;
n=6.ap<0.05 vs Control, bp<0.05 vs-0.01M Pa,cp<0.05
vs -0.03 MPa dp<0.05 vs-0.05 M Pa,ep<0.05 vs-0.07 MPa,fp<0.05
vs 25mM NaCl, gp<0.05vs 50 mM NaCl,hp<0.05 vs 75 mM NaCl,ip<0.05
vs 100 mM NaCl; analysed by
Two-way ANOVA followed by Bonferroni’s Multiple Comparison test. |
Table 1
|
Table 1 Growth in O. biennis L. at Different Growth Stages Under Water Deficit and Salinity Stress; Values are mean ± S.E. n=6 |
||||||||||||
|
S. No. |
Parameter |
Growth Stages |
Treatments |
|||||||||
|
|
Control |
-0.01 |
-0.03 MPa |
-0.05 MPa |
-0.07 |
25 mM |
50 mM |
75 mM |
100mM |
|||
|
|
MPa |
MPa |
NaCl |
NaCl |
NaCl |
NaCl |
||||||
|
1 |
Plant height |
120 |
21.0±1.0 |
18.0±0.2 |
15.0±0.1 |
12.0±0.2 |
4.0±0.2 |
19.0±0.5 |
15.0±0.2 |
10.0±0.21 |
3.0±0.2 |
|
|
|
(cm) |
150 |
38.0±1.85 |
29.0±1.3 |
23.0±0.9 |
20.0±1.2 |
16.0±0.6 |
32.0±1.9 |
28.0±0.9 |
19.0±0.47 |
16.0±0.7 |
|
|
|
180 |
85.0±2.8 |
62.0±2.9 |
53.0±1.9 |
47.0±2.6 |
39.0±1.6 |
67.0±6.1 |
56.0±3.6 |
44.0±2.7 |
36.0±1.9 |
||
|
|
210 |
88.0±3.4 |
64.0±3.2 |
56.0±2.5 |
50.0±3.2 |
41.0±2.3 |
70.0±3.6 |
58.0±4.8 |
46.0±3.9 |
38.0±2.6 |
||
|
2 |
Number of |
30 |
36.0±1.0 |
25.0±0.3 |
21.0±0.4 |
19.0±0.5 |
16.0±0.9 |
24.0±0.5 |
19.0±0.3 |
18.0±0.21 |
14.0±0.2 |
|
|
|
leaves |
60 |
53.0±2.3 |
40.0±1.6 |
30.0±0.5 |
25.0±1.2 |
18.0±1.2 |
38.0±1.5 |
30.0±0.7 |
27.0±0.5 |
17.0±0.5 |
|
|
|
90 |
62.0±3.1 |
45.0±2.3 |
42.0±1.0 |
28.0±2.3 |
20.0±2.3 |
49.0±2.0 |
38.0±2.8 |
30.0±1.2 |
20.0±0.7 |
||
|
|
120 |
70.0±4.2 |
50.0±4.0 |
45.0±2.3 |
30.0±2.8 |
22.0±2.8 |
57.0±2.9 |
40.0±3.8 |
32.0±2.4 |
22.0±0.9 |
||
|
|
150 |
78.0±4.5 |
55.0±4.5 |
48.0±3.1 |
32.0±3.1 |
24.0±3.1 |
60.0±3.1 |
47.0±3.2 |
33.0±2.1 |
24.0±1.6 |
||
|
|
180 |
82.0±5.1 |
59.0±5.0 |
50.0±3.5 |
38.0±3.4 |
29.0±3.4 |
66.0±3.4 |
48.0±3.3 |
36.0±3.2 |
25.0±2.3 |
||
|
|
210 |
83.0±4.1 |
60.0±5.7 |
51.0±3.0 |
40.0±2.7 |
30.0±2.7 |
68.0±2.9 |
49.0±2.5 |
38.0±1.9 |
26.0±1.3 |
||
|
3 |
Leaf area |
30 |
18.0±0.9 |
16.0±0.8 |
14.0±0.2 |
12.0±0.9 |
10.0±0.8 |
15.5±0.8 |
15.0±.0.6 |
13.0±0.5 |
11.0±0.24 |
|
|
|
(cm2) |
60 |
26.0±1.3 |
21.0±0.9 |
20.0±0.9 |
17.0±1.0 |
15.0±0.9 |
20.0±0.9 |
20.0±0.9 |
17.0±0.9 |
16.0±0.5 |
|
|
|
90 |
28.0±1.2 |
37.0±1.0 |
37.0±1.5 |
28.0±1.2 |
19.0±1.1 |
37.0±1.2 |
34.0±2.0 |
28.0±1.6 |
24.0±1.6 |
||
|
|
120 |
33.0±1.6 |
28.0±1.2 |
25.0±1.2 |
20.0±1.4 |
17.0±1.2 |
27.0±1.5 |
26.0±1.5 |
21. 0±1.3 |
18.0±1.2 |
||
|
|
150 |
46.0±1.4 |
40.0±1.3 |
39.0±1.4 |
29.0±1.5 |
23.0±1.3 |
41.0±1.8 |
42.0±1.6 |
38.0±1.5 |
35.0±1.3 |
||
|
|
180 |
62.0±2.0 |
58.0±1.7 |
56.0±1.6 |
52.0±1.5 |
45.0±1.4 |
57.0±1.6 |
55.0±1.7 |
51.0±1.6 |
43.0±1.4 |
||
|
|
210 |
63.0±2.1 |
59.0±1.8 |
57.0±1.4 |
53.0±1.6 |
46.0±1.2 |
58.0±1.8 |
56.0±1.7 |
52.0±1.6 |
44.0±1.4 |
||
|
4 |
Stem diameter |
120 |
1.70±0.03 |
1.50±0.02 |
1.20±0.01 |
0.90±0.01 |
0.0±0.0 |
1.30±0.06 |
1.0±0.02 |
0.80±0.01 |
0.0±0.0 |
|
|
|
(mm) |
150 |
3.30±0.2 |
2.30±0.1 |
1.90±0.08 |
1.70±0.05 |
1.5±0.09 |
2.20±0.09 |
1.7±0.05 |
1.50±0.08 |
1.3±0.05 |
|
|
|
180 |
6.80±0.3 |
5.40±0.2 |
4.90±0.2 |
4.10±0.09 |
3.7±0.1 |
5.20±0.3 |
4.4±0.09 |
3.90±0.3 |
3.5±0.2 |
||
|
|
210 |
6.83±0.4 |
5.51±0.3 |
5.51±0.5 |
4.13±0.3 |
3.9±0.2 |
5.40±0.4 |
4.6±0.2 |
4.00±0.8 |
3.6±0.4 |
||
|
5 |
Number |
120 |
23.0±0.3 |
16.0±0.1 |
11.0±0.3 |
8.0±0.2 |
0.0±0.0 |
15.0±0.3 |
10.0±0.2 |
7.0±0.06 |
0.0±0.0 |
|
|
|
of nodes |
150 |
32.0±0.7 |
26.0±0.5 |
15.0±0.9 |
12.0±0.4 |
8.0±0.1 |
24.0±0.6 |
13.0±0.3 |
12.0±0.8 |
6.0±0.3 |
|
|
|
180 |
51.0±1.6 |
40.0±1.4 |
29.0±1.4 |
18.0±0.6 |
16.0±0.3 |
39.0±1.2 |
27.0±1.0 |
17.0±1.0 |
15.0±0.5 |
||
|
|
210 |
52.0±2.6 |
43.0±2.1 |
30.0±2.1 |
19.0±1.0 |
17.0±0.4 |
41.0±2.0 |
28.0±2.1 |
18.0±1.2 |
18.0±0.8 |
||
|
6 |
Number of flowers |
180 |
18.0±0.50 |
11.0 ±0.0 |
0.0±0.0 |
0.0±0.0 |
0.0±0.0 |
0.0±0.0 |
0.0±0.0 |
0.0±0.0 |
0.0±0.0 |
|
|
|
210 |
27.0±0.9 |
19.0±0.5 |
14.0±0.2 |
10.0±0.2 +++++++++++++++++++++++++++++++++++++++++++++---------- |
8.0±0.1 |
17.0±0.4 |
13.0±0.2 |
9.0±0.1 |
7.0±0.09 |
||
|
7 |
Seed yield (per plant |
210 |
15.4±0.3 |
12.6±0.2 |
11.0±0.1 |
10.2±0.1 |
8.0±0.09 |
12.0±0.3 |
10.8±0.2 |
9.1±0.1 |
7.8±0.09 |
|
|
8 |
Root length (cm) |
30 |
7.0±0.2 |
8.0±0.16 |
6.5±0.2 |
5.4±0.1 |
5.0±0.2 |
8.4±0.3 |
7.3±0.3 |
6.0±0.2 |
5.0±0.3 |
|
|
|
60 |
9.5±0.26 |
9.5±0.2 |
7.3±0.2 |
7.0±0.2 |
6.5±0.25 |
10.0±0.5 |
9.0±0.5 |
7.0±0.3 |
6.5±0.5 |
||
|
|
90 |
11.0±0.3 |
11.5±0.3 |
10.0±0.2 |
9.0±0.3 |
8.0±0.3 |
12.0±0.7 |
11.5±1.0 |
9.0±0.4 |
8.0±0.3 |
||
|
|
120 |
13.0±0.6 |
14.0±0.5 |
11.5±0.3 |
10.4±0.5 |
9.0±0.5 |
15.0±0.8 |
14.0±0.9 |
11.0±0.5 |
10.0±0.6 |
||
|
|
150 |
14.5±0.5 |
16.0±0.4 |
13.0±0.4 |
12.8±0.6 |
11.0±0.7 |
16.5±0.9 |
15.0±1.2 |
12.5±0.6 |
11.4±0.7 |
||
|
|
180 |
17.0±1.0 |
17.5±0.7 |
15.0±0.5 |
13.5±0.7 |
13.0±0.8 |
18.0±1.0 |
17.5±1.1 |
14.0±0.8 |
13.0±0.8 |
||
|
|
210 |
18.6±1.1 |
19.0±0.9 |
16.7±0.6 |
15.0±0.9 |
14.0±0.9 |
20.0±1.2 |
18.8±1.4 |
15.5±1.0 |
13.5±1.0 |
||
CONFLICT OF INTERESTS
None.
ACKNOWLEDGMENTS
None.
REFERENCES
Abd Elbar, O., Rehman, H., Farag, E., Eisa, S. S., & Habib, S. A. (2025). Morpho-Anatomical Changes in Salt Stressed Kallar Grass (Leptochloa fusca L.). Research Journal of Agricultural and Biological Sciences, 8(2), 158–166.
Alishah, H. M., Heidari, R., Hassani, A., & Diazaji, A. A. (2024). Effect of Water Stress on Some Morphological and Biochemical Characteristics of Purple Basil (Ocimum basilicum). Journal of Biological Sciences, 6(4), 763–767. https://doi.org/10.3923/jbs.2006.763.767
Anjum, F., Yaseen, M., Rasul,
E., Wahid, A., & Anjum, S. (2025). Water Stress in Barley (Hordeum
vulgare L.) : Effect on
Chemical Composition and Chlorophyll Contents.
Pakistan Journal of Agricultural Sciences, 40, 45–49.
Bakul, M. R. A., Akter, M. S., Islam, M. N., Chowdhary, M. M. A. A., & Amin, M. H. A. (2024). Water Stress Effect on Morphological Characters and Yield Attributes in Some Mutants T-Aman Rice Lines. Bangladesh Research Publications Journal, 3(2), 934–944.
Banon, S., Ochoa, J., Franco, J. A., Alarcon, J. J., & Sanchez-Blanco, M. J. (2025). Hardening of Oleander Seedlings by Deficit Irrigation and Low Air Humidity. Environmental and Experimental Botany, 56(1), 36–43. https://doi.org/10.1016/j.envexpbot.2004.12.004
Bassi, N., Kumar, M. D., Sharma, A., & Pardha‐Saradhi, P. (2024). Status of Wetlands in India: A Review of Extent, Ecosystem Benefits, Threats and Management Strategies. Journal of Hydrology: Regional Studies, 2, 1–19. https://doi.org/10.1016/j.ejrh.2014.07.001
Burke, J. J., Gamble, P. E., Hatfield, J. L., & Queensberry, J. E. (2024). Plant Morphological and Biochemical Responses To Field Water Deficits: I. Responses of Glutathione Reductase Activity and Paraquat Sensitivity. Plant Physiology, 79, 415–419. https://doi.org/10.1104/pp.79.2.415
Cavusoglu, K., Kilic, S., & Kabar, K. (2025). Effect of Some Growth Regulators on Stem Anatomy of Radish Seedlings Grown Under Saline (NaCl) Conditions. Plant, Soil and Environment, 54(10), 428–433. https://doi.org/10.17221/405-PSE
Champolivier, L., & Merrin, A. (2024). Effect of Water Stress Applied at Different Growth Stages to Brassica Napus L. Var. Oleifera on Yield, Yield Components and Seed Quality. European Journal of Agronomy, 5, 153–160. https://doi.org/10.1016/S1161-0301(96)02004-7
Dadkhah, A. R. (2025). Effect of Salt Stress on Growth and Essential Oil of Matricaria Chamomilla. Research Journal of Biological Sciences, 5(10), 643–646. https://doi.org/10.3923/rjbsci.2010.643.646
Daneshian, J., Jonoubi, P., & Barari Tari, D. (2024). Investigation of Water Deficit Stress on Agronomical Traits of Soybean Cultivars in Temperate Climate. International Journal of Agricultural and Biological Sciences, 1(2), 75–83.
Deng, Y., Hua, H. M., Li, J., & Lapinskas, P. (2025). Studies on Cultivation and Use of Evening Primrose (Oenothera spp.) in China. Economic Botany, 55, 83–92. https://doi.org/10.1007/BF02864548
El-Hadidi, M., Abo-El-Kheer, A. M., Sakr, M. T., & Farouk, S. (2024). Structural and Physiological Studies and Oil Constituents of Canola Plants Under Salinity Condition: 4–Growth, Yield and its Components as Well as Stem Structure. African Crop Science Conference Proceedings, 8, 1679–1684.
Faraji, A., Lattifi, N., Soltani, A., & Shirani-rad, A. H. (2025). Seed Yield and Water Use Efficiency of Canola (Brassica napus L.) As Affected by High Temperature Stress and Supplemental Irrigation. Agricultural Water Management, 96, 132–140. https://doi.org/10.1016/j.agwat.2008.07.014
Flowers, T. J., Troke, P. F., & Yeo, A. R. (2024). Mechanism of Salt Tolerance in Halophytes. Annual Review of Plant Physiology, 28, 89–112. https://doi.org/10.1146/annurev.pp.28.060177.000513
Gan, Y., Angadi, S. V., Cutforth, H., Angadi, V. V., & McDonald, C. L. (2024). Canola and Mustard Response to Short Periods of Temperature and Water Stress at Different Developmental Stages. Canadian Journal of Plant Science, 84, 697–704. https://doi.org/10.4141/P03-109
Huang, B., & Gao, H. (2025). Gas Exchange and Water Relations of Diverse Tall Fescue Cultivars in Response to Drought Stress. HortScience, 34, 490. https://doi.org/10.21273/HORTSCI.34.3.490C
Jaleel, C. A., Gopi, R., Manivannan, P., & Panneerselvam, R. (2024). Responses of Antioxidant Defense System of Catharanthus roseus (L.) G. Don to Paclobutrazol Treatment Under Salinity. Acta Physiologiae Plantarum, 29(3), 205–209. https://doi.org/10.1007/s11738-007-0025-6
Jaleel, C. A., Sankar, B., Sridharan, R., & Panneerselvam, R. (2025). Soil Salinity Alters
Growth, Chlorophyll Content
and Secondary Metabolite
Accumulation in Catharanthus Roseus.
Turkish Journal of Biology, 32, 79–83.
Keshavarzi, M. H. B. (2024). Effect
of Salt Stress on Germination and Early Seedling Growth of Savory (Satureja Hortensis). Australian Journal of
Basic and Applied Sciences, 5(12), 3274–3279.
Kirnak, H., Kaya, C., Tas, I., & Higgs, D. (2025). The Influence of Water Deficit on Vegetative Growth, Physiology, Fruit Yield and Quality in Eggplants. Bulgarian Journal of Plant Physiology, 27(3), 34–46.
Kotagiri, D., & Kolluru, V. C. (2024). Effect of Salinity Stress on the Morphology & Physiology of Five Different Coleus species. Biomedical and Pharmacology Journal, 10, 1639–1649. https://doi.org/10.13005/bpj/1275
Lauchli, A., & Lüttge, U. (2025). Environment-Plants-Molecules (pp. 315–339). Kluwer Academic Publishers.
Liu, X., Duan, D., Li, W., Tadano, T., & Khan, A. (2024). A Comparative Study on Responses of Growth and Solute Composition in Halophytes Suaeda salsa and Limonium bicolor to salinity. In M. A. Khan & D. J. Weber (Eds.), Ecophysiology of high salinity tolerant plants (pp. 135–143). Springer. https://doi.org/10.1007/1-4020-4018-0_9
Luvaha, E., Netondo, G. W., & Ouma, G. (2025). Effect of Water Deficit on the Physiological and Morphological Characteristics of Mango (Mangifera indica) Rootstock Seedlings. American Journal of Plant Physiology, 3, 1–15. https://doi.org/10.3923/ajpp.2008.1.15
Miri, Y., & Mirjalili,
S. A. (2024). Effects of Salinity Stress on Seed
Germination and Some Physiological
Traits in Primary Stages of Growth
in Purple Coneflower (Echinacea purpurea). International Journal of Agronomy, 4(1), 142–146.
Moghbeli, E., Fathollahi, S., Salari,
H., Ahmadi, G., Saliqehdar, F., & Safari, A.
(2025). Effect of Salinity Stress on Growth and Yield of Aloe Vera L. Journal of Medicinal
Plants Research, 6(16), 3272–3277.
Nahar, K., & Gretzmacher, R. (2024). Effect of Water Stress on Nutrient Uptake, Yield and Quality of Tomato (Lycopersicon Esculentum Mill.) Under Subtropical Conditions. Die Bodenkultur, 53(1), 45–51.
Najafian, S., Rahemi, M., & Tavallali, V. (2024). Growth and Chemical Composition of Hybrid GF 677 (Prunus Amygdalus × Prunus Persica) Influenced by Salinity Levels of Irrigation Water. Asian Journal of Plant Sciences, 7(3), 309–313. https://doi.org/10.3923/ajps.2008.309.313
Nayar, H., & Gupta, D. (2025). Differential Sensitivity of C3 and C4 Plants to Water Deficit Stress: Association With Oxidative Stress and Antioxidants. Environmental and Experimental Botany, 58, 106–113. https://doi.org/10.1016/j.envexpbot.2005.06.021
Oztekin, G. B., & Tuzel, Y. (2024). Comparative Salinity Responses
Among Tomato Genotype and Rootstocks. Pakistan
Journal of Botany, 43(6), 2665–2672.
Pourtaghi, A., Darvish, F., Habibi, D., Nourmohammadi, G., & Daneshian, J. (2025). Effect of Irrigation Water Deficit on Antioxidant Activity and Yield of sOme Sunflower Hybrids. Australian Journal of Crop Science, 5(2), 197–204.
Reddy, A. R., Chaitanya, K. V., & Vivekanandan, M. (2024). Drought-Induced Responses of Photosynthesis and Antioxidant Metabolism in Higher Plants. Journal of Plant Physiology, 161, 1189–1202. https://doi.org/10.1016/j.jplph.2004.01.013
Roizen, M. F., & Fliesher, L. A. (2025). Essence of Anesthesia Practice (3rd ed., p. 591). Elsevier Saunders.
Rostami, M. A., & Yazdi Samadi,
B. (2024). Drought
Resistance Evaluation and the Responses of Alfalfa Cultivars Under Normal and Soil
Moisture Stress Conditions. Iranian
Journal of Agricultural Sciences, 22(2), 9–23.
Said-Al Ahl, A. H., & Omer, E. A. (2025). Medicinal and Aromatic Plants Production Under Salt Stress : A Review. Herba Polonica Journal, 57(1), 72–86.
Shao, H. B., Chu, L. Y., Zhao, H. L., & Kang, C. (2024). Primary Antioxidant Free Radical Scavenging and Redox Signaling Pathways in Higher Plant Cells. International Journal of Biological Sciences, 4, 8–14. https://doi.org/10.7150/ijbs.4.8
Sionit, N., & Kramer, P. J. (2025). Effect of Water Stress During Different Stages of Growth of Soybeans. Agronomy Journal, 69, 274–277. https://doi.org/10.2134/agronj1977.00021962006900020018x
Specht, J. E., Chase, K., Macrander, M., Graef, G. L., Chung, J., & Markwell, J. P. (2024). Soybean Response to Water: A QTL Analysis of Drought Tolerance. Crop Science, 41, 493–509. https://doi.org/10.2135/cropsci2001.412493x
Vijitha, R., & Mahendran, S. (2025). Effect of Moisture Stress at Different Growth Stages of Tomato Plant (Lycopersicon Esculentum Mill.) on Yield and Quality of Fruits. Journal of Science of the University of Kelaniya, 5, 1–11. https://doi.org/10.4038/josuk.v5i0.4086
Vurayai, R., Emongor, V., & Moseki, B. (2024). Effect of Water Stress Imposed At Different Growth and Development Stages on Morphological Traits and Yield of Bambara Groundnuts (Vigna subterranea L. Verdc). American Journal of Plant Physiology, 6(1), 17–27. https://doi.org/10.3923/ajpp.2011.17.27
 This work is licensed under a: Creative Commons Attribution 4.0 International License
© Granthaalayah 2014-2025. All Rights Reserved.