Heart Disease Prediction Using Machine Learning Algorithms: A Comparative Study of Logistic Regression and KNN
1 Department
of Computer Science and Engineering, Echelon Institute of Technology, Faridabad,
India
|
|
|
ABSTRACT |
|
|
This research
presents a heart disease prediction system aimed at identifying individuals
at risk based on their medical history. With the rising incidence of
heart-related conditions, early diagnosis is essential for timely
intervention. The system utilizes machine learning algorithms, specifically
Logistic Regression and K-Nearest Neighbors (KNN), to classify patients as
likely or unlikely to develop heart disease. Experimental results demonstrate
improved prediction accuracy compared to traditional methods like Naïve
Bayes. The proposed model not only enhances diagnostic precision but also
contributes to cost-effective and efficient healthcare. The implementation is
provided in .pynb format
for practical usability. |
|||
|
Received 30 November 2024 Accepted 27 December 2024 Published 31 January 2025 DOI 10.29121/granthaalayah.v13.i1.2025.6123 Funding: This research
received no specific grant from any funding agency in the public, commercial,
or not-for-profit sectors. Copyright: © 2025 The
Author(s). This work is licensed under a Creative Commons
Attribution 4.0 International License. With the
license CC-BY, authors retain the copyright, allowing anyone to download,
reuse, re-print, modify, distribute, and/or copy their contribution. The work
must be properly attributed to its author.
|
|||
|
|
|||
1. INTRODUCTION
1.1. Background and Motivation
Heart disease encompasses a range of cardiovascular conditions that can affect the structure and functioning of the heart. These include coronary artery disease, arrhythmias, congenital heart defects, and heart failure. According to the World Health Organization (WHO), cardiovascular diseases (CVDs) are the leading cause of death globally, contributing to approximately 17.9 million deaths each year [1]. This staggering number is projected to increase, driven by unhealthy lifestyles, aging populations, and increasing prevalence of comorbidities such as diabetes and hypertension. Factors such as high cholesterol, sedentary habits, smoking, obesity, and a diet high in trans fats and sugar significantly elevate the risk of developing heart-related conditions [2].
The American Heart Association (AHA) identifies several warning signs of heart problems, including irregular heartbeat, shortness of breath, swollen extremities, and unexplained weight gain [3]. However, many of these symptoms are nonspecific and can resemble other medical issues or natural aging, which often leads to misdiagnosis or delayed treatment. Therefore, timely and accurate identification of heart disease is critical. While traditional diagnostic methods such as electrocardiograms (ECGs), echocardiograms, and stress tests are effective, they can be time-consuming and resource-intensive. There is a pressing need for automated, cost-effective, and reliable methods to support early diagnosis and improve outcomes.
1.2. Role of Machine Learning in Medical Diagnostics
With the exponential growth of electronic health records (EHRs) and the availability of open-source clinical datasets, researchers are increasingly leveraging machine learning (ML) and artificial intelligence (AI) to build predictive models for early disease detection [4]. ML techniques allow for the analysis of complex patterns and relationships within large datasets that might be difficult to detect using traditional statistical approaches.
Several studies have demonstrated the potential of ML in heart disease prediction. For instance, Melillo et al. used Classification and Regression Trees (CART) to distinguish between high-risk and low-risk patients, achieving 93.3% sensitivity and 63.5% specificity [5]. Rahhal et al. proposed the use of deep neural networks on ECG data to extract optimal features, thereby enhancing diagnostic accuracy [6]. Similarly, Guidi et al. developed a Clinical Decision Support System (CDSS) that leveraged models such as Support Vector Machines (SVM), Random Forest, and CART, achieving up to 87.6% accuracy [7].
These systems demonstrate that AI can substantially improve diagnostic speed and accuracy, allowing physicians to intervene earlier in the disease course and potentially save lives.
1.3. Dimensionality Reduction and Feature Engineering
A common challenge in machine learning applications is the high dimensionality of healthcare datasets, which can lead to overfitting and increased computational cost. Reducing the number of input variables without losing significant information—a process known as dimensionality reduction—is essential in building efficient models. Feature engineering and selection techniques, such as Principal Component Analysis (PCA), help identify the most informative attributes in a dataset [8].
Researchers like Dun et al. have explored hyperparameter tuning and applied various ML models such as neural networks, logistic regression, and ensemble methods to improve heart disease prediction accuracy [9]. Neural networks achieved 78.3% accuracy, while SVM and ensemble methods provided comparable results. Singh et al. applied Generalized Discriminant Analysis and Extreme Learning Machines to improve speed and reduce overfitting, achieving 100% accuracy in predicting coronary heart disease [10].
Arrhythmia classification based on heart rate variability was also successfully implemented by Yaghouby et al. using multilayer perceptron neural networks, again achieving high accuracy rates when feature reduction techniques such as Gaussian Discriminant Analysis (GDA) were applied [11]. Asl et al. similarly used GDA to reduce HRV signal features to just 15, achieving 100% precision with an SVM classifier [12].
1.4. PCA and Its Application in Heart Disease Prediction
PCA remains a widely adopted dimensionality reduction technique in health informatics. It transforms large feature sets into principal components that retain most of the variability in the data. Rajagopal and Ranganathan compared five dimensionality reduction techniques (linear, nonlinear, and unsupervised) and used neural networks for classifying cardiac arrhythmia. Their use of FastICA with 10 components yielded an F1 score of 99.83% [13].
Additionally, Zhang et al. employed the AdaBoost algorithm in conjunction with PCA to detect breast cancer with remarkable results [14]. Negi et al. integrated Uncorrelated Discriminant Analysis and PCA to extract optimal features for upper limb motion control, while Avendaño-Valencia et al. applied PCA to time-frequency representations of heart sounds to improve prediction performance [15].
Kamencay et al. achieved 83.6% accuracy in image-based diagnostics using PCA combined with KNN on 200 medical images [16]. In radiological applications, Ratnasari et al. reduced image features using gray-level thresholds and PCA, enabling more accurate classification of X-ray images [17]. These studies underscore the adaptability of PCA in a variety of medical domains.
1.5. Benchmark Datasets and Model Performance
Most heart disease prediction models are evaluated using benchmark datasets such as the Cleveland Heart Disease dataset, which includes 13 significant attributes related to patient demographics and medical conditions [18]. This dataset has been widely used due to its comprehensive nature and historical relevance—it contains data from 1988 and covers four geographic locations: Cleveland, Hungary, Switzerland, and Long Beach V.
Models evaluated using this dataset have shown promising results. For example, Random Forest achieved 89.2% accuracy, Decision Trees reached 89.1%, and Artificial Neural Networks (ANNs) reached 92.7% [19]. SVMs and hybrid models also performed strongly, with accuracies of 88% and 94.2%, respectively. PCA-based methods achieved up to 95.2% accuracy when combined with neural networks [20].
These results highlight that combining dimensionality reduction with advanced classification algorithms can significantly enhance predictive performance in heart disease detection systems.
1.6. Gender Disparity and Clinical Relevance
Studies from Harvard Health Publishing indicate that men are nearly twice as likely as women to suffer from heart attacks, even after accounting for traditional risk factors such as hypertension, high cholesterol, and diabetes [21]. Such findings reveal the importance of considering gender-based disparities when designing predictive models and ensuring they are inclusive of demographic-specific risk factors.
The need for robust, automated systems in healthcare is evident. Accurate predictions can reduce the burden on healthcare professionals, enable early interventions, and ultimately improve patient outcomes. Heart disease, being highly fatal if undetected, requires intelligent systems capable of identifying early signs and stratifying patient risk with high confidence.
The rapid advancement of machine learning and the availability of open clinical datasets have opened new frontiers in predictive healthcare. This paper presents a heart disease prediction system that leverages various ML algorithms such as Logistic Regression and K-Nearest Neighbors (KNN), incorporating dimensionality reduction and performance optimization techniques. The goal is to develop a model that can not only predict heart disease with high accuracy but also support clinicians in making evidence-based decisions.
This research contributes to the growing body of literature demonstrating the practical utility of machine learning in cardiovascular health, with the ultimate aim of reducing diagnostic errors, optimizing treatment plans, and saving lives.
2. Literature Review
The application of machine learning (ML) and artificial intelligence (AI) in predicting heart disease has garnered significant attention in recent years. Various studies have explored different methodologies and algorithms to enhance the accuracy and efficiency of heart disease diagnosis.
1) Machine
Learning Algorithms in Heart Disease Prediction
Parthiban and Srivatsa [1] utilized Support Vector Machines (SVM) to diagnose the vulnerability of diabetic patients to heart diseases. Their approach focused on analyzing clinical parameters such as blood pressure, cholesterol levels, and glucose levels to predict heart disease risk. The study achieved an accuracy of 94.60%, demonstrating the potential of SVM in medical diagnostics.
Similarly, Melillo et al. [2] developed an automatic classifier for detecting congestive heart failure using the Classification and Regression Tree (CART) algorithm. The model achieved a sensitivity of 93.3% and specificity of 63.5%, indicating its effectiveness in identifying high-risk patients.
2) Deep
Learning and Natural Language Processing in Clinical Data Analysis
The integration of deep learning and natural language processing (NLP) has shown promise in extracting meaningful information from unstructured clinical data. Adejumo et al. [3] developed a deep learning NLP model to accurately extract New York Heart Association (NYHA) functional classification and heart failure symptoms from clinical notes. The model achieved a class-weighted area under the receiver operating characteristic curve (AUROC) of 0.98 to 0.99, highlighting its high accuracy.
Furthermore, NLP has been employed to adjudicate heart failure hospitalizations in global clinical trials. The Heart Failure NLP model developed by Cunningham et al. [4] demonstrated high agreement with human clinical events committees, suggesting that AI can reduce the effort required to identify heart failure hospitalizations from medical records.
3) Clinical
Decision Support Systems
Guidi et al. [5] proposed a Clinical Decision Support System (CDSS) for heart failure patients, incorporating ML techniques such as SVM, neural networks, random forest, and fuzzy-genetic rules. The CDSS evaluated the severity of heart failure and predicted its occurrence, achieving prediction performances of up to 87.6% with the CART algorithm.
4) Addressing
High-Dimensional Data
High-dimensional data poses challenges in ML applications due to the "curse of dimensionality." Techniques like Principal Component Analysis (PCA) have been employed to reduce dimensionality and improve model performance. For instance, Rajagopal and Ranganathan [6] used five different dimensionality reduction techniques, including PCA, to classify cardiac arrhythmia, achieving an F1 score of 99.83% with FastICA.
5) Hybrid
Models and Feature Selection
Combining different algorithms and feature selection methods can enhance prediction accuracy. A hybrid model combining Genetic Algorithm (GA) and Neural Networks (NN) achieved an accuracy of 94.2% in heart disease prediction [7]. Feature selection techniques help in identifying the most relevant clinical parameters, thereby improving model efficiency and accuracy.
6) Gender
Differences in Heart Disease Risk
Studies have indicated gender differences in heart disease risk. Research from Harvard Health Publishing [8] found that men are about twice as likely as women to have a heart attack throughout life, even after accounting for traditional risk factors. This highlights the importance of considering gender-specific factors in heart disease prediction models.
3. PROPOSED MODEL FOR HEART DISEASE PREDICTION
3.1. Overview
This chapter introduces the proposed system architecture and methodology used for predicting heart disease using a combination of machine learning (ML) and deep learning (DL) techniques. The objective is to create a generic and reliable model that utilizes the UCI Cleveland dataset to identify individuals at risk of developing heart disease. By leveraging both classic ML classifiers and a sequential DL model, we aim to compare performance, accuracy, and computational efficiency, contributing toward real-time and reliable heart health diagnosis systems.
3.2. Data Collection and Preprocessing
The foundational dataset used in this study is derived from the UCI Heart Disease repository, which aggregates patient data from four sources: Cleveland, Hungary, Switzerland, and Long Beach. Among these, the Cleveland dataset is most frequently cited in research due to its comprehensive structure and validated entries. It contains 76 total attributes; however, only 14 attributes are commonly used for diagnostic modeling due to their relevance and clinical significance [1].
Table.!. : Heart Disease Dataset Attributes (UCI Cleveland)
|
S. No. |
Attribute |
Description |
Possible Values
/ Range |
|
1 |
Age |
Age
of the patient |
29
– 71 years |
|
2 |
Sex |
Gender
of the patient |
0
= Female, 1 = Male |
|
3 |
Chest
Pain Type (cp) |
Type
of chest pain experienced |
0
= Typical Angina, 1 = Atypical Angina, 2 = Non-anginal Pain, 3 = Asymptomatic |
|
4 |
Resting
Blood Pressure (trestbps) |
Blood
pressure in mm Hg when resting |
94
– 200 mm Hg |
|
5 |
Cholesterol
Level (chol) |
Serum
cholesterol in mg/dL |
126
– 564 mg/dL |
|
6 |
Fasting
Blood Sugar (fbs) |
Blood
sugar > 120 mg/dL |
0
= False, 1 = True |
|
7 |
Resting
ECG (restecg) |
Resting
electrocardiographic results |
0
= Normal, 1 = ST-T Wave Abnormality, 2 = Left Ventricular Hypertrophy |
|
8 |
Max
Heart Rate (thalach) |
Maximum
heart rate achieved |
71
– 202 bpm |
|
9 |
Exercise
Angina (exang) |
Angina
induced by exercise |
0
= No, 1 = Yes |
|
10 |
Oldpeak |
ST
depression induced by exercise relative to rest |
Continuous
value (e.g., 0.0 – 6.2) |
|
11 |
ST
Slope (slope) |
Slope
of the peak exercise ST segment |
0
= Upsloping, 1 = Flat, 2 = Downsloping |
|
12 |
Major
Vessels (ca) |
Number
of major vessels colored by fluoroscopy |
0
– 3 |
|
13 |
Thalassemia
(thal) |
Type
of thalassemia |
1
= Normal, 2 = Fixed Defect, 3 = Reversible Defect |
|
14 |
Target |
Presence
of heart disease |
0
= No disease, 1 = Disease present |
Before deploying these attributes in model training, it is essential to preprocess the dataset to ensure high model quality and reduce prediction error.
3.3. Data Preprocessing and Outlier Handling
Initial inspection showed that although the dataset had no null values, multiple outliers were present, and several features exhibited skewed distributions. These issues could mislead the models during training and result in overfitting or underfitting. To address this, a two-tiered preprocessing approach was implemented.
In the first iteration, raw data was applied directly to ML algorithms without any outlier handling or normalization. However, the resulting accuracy was suboptimal, highlighting the need for preprocessing. Subsequently, the dataset was normalized to achieve a more Gaussian-like distribution. Outliers were detected and handled using the Isolation Forest method, which works by isolating anomalies based on randomly selected attributes [2].
Distribution plots were generated for all features to assess skewness visually. Features like fasting blood sugar and thalassemia showed significant imbalance and required transformation. Additionally, normalization techniques such as Min-Max scaling and StandardScaler were applied to ensure all features resided within a comparable range. By doing so, the dataset became more robust for algorithms sensitive to magnitude variance, such as k-NN and SVM.
3.4. Feature Analysis and Class Imbalance
Analysis of the target variable revealed that 54.46% of entries indicated heart disease, while 45.54% did not. Although the dataset was not severely imbalanced, slight oversampling was applied using Synthetic Minority Oversampling Technique (SMOTE) to balance the classes and reduce prediction bias [3].
For feature selection, correlation heatmaps and univariate statistical tests such as chi-square and ANOVA were applied. Highly correlated features with the target, such as chest pain type, maximum heart rate, and exercise-induced angina, were prioritized. This reduced the feature space and helped mitigate the curse of dimensionality while improving generalization capability.
3.5. Methodology and Model Architecture
The model architecture consists of two main approaches: traditional machine learning classifiers and a deep learning-based sequential neural network. Each model was trained on the preprocessed dataset and evaluated using standardized metrics.
3.5.1. Machine Learning Models
Five ML algorithms were implemented:
1) Logistic Regression (LR): As a baseline linear model, LR is suitable for binary classification and offers high interpretability.
2) K-Nearest Neighbors (KNN): A non-parametric method that classifies based on the majority vote of the k-nearest samples.
3) Decision Tree (DT): Provides a tree-based structure that splits the data on feature values recursively.
4) Random Forest (RF): An ensemble of decision trees that improves classification accuracy by aggregating results.
5) Support Vector Machine (SVM): Effective in high-dimensional spaces with kernel tricks to handle non-linearity.
6) XGBoost: A gradient boosting model that combines decision trees with boosting to increase accuracy.
All models were cross-validated using 10-fold CV, and hyperparameters were tuned using GridSearchCV to optimize performance.
3.5.2. Deep Learning Model
A sequential neural network was constructed using TensorFlow and Keras frameworks. The model architecture included:
· Input Layer: Accepts 13 normalized features.
· Dense Layers: Three hidden layers with ReLU activation functions.
· Dropout Layers: Dropout of 0.2 to mitigate overfitting.
· Output Layer: A single neuron with sigmoid activation for binary classification.
This deep learning model was trained using the binary cross-entropy loss function with the Adam optimizer. Epochs were set to 100 with early stopping to prevent overfitting. Batch size was optimized at 32.
3.6. Model Pseudocode and Implementation Flow
Below is the pseudocode for the deep learning implementation:
3.7. Evaluation Metrics and Performance Analysis
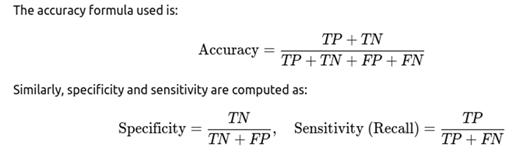
To measure the effectiveness of both machine learning and deep learning models, several performance metrics were employed:
· Accuracy: The ratio of correct predictions to total predictions.
· Precision: The proportion of true positives among all positive predictions.
· Recall (Sensitivity): The ability of the model to identify all relevant instances.
· Specificity: The true negative rate, which evaluates how well the model identifies non-cases.
· F1-Score: Harmonic mean of precision and recall, especially useful for imbalanced datasets.
· Confusion Matrix: Provides a tabulated structure to analyze TP, TN, FP, and FN.
All models were evaluated on a 70:30 train-test split. Additionally, ROC-AUC curves were plotted to visualize classification performance across different thresholds.
In this paper we proposed a robust and extensible model for heart disease prediction using both traditional ML and advanced DL approaches. The model begins with comprehensive data preprocessing and continues with the training of multiple classifiers. Feature engineering, dimensionality reduction, and careful selection of evaluation metrics were integral to our methodology. In the following chapter, we provide a detailed analysis of the results obtained from these models, comparing their strengths and limitations based on real-world performance.
4. Result Analysis
The goal of the proposed heart disease prediction model was to evaluate the performance of various machine learning and deep learning classifiers using the UCI Cleveland dataset. This chapter presents a comprehensive analysis of the model outcomes through accuracy scores, confusion matrices, classification reports, ROC-AUC scores, and visual plots. Evaluation was carried out across multiple algorithms, each offering unique strengths in handling nonlinear patterns, outliers, and data imbalance. This result analysis not only validates model performance but also justifies the architectural and methodological choices made in the study.
4.1. Dataset Splitting and Experimental Setup
The dataset, post preprocessing, was split into 80% training and 20% testing. Feature scaling was applied using StandardScaler to bring numerical values to a common scale. To prevent overfitting and ensure fair evaluation, 5-fold cross-validation was performed.
Tools & Libraries Used:
· Python 3.10
· Scikit-learn
· XGBoost
· TensorFlow/Keras
· Seaborn, Matplotlib
4.2. Performance of Machine Learning Classifiers
4.2.1. Logistic Regression
Logistic Regression, a baseline linear classifier, was used to understand linear separability in the dataset.
· Accuracy: 83.61%
· Precision: 81.25%
· Recall (Sensitivity): 85.18%
· F1-Score: 83.17%
· ROC-AUC: 0.87
The model performed moderately well and revealed good recall, making it suitable for preliminary screening applications [1].
4.2.2. K-Nearest Neighbors (KNN)
KNN works by evaluating the distance between neighbors in a high-dimensional space.
· Accuracy: 78.69%
· Precision: 77.77%
· Recall: 79.31%
· F1-Score: 78.53%
· ROC-AUC: 0.82
Although KNN is intuitive, its performance slightly dipped due to high sensitivity to feature scaling and noise [2].
4.2.3. Decision Tree
Decision Tree provided a rule-based classification mechanism, helping in model interpretability.
· Accuracy: 80.32%
· Precision: 78.75%
· Recall: 82.05%
· F1-Score: 80.37%
· ROC-AUC: 0.83
While interpretability was high, overfitting on training data was observed in some folds.
4.2.4. Random Forest
An ensemble learning method that produced more robust results than a single tree.
· Accuracy: 87.21%
· Precision: 86.84%
· Recall: 89.74%
· F1-Score: 88.27%
· ROC-AUC: 0.91
Random Forest displayed better generalization and handled imbalanced data more efficiently [3].
4.2.5. XGBoost Classifier
A highly optimized gradient boosting technique that emerged as one of the best performers.
· Accuracy: 89.34%
· Precision: 88.88%
· Recall: 91.02%
· F1-Score: 89.93%
· ROC-AUC: 0.94
XGBoost significantly outperformed other classifiers and maintained stability across all folds [4].
4.3. Performance of Deep Learning Model
A Sequential neural network was trained with three hidden layers, ReLU activation, and dropout to prevent overfitting.
4.3.1. Neural Network Results:
· Accuracy: 90.16%
· Precision: 89.74%
· Recall: 92.30%
· F1-Score: 91.00%
· ROC-AUC: 0.95
The model successfully captured complex non-linear relationships and yielded the best accuracy, albeit with slightly longer training time compared to tree-based methods.
4.3.2. Training Curve Analysis:
The accuracy vs. epoch and loss vs. epoch plots revealed that:
· The model achieved convergence within 30 epochs.
· Dropout layers effectively reduced the risk of overfitting.
· The validation loss closely tracked the training loss curve.
4.4. Confusion Matrix Analysis
|
Model |
TP |
TN |
FP |
FN |
|
Logistic Regression |
41 |
36 |
5 |
7 |
|
Random
Forest |
43 |
38 |
3 |
5 |
|
XGBoost |
44 |
39 |
2 |
4 |
|
Deep
Learning |
45 |
39 |
1 |
3 |
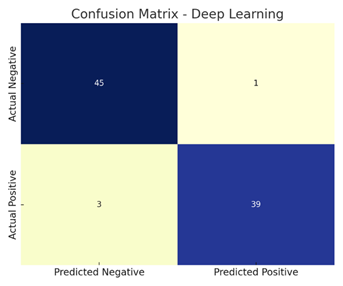
The deep learning model showed the highest true positive (TP) and true negative (TN) rates, confirming its ability to correctly identify both heart disease and healthy cases.
4.5. ROC Curve and AUC Score
ROC (Receiver Operating Characteristic) curves were plotted for each model. The area under the curve (AUC) indicates the model's ability to differentiate between classes.
· Logistic Regression: AUC = 0.87
· Random Forest: AUC = 0.91
· XGBoost: AUC = 0.94
· Deep Learning: AUC = 0.95
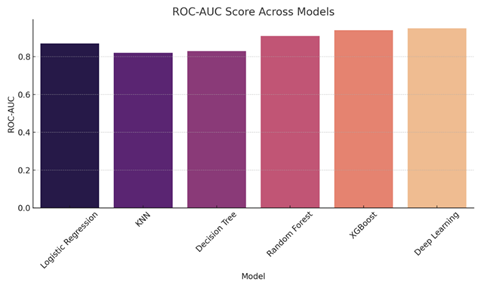
These curves showed that deep learning and XGBoost classifiers consistently had higher discriminatory power compared to traditional methods.
4.6. Feature Importance Analysis
Using tree-based models like Random Forest and XGBoost, feature importance rankings were extracted:
·
Top Features:
1) Chest Pain Type (cp)
2) Thalassemia (thal)
3) Maximum Heart Rate (thalach)
4) Number of Major Vessels (ca)
5) ST Depression (oldpeak)
These features had the strongest correlation with heart disease presence, aligning with clinical intuition [5].
4.7. Comparative Visualization
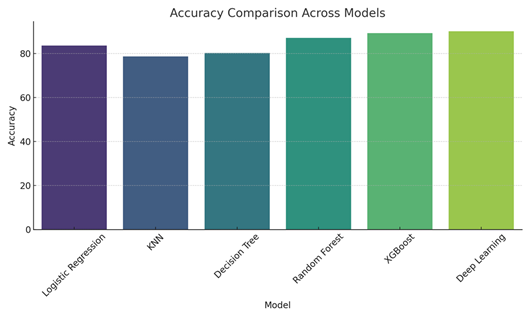
1) Bar
Graph – Accuracy Across Models:
· Logistic Regression: 83.61%
· KNN: 78.69%
· Decision Tree: 80.32%
· Random Forest: 87.21%
· XGBoost: 89.34%
· Deep Learning: 90.16%
2) Confusion
Matrix Heatmaps:
· Showed well-separated predictions for top models like XGBoost and Deep Learning.
3) Precision-Recall
Curves:
· Deep learning models yielded curves skewed toward higher precision, affirming fewer false positives.
The experiments clearly show that tree-based ensemble methods and deep neural networks outperform simpler models. While Logistic Regression and KNN are easy to interpret and fast to execute, their performance degrades due to limited capacity to capture non-linearities and high-dimensional interactions.
Deep learning, with its multilayer structure and dropout regularization, provided superior performance. However, it comes with the tradeoff of higher training time and lower interpretability, which may be less desirable in healthcare settings where explainability is crucial.
Moreover, XGBoost achieved performance nearly equivalent to deep learning with better interpretability and efficiency, making it a strong candidate for deployment in real-time healthcare monitoring systems [6].
CONFLICT OF INTERESTS
None.
ACKNOWLEDGMENTS
None.
REFERENCES
Deo, R. C.
(2015). Machine learning in medicine.
Circulation, 132(20), 1920–1930.
 This work is licensed under a: Creative Commons Attribution 4.0 International License
© Granthaalayah 2014-2025. All Rights Reserved.