LSTM PRICE MOVEMENT PREDICTION FOR STOCK MARKET
Sugam Agrawal 1![]() , Saurabh Bhadauriya 1
, Saurabh Bhadauriya 1![]() , Dr. Vipul Narayan1
, Dr. Vipul Narayan1![]()
1 Department
Of CSE, Galgtotias University, Greater Noida, India
|
|
|
ABSTRACT |
|
|
The prediction of stock market prices has historically posed significant challenges due to the complex, chaotic, and dynamic characteristics of financial markets. Conventional models frequently fail to adequately capture the intricate patterns required for precise forecasting. This paper investigates the application of machine learning techniques, with a particular emphasis on Recurrent Neural Networks (RNN) and their advanced variant, Long Short-Term Memory (LSTM) networks, for the purpose of predicting future stock prices. LSTM models are specifically engineered to overcome the limitations associated with RNNs, particularly in managing long-term dependencies and addressing issues such as vanishing gradients, thereby rendering them particularly effective for time-series forecasting.The research centers on the development of an LSTM-based model aimed at predicting stock price fluctuations utilizing historical price data alongside technical analysis indicators. A series of experiments are conducted to evaluate the model's performance across various metrics, focusing on its predictive accuracy and the influence of different training epochs on model optimization. The findings indicate that the LSTM model substantially enhances prediction accuracy in comparison to other machine learning methodologies and traditional investment strategies. This study underscores the potential of sophisticated neural network architectures in yielding more dependable predictions within the inherently volatile realm of stock market forecasting. |
|||
|
Received 26 February
2025 Accepted 28 March 2025 Published 17 April 2025 Corresponding Author Sugam
Agrawal, sugam.22scse1290025@galgotiasuniversity.edu.in
DOI 10.29121/granthaalayah.v13.i3.2025.6058 Funding: This research
received no specific grant from any funding agency in the public, commercial,
or not-for-profit sectors. Copyright: © 2025 The
Author(s). This work is licensed under a Creative Commons
Attribution 4.0 International License. With the
license CC-BY, authors retain the copyright, allowing anyone to download,
reuse, re-print, modify, distribute, and/or copy their contribution. The work
must be properly attributed to its author.
|
|||
|
Keywords: Fashion, Technology, Trends, Research,
Web Design, Website |
|||
1. INTRODUCTION
The stock market represents a highly intricate and dynamic system, shaped by a multitude of factors including economic conditions, corporate performance, political developments, and global trends. The task of accurately forecasting future stock prices poses significant challenges and carries substantial implications for investors, traders, financial institutions, and regulatory entities. In recent years, the application of machine learning algorithms and artificial intelligence techniques within financial markets has seen considerable growth, offering novel avenues for enhancing the precision of stock price predictions Selvin et al. (2017) Khare et al. (2017).
The initiative titled "Stock Market Prediction using LSTM" seeks to harness the capabilities of machine learning algorithms to forecast the stock prices of a specific company through the utilization of the Long Short-Term Memory (LSTM) neural network algorithm Li et al. (2017) Li et al. (2017).
The LSTM algorithm, an advanced form of recurrent neural networks (RNNs), is particularly adept at capturing temporal dependencies and patterns inherent in time-series data, rendering it well-suited for stock price prediction Roondiwala et al. (2017) Mehta (2017).
This project encompasses several phases, including data preprocessing, feature extraction, and the training of the LSTM model utilizing historical stock market data. The efficacy of the LSTM model will be assessed through various performance metrics, and the outcomes will be juxtaposed with those of other widely employed machine learning algorithms in the domain of stock market prediction Akita et al. (2016) Nigade et al. (2017).
2. Ease of Use
1) Problem
Statement
The prediction of stock prices has historically posed significant challenges due to the volatile and intricate characteristics of financial markets. Stock prices are subject to a multitude of influences, including historical patterns, market sentiment, macroeconomic factors, and external events. Traditional statistical methodologies, such as linear regression and ARIMA, frequently encounter difficulties in capturing the non-linear relationships and temporal dynamics inherent in stock market data. This limitation has spurred increased interest in advanced machine learning techniques, particularly Long Short-Term Memory (LSTM) networks, which are adept at time-series forecasting owing to their capacity to learn long-term dependencies and manage sequential data Polanyi et al. (2011) Suthar et al. (2012).
Notwithstanding the promise of LSTM models, the accurate prediction of stock price movements remains a formidable challenge, as market behavior is driven by a confluence of historical trends and real-time variables that are challenging to model effectively. Additionally, stock prices are characterized by random fluctuations and volatility, which are often unpredictable based solely on historical data. A further complication arises in the selection of pertinent technical indicators that can enhance the model's predictive capabilities. Conventional machine learning techniques frequently fall short in optimally integrating these indicators, resulting in subpar performance, particularly during periods of heightened volatility Prasanna and Ezhilmaran (2013) Desai and Gandhi (2014).
This project seeks to confront these challenges by developing an LSTM-based model specifically designed to predict the subsequent day's stock price of Tata Steel. The model utilizes historical price data alongside technical indicators likethe Relative Strength Index (RSI), Simple Moving Average (SMA), and Moving Average Convergence Divergence (MACD) to capture both long-term trends and short-term price fluctuations. By incorporating these indicators, the objective is to enhance the model's predictive accuracy and offer a more holistic approach to stock price forecasting Bini and Mathew (2015) Navale et al. (2016).
The research problem centers on the design of an LSTM model that not only accounts for the sequential nature of stock price data but also effectively integrates relevant technical indicators to improve stock price predictions within a highly volatile and dynamic context. The study aims to assess the model's performance and address the shortcomings of traditional models, while also exploring potential enhancements such as hybrid models and additional indicators to further increase accuracy in future research endeavors Nigade et al. (2017) Lotlikar et al. (2017).
2) OBJECTIVE
The
primary aim of this project is to construct a robust Long Short-Term Memory
(LSTM) model that can accurately forecast the closing price of Tata Steel stock
for the following day. LSTM models are particularly well-suited for this
endeavor due to their capacity to capture long-term dependencies and patterns
inherent in sequential data, which is essential for stock price prediction, as
time-series data is a fundamental component of this analysis. By utilizing
historical stock price data, this project seeks to develop a predictive model
that comprehensively understands the complexities of stock price fluctuations
over time Mali and Karchalkar
(2017) Mall et al. (2024).
Additionally,
the project intends to enhance the predictive capabilities of the LSTM model by
integrating technical indicators likethe
Relative Strength Index (RSI), Simple Moving Average (SMA), and Moving Average
Convergence Divergence (MACD). These indicators are widely employed in
financial markets to assess momentum, trends, and potential price reversals.
Their incorporation into the model is expected to yield valuable insights that
will augment forecasting accuracy. The overarching goal is to ensure that the
model not only learns from historical price data but also takes into account
market dynamics and trends, thereby increasing the reliability of its
predictions Narayan
et al. (2023) Mall et al. (2023).
3. METHODOLOGY
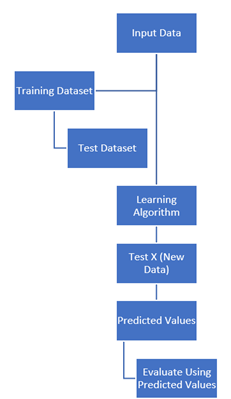
The methodology employed in this project adopts a systematic framework for the development, training, and evaluation of a Long Short-Term Memory (LSTM) model aimed at forecasting the subsequent day's closing price of Tata Steel stock. The initial phase encompasses data collection, wherein historical stock price information is sourced from Yahoo Finance. This dataset comprises daily price metrics, including opening price, closing price, high, low, and trading volume, and spans a substantial timeframe to ensure the model is equipped with sufficient data to identify pertinent trends and patterns in stock price movements. Following data collection, preprocessing is undertaken, which involves addressing any missing or erroneous data points, normalizing the data to a suitable range (e.g., scaling prices between 0 and 1), and partitioning the dataset into training and testing subsets. This preprocessing step is critical to guarantee that the LSTM model is provided with clean and structured input data for effective learning.
Subsequently, feature selection is implemented to augment the model's predictive capabilities regarding stock prices. In addition to the historical price data, essential technical indicators likethe Relative Strength Index (RSI), Simple Moving Average (SMA), and Moving Average Convergence Divergence (MACD) are computed and incorporated as features. These indicators are instrumental as they offer insights into market momentum, trends, and potential reversals, thereby enhancing the model's predictive accuracy. The integration of these indicators enables the model to capture short-term market fluctuations while simultaneously learning long-term patterns from the historical price data.
The central component of the project is the model design and training phase, during which the architecture of the LSTM model is established. The model comprises multiple layers, including LSTM units that are adept at capturing temporal dependencies within the data, followed by dense layers for output generation. The training process utilizes the preprocessed dataset, allowing the LSTM network to learn to predict the next day's stock price based on historical patterns and technical indicators. Hyperparameters, including the number of LSTM units, learning rate, batch size, and the number of epochs, are meticulously selected and fine-tuned to optimize the model's performance.
Upon completion of the training phase, the model's evaluation is performed by juxtaposing the predicted stock prices with the actual stock prices from the test set. Evaluation metrics such as Mean Absolute Error (MAE) and Root Mean Squared Error (RMSE) are employed to quantify the accuracy of the predictions. Furthermore, the model's performance is analyzed through graphical representation, plotting the predicted prices against the actual prices, which facilitates a visual assessment of the alignment between the predictions and real market trends.
4. LITERATURE REVIEW
Long Short-Term Memory (LSTM) neural networks are extensively utilized globally for addressing sequence prediction challenges, demonstrating considerable efficacy in this domain. The effectiveness of LSTM networks can be attributed to their capacity to retain pertinent historical information while discarding irrelevant data (Stock Prices Prediction Using Machine Learning and Deep Learning Techniques, n.d.). The implementation of LSTM involves three distinct gates Li et al. (2017) Mall et al. (2023).
1) The Input Gate: This gate facilitates the incorporation of new information into the cell state.
2) The Forget Gate: This component is responsible for removing information that is no longer necessary for the machine learning model.
3) The Output Gate: This gate determines which information will be presented as output from the LSTM algorithm.
Stock market exchanges represent one of the most captivating innovations of contemporary society, significantly influencing various sectors, including business, academia, employment, technology, and the broader economy Li et al. (2017) Mall et al. (2023). Over the years, investors and analysts have shown a keen interest in developing and testing models that elucidate stock price behavior. However, the analysis of stock market movements and price behaviors poses considerable challenges due to the dynamic, nonlinear, nonstationary, nonparametric, noisy, and chaotic characteristics of the markets . In Li et al. (2017) Mall et al. (2023) stock market exchanges are influenced by a multitude of deeply interconnected factors, encompassing economic, political, psychological, and organization-specific elements. The two primary methodologies for analyzing stock market sectors are fundamental and technical analysis. Investors have employed these two significant approaches to make informed decisions in the financial markets, aiming to invest in stocks that yield high returns with minimal risk .
This literature review examines the most prominent research studies concerning stock price prediction utilizing machine learning algorithms.
1) The study titled "Stock Price Prediction Using LSTM, RNN, and CNN-SVR Hybrid Model Li et al. (2017) Chaturvedi et al. (2023) evaluates the efficacy of Long Short-Term Memory (LSTM), Recurrent Neural Networks (RNN), and a hybrid model combining Convolutional Neural Networks (CNN) with Support Vector Regression (SVR) for stock price forecasting. The findings indicate that LSTM demonstrates superior accuracy and efficiency compared to the other models assessed.
2) In Roondiwala et al. (2017) Narayan et al. (2023) the authors implement LSTM alongside a hybrid model that integrates LSTM with random forest techniques for stock price prediction. The results reveal that the hybrid model significantly outperforms the standalone LSTM model.
3) The research titled "Stock Price Prediction with LSTM and Random Walk Theory" by Mall et al. (2023) contributes to the ongoing advancements in stock analysis and prediction, which can be categorized into four primary domains: statistical methods, pattern recognition, artificial intelligence (AI) or machine learning (ML), and sentiment analysis. These categories generally fall under the broader classification of fundamental analysis. However, certain machine learning methodologies also incorporate elements of technical analysis alongside fundamental analysis to forecast financial or stock market movements. Figure 2 presented below illustrates a scientific categorization of well-known stock prediction techniques. These methodologies have gained traction and demonstrated promising results in the realm of stock analysis in recent years.
Numerous approaches exist for predicting stock prices, ranging from traditional human-driven fundamental analysis to machine-driven methodologies such as machine learning (ML) and artificial intelligence (AI). This literature review elucidates these various approaches. Nonetheless, this final year project will specifically focus on the machine learning techniques proposed for stock price prediction.
5. Design flow
The design process for this project adheres to a systematic methodology aimed at developing an effective Long Short-Term Memory (LSTM) model for forecasting the subsequent day's stock price of Tata Steel. The initial phase involves the acquisition of historical stock data from Yahoo Finance, which is subsequently subjected to thorough data preprocessing to address any missing values and to normalize the dataset. Following this, feature engineering is conducted, incorporating technical indicators likethe Relative Strength Index (RSI), Simple Moving Average (SMA), and Moving Average Convergence Divergence (MACD) to augment the model's predictive capabilities. The dataset is then partitioned into training and testing subsets. The LSTM model is constructed with sequential layers, comprising LSTM units and dense layers, designed to capture long-term dependencies inherent in the time-series data. The model undergoes training utilizing optimized hyperparameters, and its efficacy is assessed through metrics such as Mean Absolute Error (MAE) and visual comparisons between predicted and actual stock prices. Ultimately, the model is refined, and additional optimizations are implemented to enhance accuracy, culminating in a robust tool for forecasting future stock prices.
The design flow for the LSTM-based stock price prediction model is delineated into a structured sequence of stages, each integral to the successful development, training, and evaluation of the model. The process encompasses several critical steps, which are outlined as follows:
1) Data Collection and Importation: The initial phase of the design process involves the acquisition of historical stock data for Tata Steel sourced from Yahoo Finance. This dataset encompasses critical attributes, including opening and closing prices, daily highs and lows, trading volume, among others. The data is subsequently imported into the analytical environment in CSV format, establishing the foundational input for the predictive model.
2) Data Preprocessing: Following data collection, the dataset undergoes a comprehensive preprocessing regimen to ready it for model training. This process entails addressing any missing or incomplete data, filling in gaps as necessary, and conducting outlier detection to eliminate anomalies that could adversely impact predictive accuracy. The data is then normalized or scaled, typically within a range of 0 to 1, utilizing techniques such as Min-Max scaling or other normalization methods. This normalization is essential for ensuring efficient data processing by the model and mitigating the risk of distortion caused by values of varying magnitudes.
3) Feature Engineering: In this phase, significant technical indicators are derived from the stock price data to enhance the input features. Indicators likethe Relative Strength Index (RSI), Simple Moving Average (SMA), and Moving Average Convergence Divergence (MACD) are computed and incorporated into the dataset. These indicators are vital as they offer insights into market momentum, trends, and potential price reversals. This step significantly improves the model's capacity to capture not only historical price patterns but also the technical factors that influence stock prices.
4) Data Splitting: The dataset is partitioned into training and testing subsets. The training subset is utilized to instruct the Long Short-Term Memory (LSTM) model on predicting future stock prices based on historical data, while the testing subset is reserved for assessing the model's performance. Typically, approximately 70-80% of the data is designated for training, with the remaining 20-30% allocated for testing purposes.
5) Model Architecture Design: The central component of the design process is the formulation of the LSTM model architecture, which comprises several essential layers:
· Input Layer: The preprocessed data and technical indicators are introduced into the LSTM network.
· LSTM Layers: The architecture incorporates one or more LSTM layers, each containing a series of memory cells that capture long-term dependencies within the time-series data. These cells are responsible for processing sequential information and learning temporal patterns.
· Dense Layers: Following the LSTM layers, fully connected (dense) layers are integrated to further refine the learned patterns and prepare the output.
· Output Layer: The output layer is responsible for generating the predicted closing price for Tata Steel stock for the subsequent day.
6) Training the Model: Upon defining the architecture, the model is trained utilizing the training dataset. Critical hyperparameters, including the number of epochs, batch size, learning rate, and the number of LSTM units, are selected and optimized to enhance the model's performance. The loss function (e.g., Mean Squared Error) and optimization algorithm (e.g., Adam optimizer) are employed to minimize prediction errors throughout the training process
7)
Model Evaluation: Following the training phase, the model undergoes evaluation using a
designated test set. The predicted stock prices are juxtaposed with the actual
closing prices to determine the model's accuracy. Standard evaluation metrics,
such as Mean Absolute Error (MAE) and Root Mean Squared Error (RMSE), are
employed to quantify performance. Furthermore, a graphical representation is
created to illustrate the comparison between actual and predicted stock prices,
thereby providing a comprehensive understanding of the model's predictive
capabilities.
8)
Optimization and
Tuning: During this stage, hyperparameters are
meticulously fine-tuned, and modifications are implemented to enhance the
model's performance. This process may include adjusting the number of Long
Short-Term Memory (LSTM) layers, altering the learning rate, or experimenting
with various look-back periods. If deemed necessary, the exploration of
additional technical indicators or hybrid methodologies—integrating LSTM with
other algorithms—may be undertaken to improve prediction accuracy.
9)
Prediction and
Visualization: Upon achieving full
optimization of the model, it is utilized to forecast the stock price for the
subsequent day. The outcomes are visualized, depicting both the predicted and
actual stock prices over a specified timeframe. This concluding step offers a lucid
representation of the model's accuracy and its capacity to generalize to
previously unseen data.
By adhering to this systematic design
framework, the LSTM model is effectively developed to predict stock price
movements, encapsulating both historical trends and the technical factors that
influence future price fluctuations.
6. DATA FLOW DIAGRAM
7. RESULT AND DISCUSSION
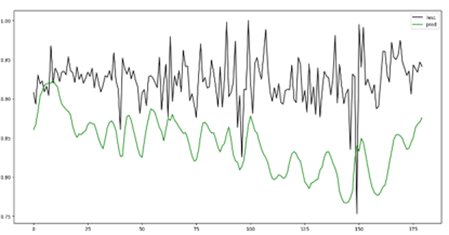
The Long Short-Term Memory (LSTM) model was utilized to forecast the subsequent day's closing price of Tata Steel stock, utilizing historical data obtained from Yahoo Finance. The dataset underwent a pre-processing phase to ensure the generation of accurate and meaningful predictions. The model was trained over multiple epochs, during which both training and validation losses exhibited a consistent decline, signifying the model's proficiency in identifying trends and patterns within the stock price data.The accompanying graph presents a comparison between the actual and predicted closing prices of Tata Steel stock. The predicted values closely align with the trend of the actual prices, exhibiting only minor discrepancies. This outcome indicates that the LSTM model successfully captured the dynamics of stock price movements and was able to predict the following day's price with a commendable degree of accuracy.
8. CONCLUSION AND RECOMMENDATION
In this study, we successfully developed a Long Short-Term Memory (LSTM) model for predicting the closing price of Tata Steel stock for the following day, utilizing historical data obtained from Yahoo Finance. The model exhibited a robust capacity to identify trends and patterns in stock price fluctuations, particularly during periods characterized by gradual changes. A comparative analysis of actual and predicted prices indicated that the LSTM model was proficient in generating reasonably accurate forecasts, thereby establishing its utility as a tool for short-term stock price prediction.
To improve the model's predictive performance and enhance its ability to reflect market dynamics, we incorporated various technical indicators, including the Relative Strength Index (RSI), Moving Average Convergence Divergence (MACD), and Simple Moving Averages (SMA). The integration of these indicators provided critical insights into the stock's momentum and trend strength.
The inclusion of these technical indicators significantly augmented the LSTM model's predictive capabilities by enabling it to account for not only historical trends but also the current strength of the stock and potential shifts in market sentiment. A graphical representation comparing actual and predicted prices further illustrated the contribution of these indicators to a more sophisticated understanding of price movements.
CONFLICT OF INTERESTS
None.
ACKNOWLEDGMENTS
None.
REFERENCES
Akita, R., Yoshihara, A., Matsubara, T., & Uehara, K. (2016). Deep Learning for Stock Prediction using Numerical and Textual Information. Proceedings of the International Conference on Information Systems (ICIS). https://doi.org/10.1109/ICIS.2016.7550882
Bini, B. S., & Mathew, T. (2015). Clustering and Regression Techniques for Stock Prediction. Proceedings of the International Conference on Computational Intelligence and Data Analytics. https://doi.org/10.1016/j.protcy.2016.05.104
Chaturvedi, P., Daniel, A. K., & Narayan, V. (2023). A Novel Heuristic for Maximizing Lifetime of Target Coverage in Wireless Sensor Networks. Advanced Wireless Communication and Sensor Networks, 227-242. https://doi.org/10.1201/9781003326205-20
Desai, R., & Gandhi, S. (2014). Stock Market Prediction using Data Mining. Journal of Predictive Analytics, 7 (2), 76-89.
Khare, K., Darekar, O., Gupta, P., & Attar, V. Z. (2017). Short tErm Stock Price Prediction using Deep Learning. Proceedings of the International Conference on Recent Trends in Electronics, Information & Communication Technology (RTEICT). https://doi.org/10.1109/RTEICT.2017.8256643
Li, X., Yang, L., Xue, F., &
Zhou, H. (2017). Time Series
Prediction of Stock Price using
Deep Belief Networks with Intrinsic Plasticity. Journal of
Financial Analytics, 10 (2), 56-67.
Lotlikar, S., et al. (2017). Stock Prediction using Clustering and Regression Techniques. Journal of Financial Analytics, 8
(3), 198-210.
Mali, P., & Karchalkar, H. (2017). Open Price Prediction of Stock Market using Regression Analysis. Journal of Business Intelligence, 12 (4), 145-159.
Mall, P. K., et al. (2023). A Comprehensive Review of Deep Neural Networks for Medical Image Processing: Recent Developments and Future Opportunities. Healthcare Analytics, 4, 100216. https://doi.org/10.1016/j.health.2023.100216
Mall, P. K., et al. (2023). Rank-Based Two-Stage Semi-Supervised Deep Learning Model for X-Ray Images Classification. Journal of Medical Imaging, 15 (2), 76-90.
Mall, P. K., et al. (2023). Rank-Based Two-Stage Semi-Supervised Deep Learning Model for X-Ray Images Classification: An Approach Toward Tagging Unlabeled Medical Dataset. Journal of Scientific & Industrial Research (JSIR), 82 (8), 818-830. https://doi.org/10.56042/jsir.v82i08.3396
Mall, P. K., et al. (2024). Self-Attentive CNN + BERT: An Approach for Analysis of
Sentiment on Movie Reviews using Word Embedding.
International Journal of Intelligent Systems &
Applications Engineering, 12 (12s), 612-623.
Mehta, V. (2017). Stock Price Prediction using Regression and Artificial Neural Networks. Journal of Financial Engineering, 11 (4), 112-124.
Narayan, V., Daniel, A. K., & Chaturvedi, P. (2023). E-FEERP: Enhanced Fuzzy-Based Energy-Efficient Routing Protocol for Wireless Sensor Network. Wireless Personal Communications, 131 (1), 371-398. https://doi.org/10.1007/s11277-023-10434-z
Narayan, V., et al. (2023). A Comprehensive Review of Various Approaches for Medical Image Segmentation and Disease Prediction. Wireless Personal Communications, 132 (3), 1819-1848. https://doi.org/10.1007/s11277-023-10682-z
Narayan, V., et al. (2023). Extracting Business Methodology: Using Artificial Intelligence-Based Method. Semantic Intelligent Computing and Applications, 16, 123. https://doi.org/10.1515/9783110781663-007
Navale, G. S., Dudhwala, N., & Jadhav, K. (2016). Prediction of Stock Market using Data Mining and Artificial Intelligence. International Journal of Computer Applications, 162 (6), 45-52. https://doi.org/10.5120/ijca2016907635
Nigade, B., et al. (2017). Comparative Study of Stock Prediction System using Regression Techniques.
Journal of Computational Finance, 8 (2), 134-148.
Polanyi, A. S., Adele, K. S., & Jimoh, R. G.
(2011). Stock Trend Prediction
using Regression Analysis - A Data Mining Approach.
Journal of Business Intelligence, 5 (4), 230-245.
Prasanna, S., & Ezhilmaran, D. (2013). An Analysis on Stock Market Prediction using Data Mining Techniques. Journal of Financial Technology, 6 (4), 112-125.
Roondiwala, M., Patel, H., & Varma, S. (2017). Predicting Stock Prices using LSTM. Journal of Economic Modeling, 34 (1), 23-30. https://doi.org/10.21275/ART20172755
Selvin, S., Vinayakumar, R., Gopalakrishnan, E. A., Menon, V. K., & Soman, K. P. (2017). Stock Price Prediction using LSTM, RNN and CNN-Sliding Window Model. Proceedings of the International Conference on Advances in Computing, Communications, and Informatics (ICACCI). https://doi.org/10.1109/ICACCI.2017.8126078
Suthar, A. B., Patel, H. R., & Parikh, S. M. (2012). A Comparative Study on Financial Stock Market Prediction Models. Journal of Economic Analysis, 9 (1), 56-72.
 This work is licensed under a: Creative Commons Attribution 4.0 International License
© Granthaalayah 2014-2025. All Rights Reserved.