DETERMINTS OF INDONESIA'S EXPORTS TO BRICS COUNTRIES: A GRAVITY MODEL APPROACH
Achmad Fadhor Rosid Efendi 1![]()
![]() ,
Mohammad Saleh 2
,
Mohammad Saleh 2![]() , Anifatul Hanim 3
, Anifatul Hanim 3![]()
1 Student,
Master’s Program in Economics, University of Jember, Jember, Indonesia
2 Professor,
Regional Economics and Agribusiness, University of Jember, Jember, Indonesia
3 Associate Professor, Monetary Economics, University of Jember, Jember,
Indonesia
|
|
|
ABSTRACT |
|
|
This study
analyzes the determinants of Indonesia’s exports to BRICS countries (Brazil,
Russia, India, China, and South Africa) using the gravity model approach. It
examines the impact of GDP, geographical distance, exchange rates, and trade
openness on exports from 2011 to 2023 using panel data regression with the
Random Effects Model (REM). Data sources include ITC Trade Map, World Bank
Open Data, and Exchange-Rates.org. The findings show that BRICS GDP
positively and significantly influences Indonesia’s exports, indicating that
higher economic growth in BRICS increases demand for Indonesian products.
Distance has a negative and significant effect, confirming that greater
transportation costs reduce trade. The exchange rate has a positive but
insignificant impact, suggesting that currency depreciation can enhance
exports but is not a dominant factor. Indonesia’s trade openness positively
affects exports, while BRICS trade openness negatively influences them,
implying that as BRICS countries liberalize trade, they may diversify import
sources, reducing reliance on Indonesian goods. This research contributes to
the literature by applying the gravity model with updated data and offers
insights for policymakers and businesses on improving Indonesia’s trade relations
with BRICS. |
|||
|
Received 14 January 2024 Accepted 15 February
2025 Published 31 March 2025 Corresponding Author Achmad
Fadhor Rosid Efendi, fadhorrosid0@gmail.com DOI 10.29121/granthaalayah.v13.i3.2025.5974 Funding: This research
received no specific grant from any funding agency in the public, commercial,
or not-for-profit sectors. Copyright: © 2025 The
Author(s). This work is licensed under a Creative Commons
Attribution 4.0 International License. With the
license CC-BY, authors retain the copyright, allowing anyone to download,
reuse, re-print, modify, distribute, and/or copy their contribution. The work
must be properly attributed to its author.
|
|||
|
Keywords: Indonesia’s Exports, BRICS, Gravity
Model, Trade Determinants, Panel Regression |
|||
1. INTRODUCTION
Trading international, which involves exchange goods and services between countries, is component important in global economy today This. The purpose is for increase welfare economy through specialization and efficiency production. Export, as an integral part of trading international, play a role important in growth economy a country, as explained in North's export base theory (1955). Export-oriented countries tend experience growth more economy rapidly. In addition, competition in the international market push innovation and improvement productivity Melitz and Redding (2021). In the era of globalization, exports no only functioning as source foreign exchange, but also as booster improvement Power competitiveness, efficiency economy, and improvement standard life public in a country Ruzekova et al. (2020).
In an attempt increase performance export to the global market, Indonesia is now start put attention more on the BRICS group of countries (Brazil, Russia, India, China and South Africa) as an arena for competition potential international. The significance of BRICS in global economy is not can ignored, considering group This represent around 42% of the world's population and contributes around 27% of global GDP, 15% of total trade international, as well as 40% of global capital flows (Rani & Kumar, 2023). Projections economy term long show that in 2035, the power economy the combined BRICS countries are estimated will beyond combination the economies of the G-7 developed countries, which consist of from the United States, Japan, Germany, France, England, Canada, and Italy O'Neill (2021). The phenomenon This reflect shift significant in landscape global economy and highlights the importance of Indonesia for positioning self in a way strategic in face dynamics trading international which continues evolve.
Indonesia has connection strong trade with partner trade traditional such as China, the United States, Japan, India and countries in Southeast Asia. However, BRICS offers opportunity diversification of promising export markets. Trade cooperation between Indonesia and the BRICS countries opens more market opportunities wide, considering the magnitude population and growth rapid economic growth in the region as shown in Figure 1, China as BRICS members have become partner trade Indonesia's main still become objective main Indonesia's exports followed by India occupy second. While that, the market potential in Brazil, Russia, and South Africa is still open wide for development Indonesia's exports. With a total population of more from 3.2 billion souls and combined GDP reaches 18% of global GDP, BRICS provides alternative objective strategic export for Indonesia to strengthen position its trade in the global market.
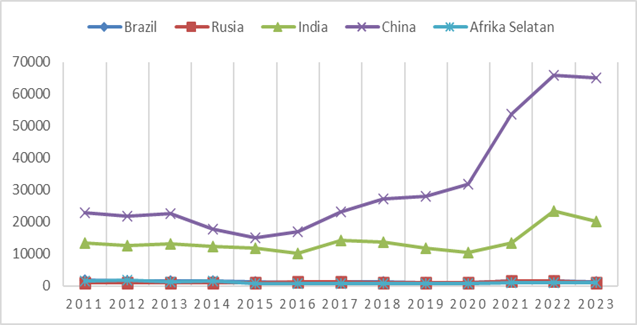
Figure 1
|
Figure 1 Indonesia's Exports
to BRICS 2011-2023 period (million US$) Source: ITC Trade Map |
The image show that China dominates as objective Indonesia's exports among the BRICS countries with continuing trend increase significant, especially since 2020 until reach peak in 2022 with mark around 65,000 million USD. India occupies position second with mark relative exports stable range between 10,000-20,000 million USD, although experience improvement moderate in 2022. Meanwhile that, export to Brazil, Russia and South Africa show relative value low and stable below 5,000 million USD throughout period This pattern. indicates existence big gap in mark Indonesia's exports to BRICS countries, where export still very concentrated to China, meanwhile market potential in other BRICS countries not yet utilized optimally. This is open opportunity for Indonesia to do diversification of export markets to other BRICS countries, considering the magnitude potential the economy and markets owned by each country.
2. literature review
Although the gravity model has become paradigm dominant in analysis trading international, there are gap empirical in existing literature. Factors contemporary like policy protectionism and aspects liberalism demand development framework more analysis comprehensive. Empirical studies conducted by Rezandy and Yasin (2021), Utomo, Matius Dwi. (2022), Cahyaningtyas and Aminata (2020), Arifin, S. (2023), Wardana (2024), Anidya (2023), Agung et al. , (2019), Mulyadi et al. (2017) in a way consistent show that growth GDP of partner countries trade own influence positive and significant to improvement mark Indonesian exports , indicating that improvement Power buy community in the destination country trade main Indonesia can push request to Indonesian products . Cahyaningtyas and Aminata (2020), Mulyadi et al. (2017), Wahyudi and Anggita (2015) is example research that has contributed literature with enter variable mark swap in the gravity model. The results show that the exchange rate has a positive effect on Indonesian exports. Meanwhile, in the research of Utomo, Matius Dwi. (2022), Rezandy and Yasin (2021), Anidya (2023), Putri (2023) argue the opposite that the exchange rate does not have a significant effect on Indonesian exports. Studies other empirically consistent support hypothesis that distance geographical is factor important factors that influence the volume of international trade, with negative influence. However, there is another study found that distance No influential or even give the opposite effect on the outcome predicted by the theory gravity. Research This conducted by Agung (2019), Mulyadi et al. (2017).
Based on phenomenon, background background and study empirical above, Research This applying the gravity model for identify factors that influence Indonesia's exports to BRICS countries. This model covers variable openness trading as well as variables main such as GDP, geographical distance and value swap. Study This expected capable give description comprehensive as runway in taking policy related improvement export national.
3. MATERIALS AND METHODS
Object in this study are BRICS (Brazil, Russia, India, China, and South Africa) and Indonesia. It examines the impact of GDP, geographical distance, exchange rates, and trade openness on exports from 2011 to 2023 using panel data regression. Study This apply method quantitative in nature explanatory research for explain connection between variables studied. Approach This focus on measurement variables in a way quantitative for describe characteristics a population. The data used is panel data. The data source is obtained from the official website ITC Trade Map, World Bank Open Data, Exchange-Rates, online calculator and Free Trade Agreement Center.
Following This is a general model equality Tinbergen gravity used as base analysis, with formulation as following:
![]()
Through transformation natural logarithm, equation the
linearized for interest analysis econometrics. In the process of linearization
Here, the constant G is entered as component ꞵ0,
while GDP is used for measure performance economy both countries with consider
other factors that influence current trading between countries i and j. In
research this, variable dependencies used is mark Indonesian exports, and
variables its independence covering distance, GDP, value exchange and openness
trade. Therefore that, regression model in study This is as following:
Ln(EKSPijt) = ꞵ₀ + ꞵ₁Ln(GDPit) + ꞵ₂Ln(GDPjt) + ꞵ₃Ln(DISTij) + ꞵ₆Ln(EXCijt) + ꞵ₇Ln(TOit) + ꞵ₈Ln(TOjt) + ϵijt
Information:
Ln EKSPijt : Export value of country i (origin) to country j (destination) in year t
ꞵ₀ : Constant (intercept)
ꞵ₁, ꞵ₂, ꞵ₃ : Regression coefficient of each independent variable
Ln GDPit : GDP of country i in year t
Ln GDPjt : GDP of country j in year t
Ln DISTij : Distance between country i (origin) and country j (destination)
Ln EXCijt : Exchange rate i to country j in year t
Ln TOit : Transparency country i's trade in year t
Ln TOjt : Transparency country j's trade in year t
ε : error term
In examining the bilateral trade analysis between BRICS and Indonesia, this research employs the Panel Least Square (PLS) methodology. The PLS approach provides comprehensive insights addressing the research questions formulated in this study Hair et al. (2012). PLS utilizes panel data, which integrates time series and cross-sectional data, thereby expanding the observable dataset beyond what either methodology could provide independently. Moreover, panel data implementation typically yields superior regression outcomes compared to analyses restricted to either time series or cross-sectional approaches. The PLS methodology encompasses several parameter estimation approaches, specifically Common Effect, Fixed Effect, and Random Effect models.
Following the determination of the optimal model, this research conducts classical assumption testing. While such testing typically involves autocorrelation, multicollinearity, and heteroscedasticity assessments, this particular study focuses exclusively on Multicollinearity and Heteroscedasticity examinations. The exclusion of autocorrelation testing stems from the nature of panel data itself; since it combines time series and cross-sectional elements, autocorrelation concerns become irrelevant, as autocorrelation phenomena exclusively manifest in time series datasets.
4. RESULT AND DISCUSSION
4.1. RESULT
Transformation structural the Indonesian economy is experiencing significant development, marked with transition gradually from primary sector to sector manufacturing. Although this process in progress in a way gradual, pattern Indonesia's exports have experience change since the 1990s, with domination product industry Widodo & Rahman (2023). In the span 2011-2023 time, dynamics Indonesian exports are influenced by various factors internal and external factors external. Government make an effort reduce dependence to export primary commodities with push development industry manufacturing and improving mark plus product export. There is eight commodity main including oil, gas, oil coconut palm oil, rubber, clothing, footwear, equipment electronics, machines mechanics, and tools transportation in a way collective contribute by 54-76% of total exports national. This is reflect success strategic diversification exports implemented by Indonesia in face challenge global economy.
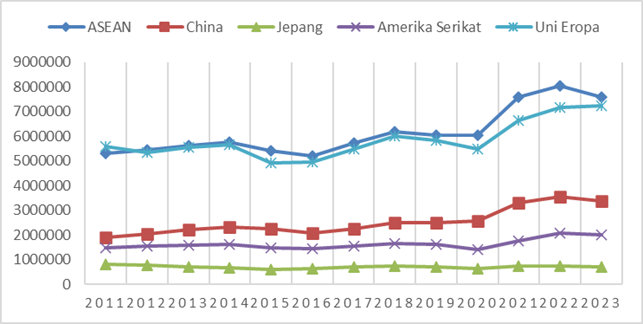
Distribution pattern Indonesia's exports are more Lots intended to fellow developing countries, with contribution amounting to 65-76% of total exports national, while the rest distributed to developed countries. Tampubolon (2020). Indonesia's export market is currently This focused on five goals main ones, namely ASEAN, China, Japan, the United States, and the European Union, which are collective absorb around 70% of total exports national. Since in 2011, it happened shift an interesting trend, where ASEAN and China are experiencing improvement significant as objective main Indonesian exports, meanwhile export to Japan, the United States, and the European Union tend fluctuate in volume and growth.
Figure 2
|
Figure 2 Main Countries or Regions of Destination for Indonesian Exports in the Period 2011-2023 (in million USD) Source : processed
data from UNTRADE, 2025 |
Based on Figure 2, trend Indonesia's exports to five partners trade main experience variation throughout period 2011-2023. ASEAN still become objective export the biggest with an average value export highest and experienced increase significant after 2020. China show growth stable exports, with improvement drastic after 2019, meanwhile European Union take notes trend increase although experience fluctuations. United States experience growth moderate exports with surge after 2018, while Japan tend stagnan throughout period said. In a way Overall, ASEAN and China remain become a major market Indonesian exports, with level growth more tall compared to the European Union, the United States, and Japan.
Indonesia has build connection strategic trade with the BRICS countries (Brazil, Russia, India, China, and South Africa), which are emerging market country group leading in global economy. In relation Indonesia's trade with BRICS, China becomes partner trade Indonesia's main, with bilateral trade dominated by commodities strategic such as coal, oil coconut palm oil (CPO), and products mining. While that, pattern Indonesia's trade with other BRICS members show significant diversification. India becomes a major market for exports of CPO, coal and minerals. Brazil absorb export rubber processed, footwear, and product manufacturing. Russia imports CPO, coffee and other products. agriculture. While South Africa became objective export of CPO, rubber and components automotive.
At the beginning in 2025, Indonesia will official join with the BRICS group, which aims For diversify export markets and reduce dependence on partners trade main such as China, ASEAN, Japan, the United States, and the European Union. Membership This open opportunity for Indonesia to expand access trading to developing countries others, improve integration economy, as well as optimize Work The same in trade, investment and industry strategic. Through BRICS, Indonesia can utilise various initiative supportive economy growth exports, especially through subtraction obstacle trade and improvement synergy with member countries others. Opportunities Indonesia's exports in BRICS are sufficient promising remember group This consists of from developing countries with population largest and its economy is growing rapidly, so that create request tall to various product. This is give chance for Indonesia to expand marketing product featured, such as oil coconut palm oil, coal, products agriculture, as well as goods manufacturing. Indonesia's membership in BRICS must utilized optimally, well through improvement Power competition product export and also utilization policy more trade open among member countries, in order to strengthen Indonesia's position in global economy.
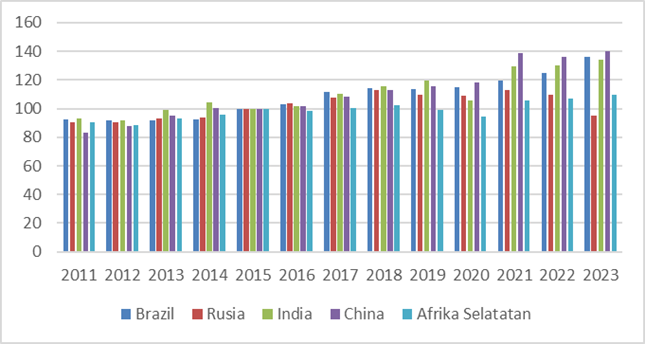
Figure 3
|
Figure 3 Export
Volume Index of BRICS Countries (percent) Source: Processed
Data from UNTRADE, 2025 |
The image show Indonesia's Export Volume Index (VIE) to BRICS countries (Brazil, Russia, India, China, and South Africa) in period 2011-2023. In general, visible trend improvement export to all BRICS countries, especially after 2020. China and India show more growth rapid compared to other countries, indicating increasing request to Indonesian products. While that, export to Brazil, Russia and South Africa also experienced increase, although with level more growth varies. Increase export volume index This reflect market diversification and more strong connection Indonesia's trade with BRICS countries in a number of year final.
4.2. DISCUSSION
Panel Regression Model Selection Test
Prior to conducting Panel Regression estimation, comprehensive model selection testing will be implemented to evaluate the comparative significance of Common Effect (CEM), Fixed Effect (FEM), and Random Effect (REM) models. The initial assessment utilizes the Chow test, which evaluates and identifies the superior model between CEM and FEM frameworks. Subsequently, the Hausman test is applied to determine the optimal model when comparing FEM and REM approaches.
The initial model selection evaluation employed the Chow test. As presented in Table 1, the cross-section F value of 0.000 falls below the 0.05 threshold, thereby establishing FEM as the preferred model when compared with CEM. Following this determination, the comparison between FEM and REM was conducted through the Hausman test. Table 2 displays the results of this analysis, indicating a random cross-section probability value of 0.000, which is less than the 0.05 significance level. Based on these Hausman test findings, FEM is confirmed as the superior model when evaluated against REM.
Table 1
|
Table
1 Result Chow |
|
Effect
test
Prob. |
|
u_i = 0: F(4, 55) =
150.07
0.0000 |
Table 2
|
Table
2 Result of the Hausman |
|
Test
chi2(3)
Prob. |
|
42.66
0.0000 |
Panel Data Regression Test with Random Effect
Although Hausman Test results indicate that Fixed Effects Model (FEM) is a more complex model. appropriate in a way statistics, but approach Random Effects Model (REM) was selected in study this based on consideration theoretical gravity model trade. Election this based on characteristics intrinsic RE model capable of accommodate variable that is time-invariant (no varies to time), especially variable distance geographical which is component important in the gravity model. The FE model does not can estimate effect constant variable throughout time Because will eliminated in the process of transformation within. In contrast, the RE model allows estimate influence characteristics that are specific interstate and relative stable throughout time, which is of the essence in analysis pattern trading international. With Thus, the use of the RE model is more in accordance for capture heterogeneity between countries that become focus main in analysis bilateral trade based on gravity model. Here results panel data regression with model approach Random Effects.
Table 3
|
Table
3 Results Panel
Data Regression with approach Random Effects Model |
||||
|
ln Export |
Coef. |
Std. err. |
z |
Prob. |
|
ln GDPind |
.8593747 |
.4758382 |
1.81 |
0.071 |
|
ln GDPBrics |
.632472 |
.1836658 |
3.44 |
0.001 |
|
ln Distance |
-2.737282 |
.2450234 |
-11.17 |
0.000 |
|
ln Exch |
.1204378 |
.0655214 |
1.84 |
0.066 |
|
ln TOind |
1.926971 |
0.60986 |
3.16 |
0.002 |
|
ln TOBrics |
-1.100118 |
0.58051 |
-1.9 |
0.058 |
Based on Table 3, the analysis reveals several significant relationships between the dependent and independent variables. The Indonesian GDP variable shows a coefficient of 0.8593 (significant at α=10%), indicating that a 1% increase in Indonesia's GDP will lead to a 0.86% increase in exports, demonstrating how improved Indonesian production capacity encourages export growth. Similarly, the BRICS GDP variable has a coefficient of 0.6324 (significant at α=1%), showing that a 1% increase in BRICS GDP will increase exports by 0.63%, reflecting how economic growth in BRICS countries enhances demand for Indonesian imports. The Distance variable demonstrates a negative relationship with a coefficient of -2.7372 (significant at α=1%), where a 1% increase in distance reduces exports by 2.74%, highlighting how greater distances between Indonesia and BRICS countries result in higher transportation costs and consequently lower exports. The Exchange Rate Variable, with a coefficient of 0.1204 (significant at α=10%), shows that a 1% depreciation of the exchange rate will increase exports by 0.12%, indicating that a weaker Rupiah makes Indonesian exports more competitive in BRICS markets. Indonesia's Trade Openness Variable has a strong positive coefficient of 1.9269 (significant at α=1%), where a 1% improvement in Indonesia's trade openness increases exports by 1.93%, demonstrating the significant impact of trade liberalization on export volumes to BRICS. Conversely, the BRICS trade openness variable shows a negative coefficient of -1.1001 (significant at α=10%), where a 1% improvement in BRICS trade openness will reduce exports by 1.10%, suggesting that as BRICS countries become more open, they may prefer imports from other countries or increase their domestic production.
Assumption Test Classic
Testing multicollinearity in study This done through analysis coefficient correlation, which is method For detect level relatedness intervariable independent in the regression model. A model is stated contain high multicollinearity if mark coefficient correlation exceed threshold of 0.8. On the other hand, the value coefficient more correlation small from 0.8 indicates that the model is free from problem serious multicollinearity Wooldridge (2020). The following multicollinearity test results in study This.
Table 4
|
Table
4 Multicollinearity Test |
||||||
|
|
GDPind |
GDPbrics |
Distance |
Exch |
TOind |
TObrics |
|
GDPind |
1.0000 |
|
|
|
|
|
|
GDPbrics |
0.0905 |
1.0000 |
|
|
|
|
|
Distance |
0.0000 |
-0.4981 |
1.0000 |
|
|
|
|
Exch |
-0.0242 |
-0.7836 |
0.7820 |
1.0000 |
|
|
|
TOind |
-0.6450 |
-0.0527 |
-0.0000 |
0.0198 |
1.0000 |
|
|
TObrics |
-0.0195 |
-0.4492 |
-0.4089 |
-0.1186 |
0.1408 |
1.0000 |
Based on Table 4, it shows that the correlation coefficient value of each independent variable is less than 0.8, meaning that the test states that there is no multicollinearity or there is no linear relationship between the independent variables in the regression.
Heteroscedasticity testing in this study was conducted through the Breusch-Pagan Test, this test uses chi-squared statistics to test whether the variance of the residuals depends on the value of the independent variable.
Table 5
|
Table
5 Breusch-Pagan Heteroscedasticity Test |
|||
|
Variables |
Var |
sd = sqrt(var) |
Chibar2 Prob. |
|
Ln exp |
2.20481 |
1.48486 |
1.0000 |
Based on Table 5, it shows that the Chibar2 probability value of 1,000 is greater than 0.05, meaning that the test states that there is no heteroscedasticity in the regression.
5. CONCLUSION
Study This aiming for analyze factors that influence Indonesian exports to BRICS countries. Factors main researched is Gross Domestic Product (GDP) and distance, according to with theory gravity trade. In addition, research this also takes into account other factors such as mark swap currency and rates openness trading for see How factors the play a role in determine the volume of Indonesian exports to BRICS countries. The conclusions obtained from the results of a series of studies that have been conducted are as follows:
1) BRICS GDP has been proven to have a positive and significant impact on Indonesia's exports to BRICS countries. This is show that the more big size the economies of the BRICS countries, increasingly big opportunity to Indonesia exports to area said, because BRICS GDP increases tend to increase Power buy and ask to product imports, including From Indonesia.
2) Indonesia's GDP has been proven to have a positive and significant effect at the 10% level. Identifying that domestic economic growth also plays a role in increasing exports, which can associated with improvement capacity production domestic as well as support policy export from government
3) Economic distance has been shown to have a negative and significant effect on Indonesia's exports to BRICS countries. This is consistent with gravity model theory trade, where increasingly Far distance economy between the two countries, the more tall cost trade that must be issued, so that hinder export. This factor reflect challenge logistics as well as obstacle trading like potential tariffs and non-tariffs reduce Power competition product Indonesia's exports in the BRICS market.
4) The exchange rate is proven to have a positive and significant effect at the 10% level. Show that depreciation of the rupiah against currencies of BRICS countries have potential increase Indonesian exports, because price Indonesian goods become more competitive in the BRICS market. However, the effects mark swap to export it seems No as strong as factors others, which can caused by factors volatility mark swap as well as policy monetary influences stability trading international.
5) Indonesia's trade openness has been proven to have a positive and significant impact. It shows that the more open Indonesia's trade with the world is increasing big exports that can produced. This is indicates that policy more trade open, like agreement trading free or deletion obstacle export, can help increase Power competition Indonesian products in the BRICS market.
6) On the other hand, BRICS trade openness has a negative impact on Indonesia's exports to BRICS countries. This phenomenon This indicates that the more open the BRICS countries' markets for trading international, increasingly the potential is also great they for import goods and services from other countries outside Indonesia. In other words, when the BRICS countries open self to global trade, they no only increase import in a way common, but also tends to look for source diverse imports, including from Indonesia's competitor countries.
6. Suggestions
Based on the conclusions above, the suggestions that can be put forward by researchers in this study are as follows:
1) Enhance trade relations with BRICS countries. when BRICS economies grow, demand they to goods imports, including from Indonesia, also increased. Therefore that, the government need to weave Work The same more trade close with the BRICS countries through agreement bilateral or multilateral trade, such as expansion Preferential Trade Agreement (PTA) or Free Trade Agreement (FTA) with BRICS.
2) Overcoming the economic distance barrier by improving infrastructure and logistics efficiency. The government needs to strengthen transportation infrastructure, such as increasing the capacity of major ports and improving land and sea connectivity to export centers. And also the Use of digital technology in system logistics , such as National Logistic Ecosystem (NLE), also necessary expanded For reduce costs and speed up the export process to the BRICS countries.
3) Maintaining exchange rate stability. government need guard stability mark exchange rupiah with policy proper monetary, including intervention in the foreign exchange market and the use of instrument policy ethnic group flower so that the value swap still competitive without cause excessive volatility for exporter.
4) Increasing Indonesia's trade openness and product diversification. government must Keep going push simplification regulation export, reduce obstacle rates and non-tariff, as well as give incentive for perpetrator business exports. In addition, the Government need push diversification exports, especially product worth plus tall like manufacturing, electronics, pharmaceuticals, and processing agriculture. The aim is so that Indonesian exports do not only depends on the commodity raw such as coal and oil coconut palm oil.
5) On the global side, the government need increase Power competition product Indonesian exports with differentiation and improvement strategies quality products, as well as ensure that Indonesia has superiority comparative in trading with the BRICS countries. The government can also push strengthening Work bilaterally with each of the BRICS countries, including in form agreement trading special or mechanism preference rates that can be give superiority for Indonesian products compared competitor other.
7. Limitations
Study this own limitations main, namely remove variable population Because correlation tall with Potential GDP cause multicollinearity, and findings that openness BRICS trade impact negative on Indonesian exports, contrary to with hypothesis beginning. For study next, it is recommended for deepen analysis factors that influence results mentioned, including use a more data-driven approach comprehensive and inclusive variable relevant additions.
CONFLICT OF INTERESTS
None.
ACKNOWLEDGMENTS
None.
REFERENCES
Arifin, S. (2023). Kinerja Ekspor Indonesia: Dampak Pandemi COVID-19 vs Perang Rusia. Jurnal Ekonomi dan Pembangunan Indonesia, 23(2), 1. https://doi.org/10.21002/jepi.2023.08
Cahyaningtyas, D. P., Aminata, J., & SH, J. P. S. (2017). Analisis Faktor-faktor yang Mempengaruhi Perdagangan Indonesia Dengan Negara-Negara Anggota APEC. Sumber, 118, 121-472.
Exchange Rates (2024). Nilai tukar IDR/BRL/RUB/INR/Yuan/ZAR 2014-2023.
Mulyadi, M., Saenong, Z., & Balaka, M. Y. (2017). Pengaruh GDP, Ukuran Ekonomi, Nilai Tukar, Penduduk, dan Jarak Ekonomi Terhadap Ekspor Indonesia Ke Negara ASEAN+ 6 (Pendekatan Model Gravitasi). Jurnal Progres Ekonomi Pembangunan (JPEP), 2(2), 1-22.
Ruzekova, V., K ittova, Z., & Steinhauser, D. (2020). Export Performance as a Measurement of Competitiveness. Journal of Competitiveness, 12(1), 145–160. https://doi.org/10.7441/joc.2020.01.09
Tampubolon, Jongkers. (2020). Perdagangan Internasional & Bisnis Internasional: teori dan analisis empiris. DEEPUBLISH CV Budi Utama. Yogyakarta.
Utomo, Matius Dwi. (2022). Model Gravitasi dan Faktor Budaya Terhadap Ekspor Indonesia Dengan Mitra Dagang Utamanya. Skripsi: Universitas Kristen Satya Wacana Salatiga.
Wardana, Alexandros Thomas Wisnu. (2024). Analysis of Bilateral Trade and Invesment Relations Between Indonesia and Singapore 2015-2019. Skripsi: Universitas Diponegoro Semarang.
World Bank Open Data (2025). Trade (% of GDP) – Indonesia-Brazil-Russian-China-India-South Africa.
 This work is licensed under a: Creative Commons Attribution 4.0 International License
© Granthaalayah 2014-2025. All Rights Reserved.