SCIENTOMETRIC ANALYSIS AND titles word linkage in DOCTORAL THESIS of Vegetable pathology During the period of 2007-2019
Amaravathi V 1![]()
1 Department
of Library and Information Science, Bangalore North University, Kolar
|
|
|
ABSTRACT |
|
|
There 2,327
citations were identified from 12 doctoral theses the highest 5(41.67%)
number of theses submitted in 2009. Out of 2,327 Citations there are
1,408(60.50%) citations from “Journal Articles”, 400(17.19%) are from
“Books”, 317(13.63%) are from “Conference proceedings”, 172(7.40%) are from
“Thesis and Dissertations”, 236(16.76%) were “j.of.Phytopatholohy” from “United Kingdom”, is
published 78(2.84%) were from “Indian j.mycol.pl.Pathol” Published from “India”. 14(14.15%) from
“USA” is the second top country, 412(29.27%) were highest from the period
“2008-1998”, 391(27.77%) references from the period “1997-1987”. |
|||
|
Received 22 August
2024 Accepted 27 September 2024 Published 06 November 2024 Corresponding Author Amaravathi
V, amaravathimlisc@gmail.com
DOI 10.29121/granthaalayah.v12.i10.2024.5827 Funding: This research
received no specific grant from any funding agency in the public, commercial,
or not-for-profit sectors. Copyright: © 2024 The
Author(s). This work is licensed under a Creative Commons
Attribution 4.0 International License. With the license
CC-BY, authors retain the copyright, allowing anyone to download, reuse,
re-print, modify, distribute, and/or copy their contribution. The work must
be properly attributed to its author.
|
|||
|
Keywords: Citations, Submitted, Journal Articles,
Conference, Dissertations, Phytopathology, India, References |
|||
1. INTRODUCTION
In the field of Library and Information Science bibliometrics/ Scientometrics as it is presently known is of recent origin through its roots could be traced to a study made 85 years ago in 1917 since then it has come a long way and attained much importance and significance for library and information managers. Researchers in bibliometrics has also given birth to a couple of other terms scientometrics and informatics which are used today in place of bibliometrics Earlier the term statistical bibliography was also used for it while Ranganathan prepared to call it Librametry all these terms are the same. Bin Li et al. (2020)Bibliometrics has practice applications in the evaluation of library operations and surveys through statistical techniques to make the quantitative analysis possible. There are some Bibliometrics techniques are used they are to study research trends and growth of knowledge in the field of Library and information science, to estimate comprehensiveness of secondary periodicals, to identify users of different subjects, to identify authorship trends in documents on various subjects, to measure the usefulness of retrospective and current awareness services.
2. Scope Methodology
The present study is limited to Scientometric analysis and titles word linkage in doctoral thesis of vegetable pathology during the period of 2007-2019. Data has been collected from Krishikosh Website. The citation technique is adopted for the study there are 12 thesis and their 2,327 references were analyzed according to citation method. The collected data were tabulated presented, analysis and interpreted with the help of tables and graphs. The present data is entered in MS Excel sheet. According to AACR2 cataloguing code. The ranking of periodicals are checked country of publications in SCIMAGO Website and there were 06 thesis titles selected for linking of words in universe of knowledge. Garga & Tripathib (2018)
3. Objectives of the study
· To know Year wise Submission of Doctoral thesis in Vegetable Pathology
· To find out Average number of Citations in each thesis
· To verify Types of documents cited by researchers
· To know Authorship pattern of citations and degree of collaboration
· To know Ranking of Periodicals
· To find out Geographical wise distribution of journal articles
· To verify Age wise distribution of journal references.
Using
Vegetable Pathology thesis Titles for Subject Relation
|
Sl. No |
Type Of Crop |
Name Of Diseases |
Organism Attacked |
|
|
1 |
Edible tuber and bulbs |
|||
|
a. |
Potato |
Wilt |
Bacteria |
|
|
2 |
Forage plants |
|||
|
a. |
Pigeon pea |
Wilt |
Bacteria |
|
|
3 |
Cereals |
|||
|
a. |
Sorghums |
Root |
Virus |
|
|
4 |
Other crops grown for
industrial processing |
|||
|
a. |
Vanilla |
Stem Rot |
Virus |
|
|
5 |
Flowers and ornamental
plants |
|||
|
a |
Sunflower |
Necrosis |
Virus |
|
|
6 |
Tropical and Sub
tropical fruits |
|||
|
a |
Pomegranate |
Bacterial Blight |
Virus |
This is one example of single disease Wilt Causing Two Different Crops like Potato and Pigeonpea.
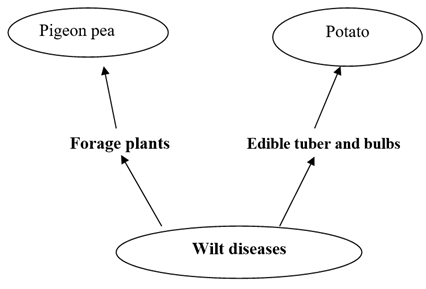
Thesis titles Referred
Epidemiology and integrated management of Potato WILT
caused by Sclerotium rolfsii Sacc. Jozi
& Nourmohammadi (2022)
Identification of strains of Fusariumudam Causing WILT of Pigeonpea Through cultural, morphological and molecular approaches and its management.
This is another example of Single disease Root causing Two different Crops like Sorghum and Vanilla.
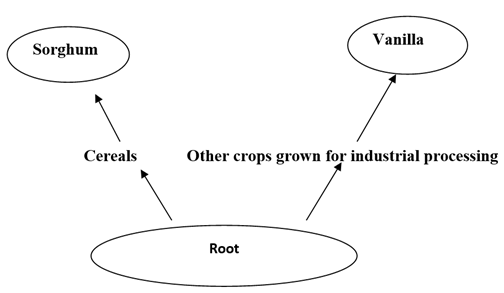
Referred thesis titles
1) Studies on etiology, variability, epidemiology and management of Stem Rot of Vanilla (Vanilla planifolia) caused by Fusarium oxyxporum schlecht ex.Fr.f.xp.ounillac
2) Variability and management of charcoal Rot of Sorghum Caused by Macrophoomina phaseolina (Tassi) Goid.
This is another example of Single disease Necrosis causing one crop Sunflower.
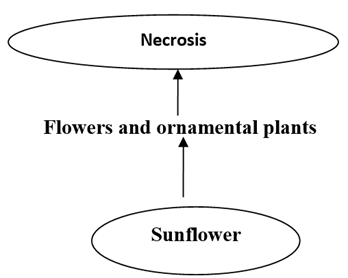
Referred thesis titles
1) Molecular Detection of sunflower Necrosis virus in weeds and its vector thrips prevalent in Sunflower Ecosystem. Koteppa et al. (2013)
This is another example of Single disease Bacterial Blight causing one crop Pomegranate.
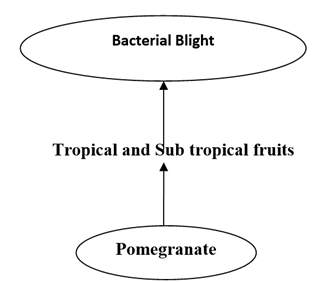
Referred thesis titles
Molecular characterization of Xanthomonos axanopodha pv.punicae, causing Bacterial Blight of pomegranate, its Epidemiology and integrated Management.
4. Data Analysis
Table 1
|
Table 1 Year Wise Submission of Doctoral Thesis in Vegetable Pathology |
||||
|
Sl. No |
Year of Submission |
No of citations |
No. of Thesis
Submission |
% |
|
1 |
2007 |
534 |
3 |
25 |
|
2 |
2008 |
861 |
4 |
33.33 |
|
3 |
2009 |
932 |
5 |
41.67 |
|
Total |
2,327 |
12 |
100 |
|
It is observed in T1 that Year wise Submission of Doctoral thesis in Vegetable Pathology. A total of 2,327 citations were identified from 12 Thesis. The highest 5(41.67%) number of thesis submitted in 2009. Followed by 4(33.33%) Submitted in 2008 and 3(25%) Submitted in 2007.
Table 2
|
Table 2 Average Number of Citations in Each Thesis |
|||
|
Sl. No |
No. of Thesis |
Average Citations per
volume |
% |
|
1 |
12 |
2,327 |
193.91 |
It is observed in T2 that the Average number of Citations in each thesis the total number of 12 thesis were called 2,327 Citations. Their average citations in each thesis is 193.91%.
Table 3
|
Table 3 Types of Documents Cited by Researchers |
||||||
|
Sl. No |
Ranking No |
Type of documents |
Citations |
% |
Cumulative of
citations |
% |
|
1 |
1 |
Journal Articles |
1,408 |
60.5 |
1,408 |
60.5 |
|
2 |
2 |
Books |
400 |
17.19 |
1,808 |
77.69 |
|
3 |
3 |
Conference proceedings |
317 |
13.63 |
2,125 |
91.31 |
|
4 |
4 |
Thesis and
Dissertations |
172 |
7.4 |
2,297 |
98.71 |
|
5 |
5 |
Annual Reports |
16 |
0.68 |
2,313 |
99.39 |
|
6 |
6 |
Electronic Sources |
7 |
0.3 |
2,320 |
99.69 |
|
7 |
7 |
Incomplete References |
7 |
0.3 |
2,327 |
100 |
|
Total |
2,327 |
100 |
||||
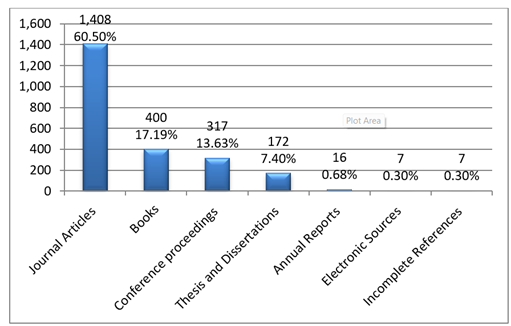
It is observed in T3 that Types of documents cited by researchers. A total of 2,327 Citations there are 1,408(60.50%) citations from “Journal Articles”, Followed by 400(17.19%) are from “Books”, 317(13.63%) are from “Conference proceedings”, 172(7.40%) are from “Thesis and Dissertations”, 16(0.68%) are from “Annual Reports”, 7(0.30%) are from “Electronic Sources” and 7(0.30%) are from “ Incomplete References”. Norma et al. (2020)
Figure 1
|
Figure 1 Types of Documents Cited by Researchers |
Table 4
|
Table 4 Authorship Pattern of Citations and Degree of Collaboration |
|||
|
Sl. No |
No. of Authors |
No. of Citations |
% |
|
1 |
Single Author |
232 |
16.48 |
|
2 |
Multi Authors |
1,176 |
83.52 |
|
Total |
1,408 |
100 |
|
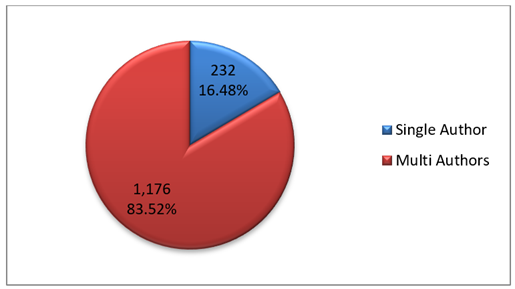
It is observed in T4 that Authorship pattern of citations. A total of 1,408 Citations there were 232(16.48%) citations are from “Single Author” and 1,176(83.52%) are “Multi Authors”.
Figure 2
|
Figure 2 Authorship Pattern of Citations |
It determining the degree of collaboration in quantitative term the formula given by K.Suramanyam (1982) was used .
Formula NM
_______
NM+NS
Where C= Degree of Collaboration
NM = Number of Multi Authored papers
NS=Number of Single authored papers
In the present study
NM=1,176
NS= 232
Thus C=0.83
Table 5
|
Table 5 Ranking of Periodicals |
|||||||
|
Sl. No |
Ranking. No |
Journal Name |
No. of Citations |
% |
Cumulative of
Citations |
% |
Country |
|
1 |
1 |
J.of Phytopathology |
236 |
16.76 |
236 |
16.76 |
United Kingdom |
|
2 |
2 |
Indian j.mycol.pl.pathol |
78 |
5.53 |
314 |
22.3 |
India |
|
3 |
3 |
Plant disease |
40 |
2.84 |
354 |
25.14 |
USA |
|
4 |
4 |
Curr Sci |
23 |
1.63 |
377 |
26.77 |
India |
|
5 |
4 |
Research in Plant
Disease |
23 |
1.63 |
400 |
28.4 |
South Korea |
|
6 |
5 |
Nature |
18 |
1.27 |
418 |
29.68 |
United Kingdom |
|
7 |
6 |
j.seed.sci.tech |
14 |
0.99 |
432 |
30.68 |
Switzerland |
|
8 |
6 |
Karnataka journal of
Agricultural science |
14 |
0.99 |
446 |
31.67 |
India |
|
9 |
7 |
Fitopathologia Brasileira |
12 |
0.85 |
458 |
32.52 |
Brazil |
|
10 |
7 |
Indian j.phytopathology |
12 |
0.85 |
470 |
33.38 |
India |
|
11 |
7 |
Ann.Rev.phytopath |
12 |
0.85 |
482 |
34.23 |
USA |
|
12 |
8 |
Mycologia |
11 |
0.78 |
493 |
35.01 |
United kingdom |
|
13 |
9 |
Indian j. Microbial |
10 |
0.71 |
503 |
35.72 |
India |
|
14 |
9 |
Journal of Plant
pathology |
10 |
0.71 |
513 |
36.43 |
Italy |
|
15 |
10 |
Pl.cell. Reports |
09 |
0.63 |
522 |
37.07 |
Germany |
|
16 |
10 |
World.j.microbiol Biotech |
09 |
0.63 |
531 |
37.71 |
Nether lands |
|
17 |
10 |
Indian j.pl.
pathology |
09 |
0.63 |
540 |
38.35 |
India |
|
18 |
10 |
Asian Journal of Plant
Pathology |
09 |
0.63 |
549 |
38.99 |
USA |
|
19 |
10 |
Nature Biotechnology |
09 |
0.63 |
558 |
39.63 |
United Kingdom |
|
20 |
10 |
Malaysian Agricultural
journal |
09 |
0.63 |
567 |
40.26 |
Malaysia |
|
21 |
11 |
Indian j.Agric.Sci |
08 |
0.56 |
575 |
40.83 |
India |
|
22 |
11 |
Journal of Ecology and
Environment |
08 |
0.56 |
583 |
41.4 |
United Kingdom |
|
23 |
11 |
Harayana j.Horti.Sci
|
08 |
0.56 |
591 |
41.97 |
India |
|
24 |
11 |
Korean j.pl.path |
08 |
0.56 |
599 |
42.54 |
Korea |
|
25 |
12 |
Journal of Japanese
society for horticultural sciences |
07 |
0.49 |
606 |
43.03 |
Japan |
|
26 |
12 |
Indian j.pl.prot |
07 |
0.49 |
613 |
43.53 |
India |
|
27 |
12 |
Ann.of Appl.biol |
07 |
0.49 |
620 |
44.03 |
United Kingdom |
|
28 |
12 |
Archive of virology |
07 |
0.49 |
627 |
44.53 |
Austria |
|
29 |
12 |
Archives of Virology,
Supplement |
07 |
0.49 |
634 |
45.02 |
Germany |
|
30 |
12 |
j.Austrain virology |
07 |
0.49 |
641 |
45.52 |
Austria |
|
31 |
12 |
New Zealand journal of
agricultural research |
07 |
0.49 |
648 |
46.02 |
NewZeland |
|
32 |
13 |
Madras Agricultural
journal |
06 |
0.42 |
654 |
46.44 |
India |
|
33 |
13 |
European j.pl. pathol |
06 |
0.42 |
660 |
46.87 |
Europe |
|
34 |
13 |
Current Research in
Biotechnology |
06 |
0.42 |
666 |
47.3 |
Nether lands |
|
35 |
13 |
Indian j.of Agricultural sciences |
06 |
0.42 |
672 |
47.72 |
India |
|
36 |
13 |
Inter.j.trop.pl.Dis |
06 |
0.42 |
678 |
48.15 |
Netherlands |
|
37 |
13 |
International Arabic
Journal of Antimicrobial Agents |
06 |
0.42 |
684 |
48.57 |
Spain |
|
38 |
13 |
j. Maharashtra Agri
univ |
06 |
0.42 |
690 |
49 |
India |
|
39 |
13 |
Journal of nematology |
06 |
0.42 |
696 |
49.43 |
USA |
|
40 |
13 |
Mysore journal of
Agricultural sciences |
06 |
0.42 |
702 |
49.85 |
India |
|
41 |
13 |
Seed sci technology |
06 |
0.42 |
708 |
50.28 |
Switzerland |
|
42 |
14 |
Trop pest management |
05 |
0.35 |
713 |
50.63 |
India |
|
43 |
14 |
Journal of soil and
crops |
05 |
0.35 |
718 |
50.99 |
India |
|
44 |
14 |
Virology |
05 |
0.35 |
723 |
51.34 |
USA |
|
45 |
14 |
Bangladesh journal of
plant pathology |
05 |
0.35 |
728 |
51.7 |
Bangladesh |
|
46 |
14 |
Canadian j.bot |
05 |
0.35 |
733 |
52.05 |
Canada |
|
47 |
14 |
Appl. Environ.
microbial |
05 |
0.35 |
738 |
52.41 |
USA |
|
48 |
14 |
Journal of Dispersion
Science and Technology |
05 |
0.35 |
743 |
52.76 |
USA |
|
49 |
14 |
Journal of
Agricultural Science |
05 |
0.35 |
748 |
53.12 |
United kingdom |
|
50 |
14 |
Journal of American
society of horticultural science |
05 |
0.35 |
753 |
53.48 |
USA |
|
51 |
15 |
Netherland j.pl.pathol |
04 |
0.28 |
757 |
53.76 |
Netherland |
|
52 |
15 |
Journal of eco toxical and environ monitoring |
04 |
0.28 |
761 |
54.04 |
United Kingdom |
|
53 |
15 |
Journal of biological
control |
04 |
0.28 |
765 |
54.33 |
India |
|
54 |
15 |
Journal of applied biology
and biotechnology |
04 |
0.28 |
769 |
54.61 |
India |
|
55 |
15 |
j. oilseeds. Res |
04 |
0.28 |
773 |
54.9 |
India |
|
56 |
15 |
Indian j.pulses Res |
04 |
0.28 |
777 |
55.18 |
India |
|
57 |
15 |
Ann.pl.prot.Sci |
04 |
0.28 |
781 |
55.46 |
Belgium |
|
58 |
15 |
Horticulture Journal |
04 |
0.28 |
785 |
55.75 |
Japan |
|
59 |
15 |
Canadian j. plant
pathology |
04 |
0.28 |
789 |
56.03 |
Canada |
|
60 |
15 |
Canadian j. microbial |
04 |
0.28 |
793 |
56.32 |
Canada |
|
61 |
15 |
World.j.Agric.Sci |
04 |
0.28 |
797 |
56.6 |
Egypt |
|
62 |
15 |
Biological Control |
04 |
0.28 |
801 |
56.88 |
USA |
|
63 |
15 |
Acta phytopathologica Sinica |
04 |
0.28 |
805 |
57.17 |
China |
|
64 |
15 |
Adv.Sci |
04 |
0.28 |
809 |
57.45 |
Germany |
|
65 |
15 |
Agri.Res.j.kerala |
04 |
0.28 |
813 |
57.74 |
India |
|
66 |
15 |
Indian j.
pharmaceutical sci |
04 |
0.28 |
817 |
58.02 |
India |
|
67 |
15 |
Philippian journal of
Science |
04 |
0.28 |
821 |
58.3 |
Philippians |
|
68 |
16 |
Phytopathologia mediterranea |
03 |
0.21 |
824 |
58.52 |
Italy |
|
69 |
16 |
Punjab horticultural
journal |
03 |
0.21 |
827 |
58.73 |
India |
|
70 |
16 |
Pakistan j.phytopathology |
03 |
0.21 |
830 |
58.94 |
Pakistan |
|
71 |
16 |
Journal of
horticultural science |
03 |
0.21 |
833 |
59.16 |
India |
|
72 |
16 |
Journal of general
virology |
03 |
0.21 |
836 |
59.37 |
United Kingdom |
|
73 |
16 |
Egyptian Journal of
Biological Pest Control |
03 |
0.21 |
839 |
59.58 |
Egypt |
|
74 |
16 |
Indian j.of horticulture |
03 |
0.21 |
842 |
59.8 |
India |
|
75 |
16 |
Indian journal of
biotechnology |
03 |
0.21 |
845 |
60.01 |
India |
|
76 |
16 |
Australian journal of
plant pathology |
03 |
0.21 |
848 |
60.22 |
Australia |
|
77 |
16 |
Australian j.Agric.res
|
03 |
0.21 |
851 |
60.44 |
Australia |
|
78 |
16 |
Annals of plant
protection science |
03 |
0.21 |
854 |
60.65 |
India |
|
79 |
16 |
Annals of mycological |
03 |
0.21 |
857 |
60.86 |
United Kingdom |
|
80 |
16 |
Ann.Agri.sci |
03 |
0.21 |
860 |
61.07 |
Egypt |
|
81 |
16 |
Andhra Agricultural
journal |
03 |
0.21 |
863 |
61.29 |
India |
|
82 |
16 |
American potato j |
03 |
0.21 |
866 |
61.5 |
USA |
|
83 |
16 |
American j.bot |
03 |
0.21 |
869 |
61.71 |
USA |
|
84 |
16 |
Agricultural journal
of india |
03 |
0.21 |
872 |
61.93 |
India |
|
85 |
16 |
Agricultural
biological chemistry |
03 |
0.21 |
875 |
62.14 |
Japan |
|
86 |
16 |
Scientia Agricola |
03 |
0.21 |
878 |
62.35 |
Brazil |
|
87 |
16 |
Agria. J. of india |
03 |
0.21 |
881 |
62.57 |
India |
|
88 |
16 |
Agri.Appl.biol.sci |
03 |
0.21 |
884 |
62.78 |
Belgium |
|
89 |
16 |
Organic Agriculture |
03 |
0.21 |
887 |
62.99 |
USA |
|
90 |
16 |
African j. Biotech |
03 |
0.21 |
890 |
63.21 |
Africa |
|
91 |
16 |
Adv.Res.plant pathologenic.Bacteria |
03 |
0.21 |
893 |
63.42 |
USA |
|
92 |
16 |
Acta Horti |
03 |
0.21 |
896 |
63.63 |
Belgium |
|
93 |
16 |
Indian j. Genet |
03 |
0.21 |
899 |
63.84 |
India |
|
94 |
16 |
Indian.j. entomology |
03 |
0.21 |
902 |
64.06 |
India |
|
94 |
16 |
Indian j. pulses. Res |
03 |
0.21 |
905 |
64.27 |
India |
|
95 |
16 |
British journal of
Experimental pathology |
03 |
0.21 |
908 |
64.48 |
USA |
|
96 |
16 |
Chinese j. entomology |
03 |
0.21 |
911 |
64.7 |
China |
|
97 |
16 |
East African Agric for
j |
03 |
0.21 |
914 |
64.91 |
Africa |
|
98 |
16 |
Egyptian journal of
Agricultural Research |
03 |
0.21 |
917 |
65.12 |
Egypt |
|
99 |
16 |
Advances in
Geosciences |
03 |
0.21 |
920 |
65.34 |
Germany |
|
100 |
|
175 journals Cited 2
times 175*2=350 |
350 |
24.85 |
1,270 |
90.19 |
|
|
101 |
|
138 journals Cited 1
time 138*1=138 |
138 |
9.8 |
1,408 |
100 |
|
|
Total |
|
|
1,408 |
100 |
|
|
|
T5 shows that Ranking of Periodicals. A total of 1,408
Journal articles were identified out of which 236(16.76%) were “j.of.Phytopatholohy” from “United Kingdom”, is published followed
by 78(2.84%) were from “Indian j.mycol.pl.pathol” Published from “India” 40(2.84%) were from “Plant Disease” published
from “USA” and so on. Ozra
et al. (2016)
Table 6
|
Table 6 Geographical Wise Distribution of Journal Articles |
||||
|
Sl. |
Ranking No |
Country Name |
No. of Citations |
% |
|
1 |
1 |
India |
31 |
31.31 |
|
2 |
2 |
USA |
14 |
14.15 |
|
3 |
3 |
10 |
10.1 |
|
|
4 |
4 |
Netherlands |
5 |
5.05 |
|
5 |
5 |
Germany |
4 |
4.04 |
|
6 |
5 |
Egypt |
4 |
4.04 |
|
7 |
6 |
Belgium |
3 |
3.03 |
|
8 |
6 |
Canada |
3 |
3.03 |
|
9 |
6 |
Japan |
3 |
3.03 |
|
10 |
7 |
Africa |
2 |
2.02 |
|
11 |
7 |
Australia |
2 |
2.02 |
|
12 |
7 |
Austria |
2 |
2.02 |
|
13 |
7 |
Brazil |
2 |
2.02 |
|
14 |
7 |
China |
2 |
2.02 |
|
15 |
7 |
Italy |
2 |
2.02 |
|
16 |
7 |
Korea |
2 |
2.02 |
|
17 |
7 |
Switzerland |
2 |
2.02 |
|
18 |
8 |
Bangladesh |
1 |
1.01 |
|
19 |
8 |
Europe |
1 |
1.01 |
|
20 |
8 |
Malaysia |
1 |
1.01 |
|
21 |
8 |
Pakistan |
1 |
1.01 |
|
22 |
8 |
Philippians |
1 |
1.01 |
|
23 |
8 |
Spain |
1 |
1.01 |
|
Total |
99 |
100 |
||
T6 shows that Geographical wise distribution of journal articles. A total of 1,408 Journal articles 99 Countries were identified out of which the highest 31(31.31%) are From “India” followed by 14(14.15%) from “USA” is the second top country, 10(10.10%) from “United Kingdom” is the Third top country and 5(5.05%) “Nether lands” is the fourth top country and So on. Rajendran et al. (2011)
Table 7
|
Table 7 Age Wise Distribution of Journal References |
|||
|
Years |
No. of years |
No. of Citations |
% |
|
2008-1998 |
10 |
412 |
29.27 |
|
1997-1987 |
10 |
391 |
27.77 |
|
1986-1976 |
10 |
282 |
20.02 |
|
1975-1965 |
10 |
141 |
10.01 |
|
1964-1954 |
10 |
83 |
5.9 |
|
1953-1943 |
10 |
43 |
3.05 |
|
1942-1932 |
10 |
22 |
1.57 |
|
1931-1885 |
46 |
34 |
2.41 |
|
Total |
1,408 |
100 |
|
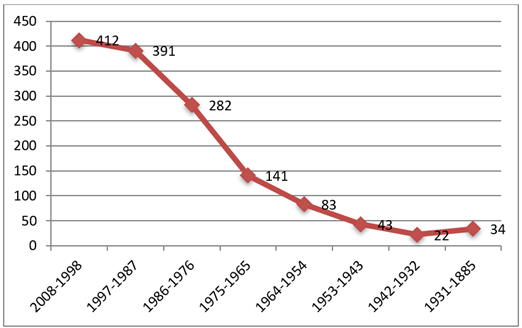
T7 shows that Age wise distribution of journal references out of 1,408 references there are 412(29.27%) were highest from the period “2008-1998” followed by 391(27.77%) references from the period “1997-1987”, 282(20.02%) references from the period “1986-1976”, 141(10.01%) references from the period “1975-1965” and so on. Yildi & Kadir (2016)
Figure 3
|
Figure 3 Age Wise Journal Citations Distribution |
5. Findings and conclusion
1) It is observed in T1 that Year wise Submission of Doctoral thesis in Vegetable Pathology. A total of 2,327 citations were identified from 12 Thesis. The highest 5(41.67%) number of theses submitted in 2009.
2) It is observed in T2 that the Average number of Citations in each thesis the total number of 12 thesis were called 2,327 Citations. Their average citations in each thesis is 193.91%.
3) It is observed in T3 that Types of documents cited by researchers. A total of 2,327 Citations there are 1,408(60.50%) citations from “Journal Articles”, Followed by 400(17.19%) are from “Books”, 317(13.63%) are from “Conference proceedings”, 172(7.40%) are from “Thesis and Dissertations”.
4) It is observed in T4 that Authorship pattern of citations. A total of 1,408 Citations there were 232(16.48%) citations are from “Single Author” and 1,176(83.52%) are “Multi Authors”.
5) T5 shows that Ranking of Periodicals. A total of 1,408 Journal articles were identified out of which 236(16.76%) were “j.of.Phytopatholohy” from “United Kingdom”, is published followed by 78(2.84%) were from “Indian j.mycol.pl.pathol” Published from “India”.
6) T6 shows that Geographical wise distribution of journal articles. A total of 1,408 Journal articles 99 Countries were identified out of which the highest 31(31.31%) are from “India” followed by 14(14.15%) from “USA” is the second top country,
7) T7 shows that Age wise distribution of journal references out of 1,408 references there are 412(29.27%) were highest from the period “2008-1998” followed by 391(27.77%) references from the period “1997-1987”.
CONFLICT OF INTERESTS
None.
ACKNOWLEDGMENTS
None.
REFERENCES
Bin Li, Kai Hu & Yin Shen (2020). A Scientometric Analysis Of Global Terahertz Research By Web Of Science Data, Ieee Access, (8). https://doi.org/10.1109/ACCESS.2020.2981999
Garga K.C. & Tripathib H.K. (2018). Bibliometrics And Scientometrics In India: An Overview Of Studies During 1995-2014 : Part Ii: Contents Of The Articles In Terms Of Disciplines And Their Bibliometric Aspects, Annals Of Library And Information Studies,(65) March, 7-42.
Jozi, Z.& Nourmohammadi, H.(2022). Scientometrics Analysis Of World Scientific Research Of Pathology And Forensic Medicine, Iranian Journal Of Pathology, 17(2): 191-201. https://doi.org/10.30699/ijp.2022.541660.2756
Koteppa Banateppanvar, B.S. Biradar, & B.U. Kannappanavar (2013)."Citation Analysis Of Doctoral Theses In Botany Submitted To Kuvempu University, India: A Case Study", Collection Building, 32(1), 12 - 21. https://doi.org/10.1108/01604951311295058
Norma Salgado-Orellana, Emilio Berrocal De-Luna & Calixto Gutiérrez-Braojos (2020). A Scientometric Study Of Doctoral Theses On The Roma In The Iberian Peninsula During The 1977-2018 Period, Research Gate. https://doi.org/10.1007/s11192-020-03723-y
Ozra Tabatabaei-Malazy, Amir Ramezani, Rasha Atlasi, Bagher Larijani & Mohammad Abdollahi (2016). Scientometric Study Of Academic Publications On Ant Oxidative Herbal Medicines In Type 2 Diabetes Mellitus, Journal Of Diabetes And Metabolic Disorder, 15:48. Doi 10.1186/S40200-016-0273-3. https://doi.org/10.1186/s40200-016-0273-3
Rajendran P, R.Jeyshankar & B. Elango (2011). Scientometric Analysis Of Contributions To Journal Of Scientific And Industrial Research, International Journal Of Digital Library Services, 1(2).
Yildi, Z. & Kadir, (2016). "Scientometric Analysis Of Technology & Innovation Management Literature". Theses And Dissertations. 419.
 This work is licensed under a: Creative Commons Attribution 4.0 International License
© Granthaalayah 2014-2024. All Rights Reserved.