Synthesis and Photoluminescence properties of Eu3+doped Sr2P2O7phosphors
Atchyutha Rao 1 ![]() ,
N. Bujji Babu 2,
K.V.R. Murthy 3
,
N. Bujji Babu 2,
K.V.R. Murthy 3
1 Department
of Physics, GDC-NAKKAPALLI, ANAKAPALLI (DT), A.P, India
2 Department
of Chemistry, PR Government Degree College (A), Kakinada, A.P, India
3 Display Materials Laboratory, Applied Physics Department, M. S.
University of Baroda, Vadodara, India
|
|
|
ABSTRACT |
|
|
In the present
paper, it has been reported that the synthesis and photoluminescence
properties of Eu3+doped Sr2P2O7pyrophosphate phosphors were prepared by
conventional solid state reaction method. The rare-earth ion-doped phosphors
are significant while considering their stability and solubility. The assimilation
of RE3+ activators into single-centered hosts up to complete changeover of
entire cations offers the probability to obtain the pretended self-stimulated
crystals. The luminescence investigations of a series of such complexes make
available much-appreciated statistics in the optical applications. It
increases in the activator concentration makes the luminescence materials
brighter. Investigations on powder X-ray Diffraction (XRD), SEM, PL and FTIR
have been carried out. And also, the luminescence
properties such as excitation and emission spectra are determined. |
|||
|
Received 20 July
2024 Accepted 23 August 2024 Published 30 September 2024 Corresponding Author Atchyutha Rao, atchyyuth@gmail.com DOI 10.29121/granthaalayah.v12.i9.2024.5780 Funding: This research
received no specific grant from any funding agency in the public, commercial,
or not-for-profit sectors. Copyright: © 2024 The
Author(s). This work is licensed under a Creative Commons
Attribution 4.0 International License. With the
license CC-BY, authors retain the copyright, allowing anyone to download,
reuse, re-print, modify, distribute, and/or copy their contribution. The work
must be properly attributed to its author.
|
|||
|
Keywords: Strontium Pyrophosphate Phosphors, Rare
Earth Ion (Eu3+), Conventional Solid State Reaction Method |
|||
1. INTRODUCTION
The luminescent materials are generally called as phosphors that emit light when it is excited by radiation. Majority phosphors consisting of solid inorganic polycrystalline powder materials. The phosphors mainly consisting of a host lattice and a small fraction of intentionally doped impurity ions Blasse, G., (1979) Generally, the percentage concentrations of impurity ions are taken low, because of the luminescence yield decreases at higher concentrations due to the quenching. The absorption of incident radiation energy is taken place by the host lattice or by the impurity ion. In the major luminescence process, the exciting radiation energy absorbed by the doped impurity ions also called as an activator, raising it to the excited state. The excited state can return to the ground state by the emission of visible radiation. In some cases, when the activator ions are not capable of absorption radiation, another type of impurity ions can be added called as sensitizers Blasse et al. (2012) Blasse, et al.(n.d.) The sensitizer ions can absorb the radiation energy and consequently transfer this energy to the activator ions to raising it to excited state. In this type of process, the energy transport phenomenon has been involved through luminescent materials. The range of emission wavelength can be adjusted by selecting the appropriate impurity ions or a combination of impurity ions in the same host lattice Dexter et al. (1953). Some trivalent rare earth activator ions show their characteristic emission spectra which cannot be affected by the chemical environment of the host lattice Dexter et al. (1953), Dhoble et al. (2003)
A luminescent phosphor is a solid, which converts certain
types of energy into electromagnetic radiation over and above thermal
radiation. The luminescence from the phosphors can acquire by exciting the
phosphor in different excitation radiations such as UV and visible radiation
(photoluminescence), a beam of energetic electrons (cathodoluminescence),
x-rays (x-ray excited luminescence), etc. Luminescence measures the energy
levels of the luminescence centers formed inside the
phosphors. The energy level of a luminescence center
is defined as its characteristic state, which is related to the physical nature
of the center and to the energetic and dynamic
processes that the center undergoes. Rare earth doped
inorganic luminescent materials are well known for emission in distinct
wavelengths in the electromagnetic spectrum. The phosphors have a wide range of
applications in the lighting devices such as cathode ray tubes (CRT), tri-phosphor
fluorescent lamps, x-ray intensifying screens and newly developed vacuum mercury-free
lamps. It has other applications in a display such as plasma display panels and
field emission displays. The momentous application of phosphors for light
emitting diodes (LEDs) technology changes the history of the solid-state
lighting and has completely changed the “world of luminance”. LEDs are
significantly energy-efficient lighting device with a long lifetime Edgar et al.
(2017), Fonda et al. (1950).
Phosphates and pyrophosphates are the different condensed and polymeric form of mono-phosphoric acid. Pyrophosphate is one type of the phosphorus oxyanion with general formula P2O74- also called as diphosphate or di-polyphosphate. The oxyanion is generally termed as MXOYZ- (M = C, S, P, F; O - Oxygen). Oxyanions are designed from a large number of the chemical elements which can be banded with one or more oxygen atoms. Phosphate materials are categorized into three types of phosphates; (i) monophosphates, (ii) condensed phosphates, (iii) oxyphosphates. According to literature of the luminescence, many researchers published articles based on the various inorganic pyrophosphate groups, where the synthesis and luminescence properties were investigated for a different application in various methods. All the possible formation phase change effect of Eu3+ doping on photoluminescence properties of CaP2O7 is investigated. UV spectral emission of HfP2O7 and blue emission of Ti4+ doped HfP2O7 is investigated for their x-ray storage application. The investigation of the energy gap of ABP2O7 (A = Na+, Li+; B = Al3+, In3+) double phosphates from the electronic structure and the optical properties were reported by Hizhnyi et al [10]. Finally, it is concluded that the different inorganic pyrophosphates were shows very good luminescent behavior. They were adopted in different type of preparative methods were used to prepare the pyrophosphate phosphors, but the majority were synthesized by conventional solid-state method, it is very easy, bulk materials were prepared and need not required sophisticated equipment and also non-toxic in nature. Therefore, in this paper reported, synthesis and photoluminescence properties of Eu3+doped Sr2P2O7 pyrophosphate phosphors were successfully synthesized by conventional solid state reaction method fired at 1200°C for 3hours. The prepared phosphors were characterized by subjected to PL, XRD, SEM and FTIR analysis factors were affecting on the structure and performance of the phosphors were studied.
2. Experimental Method
The conventional Solid state reaction method was utilized for preparing these phosphors, which is the simpler and standard method. The inorganic compounds like Strontium carbonate (SrCO3), Ammonium phosphate (NH4)2HPO4and Europium Oxide (Eu2O3) (A.R) of high purity (99.9%) chemicals were used as starting materials. First, we prepared Sr2P2O7pyrophosphate phosphor, without adding any dopants, as a host material, by weighing Strontium carbonate (SrCO3), Ammonium phosphate (NH4)2HPO4in stoichiometric proportions of 2:1. The compounds were mixed with a spatula and then ground into a fine powder using an agate mortar and pestle for 30 minute to obtain homogeneous mixture. The homogeneous mixture was transferred into alumina crucible and put inside the muffle furnace for heat treatment at 1200°C in the air for 3 hours in a muffle furnace with a heating/cooling rate of 5oC/min. After heating treatment, the furnace was allowed to cool naturally to the room temperature [11-14]. All prepared samples were in the pure white powder form. The samples were grinded in a mortar–pestle for half hour to obtain the homogeneous fine powder form. Similar procedure is been followed for Eu3+ doped Sr2P2O7pyrophosphate phosphors. All phosphors were successfully synthesized in pure powder form.
To identify the crystal phase, XRD analysis was carried out with a powder diffractometer (Rigaku-D/max 2500) using Cu Kα radiation. The Photoluminescence (PL) emission and excitation spectra were measured by Spectrofluorophotometer (SHIMADZU, RF-5301 PC) using a Xenon lamp as an excitation source. All the spectra were recorded at room temperature. The morphologies (SEM) of the phosphor powders were obtained by using the Nova NanoSEM450.FTIR analysis analytical techniques were used by (JASCO–4600) for the starching and bending analysis of the samples. Fourier transform infrared (FTIR) spectra of the samples were recorded by FTIR-4100 type A IR spectrometer in transmittance mode in wave number range of 400–4000 cm-1.
3. Results and discussion
3.1. Crystal structure analysis
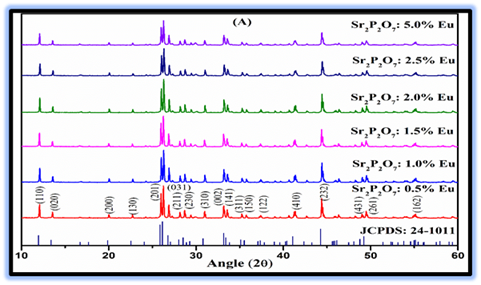
Figure 1 Depicted the XRD patterns of Eu3+ doped Sr2P2O7 phosphor with different (mol %) concentrations. The XRD patterns of Eu3+doped Sr2P2O7 samples are compared with JCPDS standard card no. 24-1011. The hkl parameters of the prepared samples are similar to that of the JCPDS standard card no. 24-1011 of α-Sr2P2O7 that indicates the existence of a pure single-phase α-Sr2P2O7. The structural parameters of the samples were analyzed using powder software for XRD analysis. The analysis confirms that the samples have a pure α-phase with crystallization in the orthorhombic structure and space group of Pnam. The doping of various Eu3+ ions and with their different (mol%) concentrations does not make any perceptible variation in XRD patterns as well as no other peaks found than that of Sr2P2O7 in these patterns Rao et al. (2023), Rao et al. (2024) This indicates that the prepared samples are single phased and substitution of Sr2+ by Eu3+ does not cause any substantial modification in the crystal structure of host. Some prominent intense peaks are observed in the XRD patterns of Eu3+ doped Sr2P2O7 phosphor with different (mol%) concentrations at different 2θ values of 12.12°, 25.95°, 26.27°, 26.93°, 33.16°, 33.63° and 44.40° corresponding to the (110), (201), (031), (211), (002), (141) and (232) planes for these host lattice respectively. Sharp intense peaks in the XRD patterns of Eu3+ doped Sr2P2O7 phosphor with different (mol %) concentrations signify that all samples were polycrystalline structure. Detailed lattice parameters of pure Sr2P2O7phosphors with calculated values from the experimental values using powder X software and the values reported in literature are summarized in Table 1The calculated Crystalline parameters and Crystallite size of Eu3+ doped Sr2P2O7phosphors with different (mol %) concentrations were shows in Table 2The average crystallite size of Eu3+ doped Sr2P2O7phosphors with different (mol %) concentrations were calculated by using the Scherer’s formula. From the table it observed that the lattice parameter values, unit cell volume and crystallite size decreases as on the Eu3+ doped Sr2P2O7 phosphors with different (mol%) concentrations increases, which is suggest that the incorporation of doing ion increases as at higher temperature.
Figure 1
|
Figure 1 XRD Patterns of Eu3+Doped Sr2P2O7Phosphor with Different (Mol %) Concentrations |
Table 1
|
Table 1 Crystal Structure Parameters of Pure Sr2P2O7phosphor |
|||||
|
JCPDS (24-1011) Data |
Experimental Data of
pure Sr2P2O7 phosphor |
||||
|
a = 8.917 Å |
b = 13.160 Å |
c = 5.400 Å |
a = 8.993 Å |
b = 13.236 Å |
c = 5.523 Å |
|
V = 633.677 Å3 |
V = 657.648 Å3 |
||||
Figure 2
|
Table 2 Crystal Structure Parameters &Crystallite Size Ofeu3+Doped Sr2P2O7phosphor with Different (Mol %) Concentrations |
|||||
|
Sample |
Lattice Parameter |
Volume of Unit Cell |
Crystallite Size (nm) |
||
|
a (Å) |
b (Å) |
c(Å) |
‘V’ (Å3) |
||
|
Sr2P2O7:
0.5 mol% Eu3+ |
8.872 |
13.175 |
5.442 |
636.11 |
72.84 |
|
Sr2P2O7:
1.0 mol% Eu3+ |
8.867 |
13.168 |
5.435 |
634.59 |
71.95 |
|
Sr2P2O7:
1.5 mol% Eu3+ |
8.861 |
13.16 |
5.429 |
633.08 |
70.45 |
|
Sr2P2O7:
2.0 mol% Eu3+ |
8.852 |
13.155 |
5.422 |
631.38 |
68.92 |
|
Sr2P2O7:
2.5 mol% Eu3+ |
8.847 |
13.146 |
5.417 |
630.01 |
68.01 |
|
Sr2P2O7:
5.0 mol% Eu3+ |
8.829 |
13.121 |
5.397 |
625.21 |
65.83 |
3.2. Photoluminescence analysis.
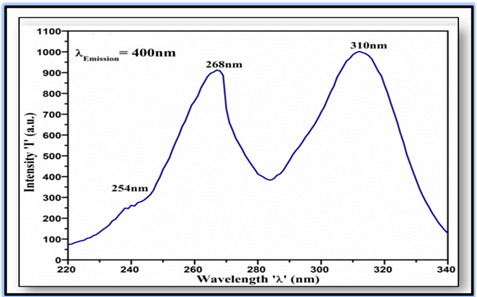
The PL excitation spectra of Eu3+doped Sr2P2O7phosphor were recorded at λEmission = 400 nm is shown in Figure 2. In excitation spectra, two broad excitation bands at 268 nm and 310 nm are ascribed to the 5d – 4f electronic transitions of Eu3+ in the host lattice. A shoulder peak at 254 nm at the beginning of the excitation spectra is ascribed due to the host absorption. The broad absorption band at 310 nm is attributed due to the allowed transition from the 2F5/2 ground state to the lowest 5d state of Eu3+located at the host lattice site of Sr2+ ion. The weak absorption peak at 254 nm and the strong absorption band of host occurs at 268 nm, which corresponds due to the valance band to conductionband inter-band transition of Sr2P2O7hosts. The strong broad absorption band shaped in the range of 282 – 340 nm might occur owing to the three closely lying bands correspond to the Eu3+ intra-ion 4f→5d(j) (j = 1, 2, 3) transitions. The geometric deviation of octahedra of Eu3+ ion in host lattice is not large enough to make 5d(j) (j=1, 2, 3) sub-levels well separated which is the reason for the occurrence of broad absorption centered at 310 nm.
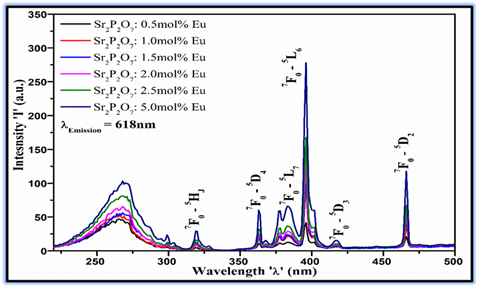
Figure 3 Dipected
the excitation spectra of Eu3+doped Sr2P2O7phosphor with different (mol%)
concentrations were recorded at 618 nm emission wavelength at room temperature.
The excitation spectra consist of a broad band and some sharp lines in the
UV-Blue range 350-500 nm. The excitation spectra of the phosphor show
predominant excitation under the 5D0→7F2 (618 nm) emission of Eu3+ ions
and it can remain constant for all doping concentration. The excitation
intensity is been prominent for the high concentration
of 5.0 mol% Eu3+, it reveals absorption of incident photons increases with the
increase in doping concentration. The broad band centered
at 266 nm could be attributed due to the charge-transfer transition band of
doping ion and oxygen ion of the host lattice (Eu3+-O2). The energy of the
charge transfer state (CTS) essentially depends on the environments of host
surrounding the doping ion. The energies of CTS and 4f states of trivalent rare
earth ion are the relatively same for rare-earth ions in any host materials.From the Figure 3 It is also observed
that the broad band excitation with maximum peak intensity at 266 nm is
occurred due to CTS, where the charge transfer from host Sr2+ to dopant Eu3+.
The energy of excitation peak is 37.6×103 cm–1 and it is comparable to that of
the energy of commercial phosphor 40×103 cm-1. As a result, CTS interact with
4f states and it can lead to f-f emissions. The
excitation spectra contain discrete sharp lines due to the characteristic 4f–4f
transitions of Eu3+ion at 396 nm (7F0→5L6) and 466 nm (7F0→5D2)
indicating that Eu3+doped Sr2P2O7phosphor can be efficiently excited by UV-blue
LED (350–480 nm) and blue-LED chips (465 nm). The excitation spectra also
contain several small excitation lines ascribed due to the 7F0→5D4 (363
nm), 7F0→5L7 (383 nm), and 7F0→5D3 (417 nm) transitions of Eu3+
ions. The phosphors for LED application should be excited in the range of the
near violet-blue region of the excitation spectra. The prominent red-emitting
UV-LED phosphor exhibit absorption at 395 nm (i.e., LED excitation wavelength)
are potential for orange-red LED Rhodes et al. (2011), Richter et al. (2007)
The experimental results of PL emission revealed that the percentage of the non-centrosymmetric site is much higher than that of the centrosymmetric site for the higher concentration of doping. Doped Eu3+ ions in phosphors can occupy the sites that have noninversion symmetry and the intense red emission due to the electric dipole transition is utilized for practical applications. The maximum sensitivity of the human eye to sense spectral luminous wavelength is about 555 nm. As the spectral luminous move towards the longer wavelengths i.e, in the red region, the sensitivity falls quickly. The red emission made up of narrow sharp spectral lines could be the brighter appearance to the human eye than that of the broad red emission having the identical red color chromaticity and emission energy. To achieve the ideal red emission of color TV to be used in the NTSC system.
Figure 2
|
Figure 2 PL Excitation Spectra of Eu3+ Doped Sr2P2O7 Phosphor |
Figure 3
|
Figure 3 Excitation Spectra of Eu3+ Dopedsr2p2o7phosphor with Different (Mol %) Concentrations |
3.3. FTIR analysisS
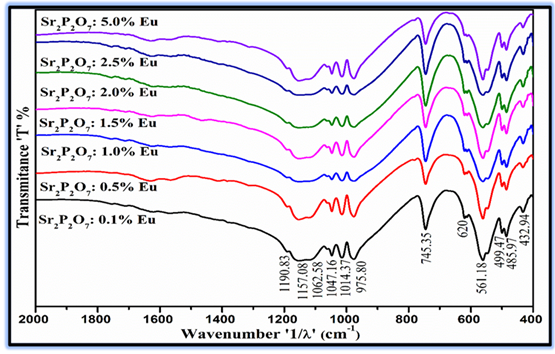
FTIR transmittance spectra of Eu3+ doped Sr2P2O7 phosphor with different (mol %) concentrations were synthesized by conventional solid state reaction method were depicted Figure 4The FTIR spectra of Eu3+ doped Sr2P2O7 phosphor with different (mol%) concentrations were recorded for the wave number range from 400 – 4000 cm-1, the fingerprint region of the FTIR spectra of the range 400–2000 cm-1 has been demonstrated in the graph. All FTIR spectra were recorded from the KBr pellet of Sr2P2O7. The KBr pellets for all samples were prepared for 99:1% ratio of KBr to Sr2P2O7. The thickness of each pellet is approximately maintained up to 1 mm which has semi-transparent nature. Various transmittance bands of pyrophosphate group and phosphate group are observed in the FTIR spectra. FTIR spectra of the phosphors show the evidence of the multiple vibrational bands. The pyrophosphate group (P2O7)4- could be the form of O3P-O-PO3, and can be attributed to an assembly of the vibration modes of the PO3 groups and the P-O-P groups. The formation of the P2O74- modes in the phosphor is conceded on the basis of the PO3 and P-O-P vibrations. From the Figure 4 it is observed that the FTIR spectra ofEu3+ doped Sr2P2O7 phosphor with different (mol %) concentrations were consistent for all samples and there is no change in peak position. The FTIR spectra of Eu3+ doped Sr2P2O7 phosphor with different (mol %) concentrations shows characteristic bands at 433.90, 486.94, 500.43, 563.11, 620, 746.31, 974.84, 1014.37, 1047.16, 1062.58 and 1190.83 cm-1. The intense peak attributed to the P-O-P symmetric stretching vibration mode is been observed at 746.31 and 974.84 cm-1 in the IR spectrum [44, 45]. It could be assigned to the symmetric stretching of the P-O-P bonds in the (P2O7)4- group Schipper et al. (1994), W.M. et.al (2004)The FTIR bands are manifest characteristic of the vibration modes of the pyrophosphate and phosphate groups in the phosphors. Thus, from the FTIR results it is found that the formation of phosphors was consistent and having uniform crystal phase formation as analyzed in x-ray diffraction.
Figure 4
|
Figure 4 FTIR Spectra of Eu3+ Doped Sr2P2O7 Phosphor with Different (Mol %) Concentrations |
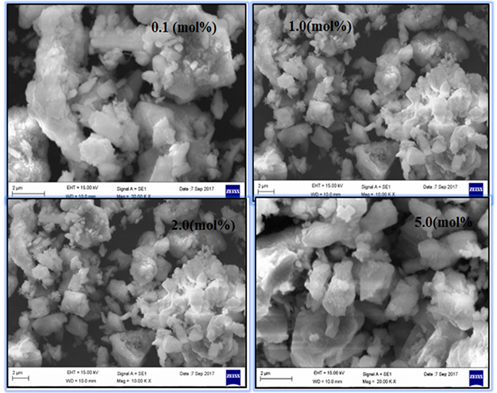
3.4. SEM analysis
The particle size and surface of the phosphors is significantly more important criterion for the commercial applications of the phosphors in solid state lighting. The phosphors having micron particles size and smooth surface can be feed well the commercial demand for White LEDs and lamp phosphors. The SEM images of Eu3+doped Sr2P2O7 phosphor with different (mol %) concentrations were synthesized at 12000C annealing temperatures only few concentrations are shows in Figure 5 The powder form of Eu3+doped Sr2P2O7 phosphor materializes in highly crystalline form with uneven morphology observed under different resolution and the average grain size of 2µm. It is observed that the crystallites particles having non-uniform shape with evolved boundary of submicron size and strongly agglomerated Yen et al. (2006), Yu et al. (2002)It could be occurred due to the non-uniform temperature distribution during the firing of material by flux during synthesis. The surface morphology of the particles is smooth for both concentrations of doping which could be observed due to melting occurred at the surfaces of certain particles at high temperature.
Figure 5
|
Figure 5 SEM Images of Eu3+ Doped Sr2P2O7 Phosphor with Different (Mol %) Concentrations |
4. CONCLUSIONS
· In conclusion, we successfully synthesized by conventional solid state reaction method has been followed by Eu3+doped Sr2P2O7 phosphor with different (mol %) concentrations were synthesized at 12000C annealing temperatures for 3 hours. In this process, the reaction temperature for the formation of Sr2P2O7 phosphor is found to be lower compared to other methods and this is one of the important results of the present work.
· The method followed has several benefits such as low cost, energy efficiency, high production volume, no toxic in nature, do not require sophisticated equipment’s and above all, easy method of preparation. The PL of the Eu3+doped Sr2P2O7 phosphor with different (mol %) concentrations has been observed and analyzed.
· Some prominent intense peaks are observed in the XRD patterns of Eu3+ doped Sr2P2O7 phosphor with different (mol%) concentrations at different 2θ values of 12.12°, 25.95°, 26.27°, 26.93°, 33.16°, 33.63° and 44.40° corresponding to the (110), (201), (031), (211), (002), (141) and (232) planes for these host lattice respectively. Sharp intense peaks in the XRD patterns of Eu3+ doped Sr2P2O7 phosphor with different (mol %) concentrations signify that all samples were polycrystalline structure.
· Eu3+doped Sr2P2O7 phosphor with different (mol %) concentrations was excited under its major excitation wavelength of 396 and 466 nm. The PL emission occurs at 618 nm which is a red emission useful for LED applications. PL emission intensifications with increases in doping concentration, the maximum intensity of 618 nm emission peak for the 5.0 mol% Eu3+ is increased by 5-6 time than that of the 0.5 mol% Eu3+. The PL emission also depends on the crystallite sized, for Eu3+ doped Sr2P2O7 phosphor the PL intensity increase with decrease in crystallite size. The PL emission results of Eu3+ doped Sr2P2O7 phosphor suggest its potential application for white LED under blue excitation.
· The powder form of Eu3+doped Sr2P2O7 phosphor materializes in highly crystalline form with uneven morphology observed under different resolution and the average grain size of 2µm. It is observed that the crystallites particles having non-uniform shape with evolved boundary of submicron size and strongly agglomerated.
CONFLICT OF INTERESTS
None.
ACKNOWLEDGMENTS
One of the authors (Dr.CH. Atchyutha Rao) is grateful for the financial support from the University Grant Commission (UGC), New Delhi, India, under Minor Research Project (MRP No: 4687/14-SERO/UGC), and the author expresses their sincere thanks to Prof. K. V. R. Murthy to provide ‘Display Materials Laboratory Lab’ facility in M.S. University, Baroda. Also, very much thankful to the Principal GDC-NAKKAPALLI, ANAKAPALLE (Dt).
REFERENCES
Blasse, G. and B. Grabmaier,(n.d.). A General Introduction to Luminescent Materials,1994, Springer. p.1-9. https://doi.org/10.1007/978-3-642-79017-1_1
Blasse, G. and B. Grabmaier, Luminescent Materials, 2012 : Springer Science & Business Media.
Blasse, G., (1979). Handbook on the Physics and Chemistry of Rare Earths, 4 : p. 237-274.https://doi.org/10.1016/S0168-1273(79)04007-1
Dexter, D.L., (1953). A Theory of Sensitized Luminescence in Solids - 21(5) : p. 836-850. https://doi.org/10.1063/1.1699044
Dhoble, SJ, Dhoble, NS and Pode, RB. 2003. Bull. Mater. Sci., 26 : 377. https://doi.org/10.1007/BF02711179
Dubey, V., et al., (2014) Effect of Eu3+ Concentration on Photoluminescence and Thermoluminescence Behavior of YBO3 : Eu3+ phosphor. Superlattices and Microstructures,. 67 : p. 156-171. https://doi.org/10.1016/j.spmi.2013.12.026
Edgar, A., (2017) Luminescent Materials, Handbook of Electronic & Photonic Materials, Springer. p. 1-1. https://doi.org/10.1007/978-3-319-48933-9_38
Feldmann, C, Justel, T, Ronda, CR and Schmidt, PJ. 2003. Adv. Funct. Mater., 13: 511. https://doi.org/10.1002/adfm.200301005
Fonda, G.R., (1950). Luminescent Material, Google Patents.
Gaft, M., R. Reisfeld, and G. Panczer, (2015) Modern luminescence Spectroscopy of Minerals and Materials, : Springer. https://doi.org/10.1007/978-3-319-24765-6
Hizhnyi, Y.A., et al. (2008),Optical Materials,. 30(5): p. 687-689. https://doi.org/10.1016/j.optmat.2007.02.009
K. N. Shinde, S.J. Dhoble,
Journal of Optical. Ect. & Adv. Mat.13 (2011)
Murthy, K., (2012). Nano Phosphors for Light Emitting Diodes (LEDs) Syntheses and Characterization. Recent Research in Science and Technology. 4(8).
Page, P. and K. Murthy, (2010) Luminescence Associated with Eu3+ in two Host Lattices. Philosophical Magazine Letters. 90(9): p. 653-662 https://doi.org/10.1080/09500839.2010.491804
R. L. Kohale, S. J. Dhoble, Luminescence, (2012), DOI 10.1002/bio.2411
R.P. Rao, D.J. Devine, J. Luminescence. (2000) 87-89 1260-1263. https://doi.org/10.1016/S0022-2313(99)00551-7
Rao et al., J Adv Sci Res, (2024) 15 (4): 28-31 https://doi.org/10.55218/JASR.2024150404
Rao et al., (2019) K.V.R. Murthy, IJSR, ISSN : 2319-7064, Vol. 10 Issue 1, January 2021
Rao et al., (2020) K.V.R. Murthy, ISSN : 2320-5407, Int. J. Adv. Res. 8(12), 762-769, Dec-https://doi.org/10.21474/IJAR01/12209
Rao, C., Babu, N., & Murthy, K. (2022). Journal of Advanced Scientific Research, 13(05), 137-145. https://doi.org/10.55218/JASR.202213516
Rao, C.A., Babu, N.B. & Murthy, K.V.R. (2023). Eur J. of Theor. And Appl. Scie, 1(4), 1288-1295. https://doi.org/10.59324/ejtas.2023.1(4).118
Rhodes, E.J.,(2011). Optically Stimulated Luminescence Dating of Sediments Over the past 200,000 years. Annual Review of Earth and Planetary Sciences. 39 : p. 461-488. https://doi.org/10.1146/annurev-earth-040610-133425
Richter, D., (2007) Advantages and Limitations of Thermoluminescence Dating of Heated Flint from Paleolithic Sites. Geoarchaeology. 22(6): p. 671-683. https://doi.org/10.1002/gea.20180
Schipper, W., et al., (1994)On the Luminescence of Hafnium Compounds. MRB. 29(1): p. 23-30. https://doi.org/10.1016/0025-5408(94)90101-5
Shionoya, S., W.M. Yen, and H. Yamamoto, Phosphor Handbook, 2006 : CRC press.
Singh, D., et al., 2016 Advanced Magnetic and Optical Materials,: p. 317-352. https://doi.org/10.1002/9781119241966.ch10
W.M. Yen, et.al (2004) (Eds.), Composites, Preparation and Optical Properties, Vol. 20, CRC Press.
Yen, W.M. and H. Yamamoto, (2006) Fundamentals of phosphors. CRC Press. https://doi.org/10.1201/9781420043686
Yu,
M, Lin, J, Wang, Z, Fu, J, Wang, S, Zhang, HJ and Han, YC. 2002. Chem.
Mater., 14: 2224.
https://doi.org/10.1021/cm011663y
© Granthaalayah 2014-2024. All Rights Reserved.
 This work is licensed under a: Creative Commons Attribution 4.0 International License