Neighbourhood Accessibility and Active Living Pattern of Children: A Pilot Study in Nagpur, India
Vaishali Pedram 1![]()
![]() ,
Dr. Ujwala Chakradeo 2
,
Dr. Ujwala Chakradeo 2![]()
1 Research
Scholer, Smt. Manoramabai Mundle College of
Architecture, Nagpur, Maharashtra, India
2 Vice-Chancellor,
S.N.D.T. Women’s University, Mumbai, Maharashtra, India
|
|
|
ABSTRACT |
|
|
Purpose: This paper explores the association between neighbourhood accessibility and the active living patterns (ALP) of children in urban India. Focusing on outdoor out-of-school physical activities (OOPA), mode of travel to school (MTS), mode of travel to the neighbourhood (MTN), and habitual active independent home range (HAIHR), it seeks to understand the relationship between active living and neighbourhood outdoor physical environment (OPE) during middle childhood. Methodology: Defining the variable within the framework of the ‘Adapted Ecological Model for Active Living in Urban Indian Children’, this study employed a cross-sectional quantitative method to examine two neighborhoods in Nagpur, India. The subjective data was collected from 43 in-person surveys of 8–12-year-old children and objective data was computed using GIS. Results: Children’s ALP had significant positive associations with built density, traffic exposure, parents’ perception of personal safety, neighbourhood physical activity (PA) environment, license for independent mobility (IM) and gender. Children’s OOPA was significantly positively correlated with built density, neighbourhood PA environment, motivation for PA, license for IM and gender. Children preferred active MTS to school if schools were close by and they had licenses for IM whereas their active MTN depended on parent’s positive perceptions of personal safety in the neighbourhood and permission for IM. Longer HAIHR was related to lesser traffic, licenses for IM and parents’ positive perceptions of neighbourhood safety. Conclusion: This study has identified several key neighbourhood OPE (density, traffic, parental
safety concerns, PA environment), individual (gender, motivation), and
interpersonal (license IM) correlates shaping urban children’s active living
in India. |
|||
|
Received 05 June
2024 Accepted 10 July 2024 Published 15 August 2024 Corresponding Author Vaishali
Pedram, vaishali.pedram@gmail.com
DOI 10.29121/granthaalayah.v12.i7.2024.5742 Funding: This research
received no specific grant from any funding agency in the public, commercial,
or not-for-profit sectors. Copyright: © 2024 The
Author(s). This work is licensed under a Creative Commons
Attribution 4.0 International License. With the
license CC-BY, authors retain the copyright, allowing anyone to download,
reuse, re-print, modify, distribute, and/or copy their contribution. The work
must be properly attributed to its author.
|
|||
|
Keywords: Urban Childhood in India, Neighbourhood Accessibility, Active Living, Outdoor
Physical Environment |
|||
1.1. Global obesity and physical inactivity crisis
The prevalence of overweight among children has substantially increased in industrialised countries and is on a steady rise in developing countries, especially in the global south. Karki et al. (2019), Khadilkar et al. (2011), WHO. (2016) Over 340 million children and adolescents aged 5-19 years were overweight or obese in 2016 and globally its prevalence is on the rise essentially because of changing dietary patterns and increased inactivity among children WHO. (2021), WHO. (2006) Globally, more than 80% (85% girls and 78% boys) of school-going adolescents, aged 11-17 years, do not meet the current daily physical activity (PA) recommendations Goenka & Devarajan (2020), Guthold et al. (2010). Reduced PA among children is linked to increased CVD & NCD risk in adulthood and health problems during childhood such as cholesterol and blood lipids, high blood pressure, metabolic syndrome, and bone mineral density Biddle et al. (2004). Participating in various types of PA is important for children for its wide-ranging and lifelong benefits Eime et al. (2013). Countries’ progress is linked with children’s health, so it is in the national interest to prioritise children’s health. Physically active children are more likely to have positive outcomes in physical, social, psychological and cognitive domains of development. Childhood habits of PA set the foundation for a healthy adulthood contributing to the country’s economic growth and vitality of society.
1.2. A Critical Concern: Prevalence of Obesity and Inactivity in India
Although limited, the available literature reveals that
there is a significant increase in the prevalence of childhood obesity in urban
areas, especially in north India, among higher socio-economic groups as well as
in low-income groups Khadilkar et al. (2011), Ranjani
et al. (2016).
Nagpur has about 14% prevalence of overweight and obese children Tapnikar & Dhingra (2014), Thakre et al. (2011). In India, 73.9% (71.8% boys and 76 % girls)
of school-going children did not meet the minimum recommended 60 minutes of
MVPA per day Guthold et al. (2010). Besides this, epidemiological literature has linked the
prevalence of obesity with PA, diabesity and NCD among Indian children. There
is a large deficit in outdoor games and sports participation and lower PA
patterns in girls than in boys Aarthi et al. (2023),
Ranjani et al. (2016), Swaminathan et al. (2011). The recent comprehensive assessment of the
overall PA of children and adolescents (both urban and rural) by the 2022 India
Report Card, Active Healthy Kids India. (2022) also
confirms previous findings and reveals that about 47-53% of children and
adolescents get an adequate amount of overall PA, about 60% use active travel (AT) mode to school (higher
prevalence from rural areas) and there is no conclusion arrived about organised
sports participation and active play due to insufficient data. It also underscores significant gender
differences with boys being more likely meeting the recommended PA. 2022, India
Report Card also reveals poor ratings for urban infrastructure for walking and
biking, access to PA spaces, safety from crime and traffic pollution, and
aesthetics and finds that only 27-33% of community and physical environments (PE) are deemed satisfactory
for children’s PA. The report also points out that there is a lack of
coordinated national policy to promote PA among children Bhawra et al. (2023). There is a large knowledge and data deficit
on outdoor PA patterns, and determinants at the individual, and community
levels in India Villanueva et al. (2016).
1.3. Urban Challenges to Childhood in India
In the last decade
or so India’s urban areas underwent accelerated transformations due to joined
forces of urbanisation, liberalisation, and globalisation, leading to economic,
social, cultural, and physical changes affecting all aspects of people’s lives
including children who constitute over one-third 35.9% or 135 million as per Chandramouli et al. (2011) of the total urban population Kundu et al (2020). Some of the undesirable transformations taking
place in urban environments are congested and near breakdown of services in the
urban core, car-dependent and infrastructure-deficient fast-expanding urban
fringes, diminishing open spaces, parks and playgrounds, vehicular dominance on
urban streets, increased travel time to school, new housing typologies imposed
on the conventional residential environments.
Dutta et al. (2017) in their
quality assessment of Indian urban neighbourhoods have highlighted that
unregulated and poor-quality development has resulted in increasing traffic,
encroachment on public places and parks by other land uses and disappearing
lung spaces. These physical changes affect children in many ways like curbing
freedom of movement, restricting access to neighbourhood destinations, reducing
utilisation of PA facilities and compromising safety in the neighbourhood.
Alongside, there are some notable social-cultural changes underway such as
changing parenting styles, often characterised by overprotectiveness and time
shortage syndrome, Rudd. (2019) coupled with the ingress of ITC
technology in children’s play and communication patterns, the commodification
of play, and media promotion of global consumerism are collectively
contributing to the decline in children’s independent exploration of outdoor
environments and socialization. These interrelated processes bring about
changes in the daily lives of children like sedentary lifestyles and
diminishing social interaction and integration. These changes are affecting
children's physical, psychological and social health. There are up to 20
million adolescents with a severe mental health disorder in India Shastri. (2009). Suicide and self-harm rates are as high as
35.5 per 100,000 population among young people in India, which is the highest
in Southeast Asia WHO. (2017). Along
with obesity and physical inactivity, the alarming evidence of mental health
problems and other developmental needs demands immediate attention.
Higher levels of PA are associated with a wide range
of health benefits. Being adequately physically active is essential for the
physical, social, psychological, and cognitive development and the overall
well-being of children Moore
et al. (2008), Villanueva et al. (2016). Apart from physiological health, regular PA
proves beneficial for cognitive development and psycho-emotional regulations
like self-identity and self-efficacy, emotional regulation, and intellectual
functioning Biddle
et al. (2004), Sallis
et al. (1998). Several
International and national guidelines for health and physical fitness recommend
at least 60 min of moderate to vigorous physical activity each day for children
Cavill
et al. (2001), Corbin
et al. (2018).
1.4. Centering Children's Needs in India's Urban Development Agenda
India’s urban areas are expected to continue as
growth poles with a 600 million urban population and 75% share of GDP by
2030 PwC
India & Save the Children India (2015) The absolute number of urban
children and India’s five-decade-long demographic dividend window (2005-6 to
2055-56) has brought India’s young population into focus for its promise of
becoming a major contributor to the country’s present and future economic
growth Harjani. (2012). For a
developing nation, it is imperative to put the spotlight on its developing
generation, both fostering each other’s growth. Considering India’s unique
challenges of a large population of urban children, financial constraints, and
diverse socio-economic and cultural character, large-scale individual
interventions may prove impractical instead, hence taking up a public health
approach with a focus on outdoor PA as a multifaceted tool to achieve multiple
child outcomes can be effective. Substantial research from the developed world
has established that the built environment has a conducive role in promoting PA
Davison
& Lawson (2006), Ding
et al (2011), TRB Special Reoprt. (2005). There
is limited research in India on understanding the mechanisms through which
neighbourhood PE influences the active living pattern (ALP) of
children, particularly among the middle & low-income group populations.
Additionally, findings of the 2022 India Report Card, Bhawra et al. (2023) as mentioned earlier reveal that the
investment in physical infrastructure has been unable to improve children’s PA
outcomes in India. Considering the multifaceted nature of ALP and multiple
dimensions of PE in Indian urban neighbourhoods, there is a need for a more
comprehensive understanding of their mutual relationship.
Addressing this gap, a pilot study was conducted in
Nagpur, to explore how neighbourhood accessibility influences children’s ALP in
the urban Indian context. This study is a part of an ongoing larger study
focused on investigating the association between neighbourhood PE and key
developmental aspects of middle childhood. The aim and objectives of the pilot
study are as follows.
·
Aim: To investigate the influence of neighbourhood
accessibility measured as objective and subjective characteristics of outdoor
PE of the neighbourhood on children’s ALP, specifically focusing on children’s outdoor out-of-school physical activity (OOPA) and
AT to school and neighbourhood. This study focuses on investigating ALP during
the middle childhood stage of child development (8-12 years of age). The
reasons for selecting the middle childhood age group will be discussed further
in this paper.
·
Objective 1: To understand the
overall ALP of children in Nagpur and to explore the influence of gender on ALP
and other subjective measures.
·
Objective 2: To investigate the
relationship between the children’s ALP and neighbourhood of PE
characteristics.
2.
LITERATURE REVIEW
2.1. Global Evidence of Children’s Active Living and Neighbourhood Environment
The central tenet of AL is accumulating PA in
various forms and contexts throughout daily life. Children’s PA is influenced
by multiple determinants from demographic, physiological, psychological, social
and environmental domains Kohl & Hobbs, (1998), Sallis et al. (2000), Sallis
& Owen (1998). The persistent
rise of obesity, and physical inactivity among the growing population in
developed nations has encouraged the research to extend beyond a person-centred
approach to broader everyday environments to investigate factors influencing PA
in various domains. Extensive research
has explored the relationship between children’s PA and physical, social and
natural environments at the neighbourhood level Ding
et al. (2011), Franzini
et al. (2009). Research
has consistently identified several key characteristics of neighbourhood PE as
being associated with children’s outdoor PA and AT. These features can be
summarised as (i) Residential or population density;
(ii) Intersection density (or other measures of street connectivity); (iii)
Land-use diversity; (iv) Walkability (a composite measurement including the
previous three attributes); (v) Street level walking infrastructure and
perceptions of street environments; (vi) Accessibility or proximity to recreation,
sports, or play spaces or facilities, and proximity to the school as the key
determinant for active travel to school; (vii) Availability and accessibility
to public open and social spaces and natural environments such as parks, green
spaces, street greenery, and water bodies; (viii) perceptions of safety from
traffic and crime; (ix) Motorised traffic levels and the presence of main
roads; and (x) Social support and psychosocial factors Smith et al. (2017). Smith et al. (2017) have also drawn
attention to various micro-scale interventions in PE for their promise to
increase AT and PA levels among children and adults. Furthermore, these
features include (i) Multiple streetscape components
for walking or cycling; (ii) Installation of fitness/ playground equipment;
multiple park renovations; retrofitting existing spaces into pocket parks;
temporary road closures and play equipment; (iii) Higher residential,
recreation density and land-use mix; and (iv) Increased Street connectivity.
Growing recognition of neighbourhood PE in promoting people’s AL is evident as
WHO’s ‘Global Action Plan on Physical Activity 2018–2030 (GAPPA)’ specifically
underscores its importance by including the creation of active environments as
its key action area WHO. (2018) However, unlike the global north, the
relationship between neighbourhood PE with children’s PA is less explored in
the global south Nordbø et al. (2020).
2.2. Children's Physical Activity and Urban Environments in India
The research in India exploring the association of
neighbourhood environment on children’s PA is in a nascent stage. Few isolated
studies have explored this relationship primarily focusing on child-friendly
recreation spaces like parks in urban neighbourhoods Agarwal et al. (2021), Bhonsle
et al (2015). Khatavkar. (2018) has investigated the
relationship of children’s PA and mobility with the neighbourhood’s physical
and perceived characteristics. Tyagi et al. (2021) have explored the relationship between children’s IM and the
built and social environment in the neighbourhood of Kolkata, India and found
that the organic spatial growth akin to compact built form fosters children’s
IM and the influence of social cohesion and safety outweighs the influence of
PE. Tyagi
& Raheja (2021) adopted a
cross-sectional study design using objective and subjective measures for the
built and social environment and parent reporting for children’s IM. Kingsly
et al. (2020) in their study based
in Chennai, assessed a range of barriers and neighbourhood-level correlates of
AT to school among adolescents (12-17 years), using a cross-sectional design,
which included individual, social and environmental variables and included self-reported
measures and adopted surveys largely from well-established instruments like
NEWS Adlakha
et al. (2016) and NEWS-Rosenberg
et al. (2009). This study
demonstrated that long distances to school and parental restrictions are
prominent barriers to adolescents’ AT. Das et al. (2023)
developed a framework to evaluate child-friendly environments (CFE) in India,
which included parameters like safety, walkability, access to basic services,
green and open spaces, play areas, and social interaction.
India’s urban mission includes projects like ‘The Smart City Mission Smartcities. (2024), Pradhan Mantri Awas Yojana-Urban PMAY. (2015) and Atal Mission of Rejuvenation and Urban Transformations AMRUT. (n.d.) Atal Mission; which address some aspects related to children's AL like the provision of recreation spaces and pedestrian infrastructure, but these efforts lack a unified approach. Urban planning and design policies like Child-Friendly Smart Cities (CFSC) NIUA. (2016b), July 14); ITCN (Infant, Toddler, Caregiver-friendly neighbourhood) (MoHUA & BvLF, (2019) and I-Child indicators for child-friendly local development NIUA (2016a) ; incorporate provision and access to physical, social, and recreational infrastructure catering to children’s everyday needs at the neighbourhood scale ensuring a safe and healthy environment for children to live, learn, explore, and play. However, these policies are based on literature and methodologies from the developed world. Under the urban mission, a huge task is set out to construct vast urban infrastructure in the near future amongst economic constraints and socio-cultural complexities which require a context-specific approach. At this juncture, the scrutiny of the urban physical environment and its relationship with young children’s AL, health, and overall developmental outcomes is urgently needed to get insight into the ground situation and inform the area-based policies, guidelines, and procedures of future development of urban neighbourhoods in India.
2.3. Children’s Active Living and Neighbourhood Accessibility
2.3.1. Children’s Active Living
PA is a complex behaviour and can be interpreted in various ways depending on the context in which it is examined. PA refers to any form of muscular movement that results in energy expenditure Sallis & Owen (1998) and as a result encompasses diverse behaviours ranging from free play to walking, running, and organized sports Loon & Frank (2011). As the inquiry of PA as a matter of public health and behavioural science integrated with other disciplines like urban planning and design, the data, concepts, and methods were integrated and opportunities for promoting PA expanded Sallis et al. (2006). Active living (AL) is a way of life that integrates PA into daily routines. It is a broader concept that incorporates exercise, recreational activities, household, and occupational activities, and active transportation Edwards et al. (2006). For children “Active Living’ implies acquiring and enjoying health-enhancing PA accommodated in their daily routine. Children’s routine active recreation and active travel are two primary domains of their active living patterns (ALP) Biddle et al. (2004). Active recreation includes unstructured, spontaneous outdoor play, organised sports or PA programs. AT includes walking and cycling to school, parks, a friend’s house or other routine neighbourhood destinations like tuition classes, and corner stores Bhawra et al. (2023), Sallis & Glanz (2006).
2.3.2. Neighbourhood Accessibility
Neighbourhood accessibility is instrumental in facilitating children’s active recreation and AT. The neighbourhood accessibility is multidimensional encompassing a wide range of factors that influence children’s ability to reach various desired destinations and opportunities in the neighbourhood. To conceptualise neighbourhood accessibility for children, child-friendly environment approaches as discussed by Horelli (2007) and Cities Alive: Designing for Urban Childhoods’ Arup. (2017) are very useful. As informed by these child-friendly approaches and considering children’s needs and limited abilities, it's essential to focus on two key action areas, (i) Children’s everyday free, independent and active movement to safely travel, play and socialise in the neighbourhood and (ii) Children’s environmental affordances for recreational and routine utilitarian PA.". The most supported correlates for children’s AL are walkability, traffic speed/volume, access/proximity to recreation facilities, land-use mix, residential density, street connectivity and perceptions about PE. Other PE factors like functionality, safety, aesthetics, and quality of spaces are also essential factors as they have a substantial influence on children’s neighbourhood accessibility Davison et al. (2006), Ding et al. (2011), Leventhal & Brooks-Gunn. (2000).
2.4. Theoretical Underpinning and Conceptual Framework
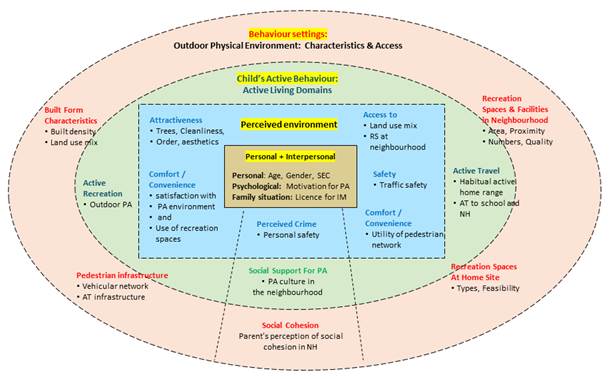
Theoretical models related to children’s active behaviour (recreational PA and active travel) in the neighbourhood setting with a specific focus on characteristics of the outdoor physical environment (OPE) have guided this study in understanding the underlying mechanisms of influence on children’s ALP. Children’s PA and AT are complex and diverse behaviours which are influenced by a wide range of factors spanning from individual characteristics, interpersonal aspects, and physical and social environmental characteristics Brodersen et al. (2005), Sallis & Owen(1998), TRB Special Reoprt. (2005). To incorporate the broad spectrum of influences on children’s PA behaviours many recent studies have adopted integrative models referred to as ecological models. A comprehensive framework of ecological models is useful for guiding PA research as they capture the complete interplay of individual, social and physical environmental factors accounting for multiple influences and demonstrate a better capacity to predict PA behaviour Giles et al. (2005), Loon & Frank(2011), Sallis et al. in their proposed ‘Ecological Model of Active Living’ for the general population suggest four domains of physical activities, recreation, transport, occupational and household. The ecological models are useful in informing the development of comprehensive intervention approaches that can systematically target mechanisms of change and influence. The behaviour change is expected to be maximised when the individual, physical and social environmental interventions are implemented in a synergetic manner Sallis et al. (2008). The conceptual framework guiding this study was informed by Sallis et al. (2006) ecological model for AL and other relevant ecological models specifically addressing children’s PA Loon & Frank (2011) and AT behaviours Panter et al. (2008). The conceptual framework incorporates neighbourhood OPE characteristics in the form of groups of variables as presented in the schematic diagram of the ‘Adapted Ecological Model for Active Living in Urban Indian Children’ (See Figure 1)Sallis & Glanz (2006) and discussed in the following section.
Figure 1
|
Figure 1 Adapted Ecological Model Adopted Ecological Model of Active Living for Children in Urban India Sallis & Glanz (2006) |
2.5. Variables of interest
Building upon the
conceptual framework (See Figure 1) discussed above we further discuss the
mechanisms through which the neighbourhood PE variables influence the
children’s active living pattern (ALP). Operational definitions and measurement
approaches of these variables are provided in Table 1. We have adopted Davison and Lawson’s Davison & Lawson, (2006) definition of ‘Physical Environment’ and
describe the neighbourhood PE in terms of its objective and perceived
characteristics of the physical context in which children spend their time
(neighbourhood) including aspects of built form (residential density, land-use,
street pattern), accessibility
(pedestrian and cycling infrastructure, traffic volume and speed,),
amenities (availability and proximity of local shops, recreation facilities
like parks and playgrounds and child related other destinations) perceived
characteristics like safety, aesthetics.
2.5.1. Active living Patterns (ALP) of children
Referring to the discussion on AL in the earlier part of this paper, and focusing on evaluating the overall integration of PA in children’s daily routine lives, four distinct components were identified and operationalised to assess children’s ALP: (i) Outdoor out-of-school PA in a usual week (OOPA) (frequency and duration); (ii) Usual Mode of travel to school (MTS ); (iii) Usual Mode of travel to neighbourhood destinations (MTN); and (iv) Habitual active independent home range (HAIHR). Frequency is the measure of regularity of being physically active Telama et al. (2006), Veitch et al. (2010). The duration of outdoor out-of-school PA was measuring the quantum of PA Chinapaw et al. (2010). Walking or cycling to school and routine neighbourhood destinations is the major contributor to children’s daily accumulation of PA Carver et al. (2008). MTS and MTN refer to the choice between active versus passive modes of travel. The active-independent home range is an indicator of children’s ability to access facilities and utilize opportunities their neighbourhood offers for recreation and AT. All these four components describe the ALP of children Moore (1978).
2.5.2. Neighbourhood
Outdoor Physical Environment (OPE)
Based on the earlier discussion on neighbourhood
accessibility and focusing on the encompassing range of OPA factors
hypothesised to influence children's ALP, the objective characteristic of OPE
were categorised into (i) Built form : Built Area Density, Land-Use
Mix, Street Connectivity Villanueva et al. (2016),
(ii) Vehicular Network: Traffic
Exposure Giles
et al. (2011), Oliver et al. (2015); (iii) Pedestrian and Cycling Infrastructure:
Footpath availability and Utility of pedestrian and cycling infrastructure Carver
et al. (2008), Rosenberg et al. (2009), (iv) Recreation
Open Spaces: Usability of ROS: Proximity, Area, Numbers and Quality of
Neighbourhood ROS and number of neighbourhood ROS within 20 minutes of walking
distance from their home Frank
et al. (2012), Kaczynski et al. (2020), Rosenberg et al (2009). The perceptions
of the neighbourhood environment included in the study were (v) Children’s and
parents’ perceptions of neighbourhood traffic and personal safety Rosenberg et al. (2009),
children’s perceptions of Neighbourhood PA environment Davison & Lawson (2006);
and neighbourhood attractiveness Pikora
et al. (2003), Rosenberg et al. (2009).
2.5.3. Personal
Characteristics and Interpersonal Factors
Building on the
earlier discussion on the Adapted Ecological Model for Active Living for
children (Figure 1), and based on the previous literature, two
individual characteristics included in the study were, (i)
Gender: Trost et al. (1999) and (ii) A composite variable of Motivation
for PA: self-efficacy for PA Trost et al. (1999), social support for PA Högman et al (2020), and enjoyment of PA Saunders et al. (1997). The ecological model model
suggests children’s PA can also be influenced by interpersonal factors.
Parent’s perception of traffic safety, stranger danger or social environment in
the neighbourhood along with parenting norms determines parents’ attitudes and
willingness to allow IM to children Prezza
et al. (2001), Tyagi & Raheja (2020).
Considering the importance of IM for children’s AL, a licence for IM is
included in the study Babb.
(2014), Loon
& Frank (2011).
The operational
definitions, measures and scales, and tools of all the dependent and
independent variables included in the study are described in Table 1.
Table 1
|
Table 1 Dependant and Independent Variables |
||||
|
Dependent variables |
Measurement/Indicator (Formula/Scale) |
Source |
||
|
Childre’s Active living Pattern in a usual week.
(ALP) (Composite
variable: Subcomponents: OOPA, MTS, MTN and HAIHR) |
|
|||
|
1) Outdoor out-of-school PA in a usual week1
(OOPA) |
Sub-scale
(3 items) |
|||
|
(1)
Frequency of OOPA in a usual week; Response: ((Neve/ Rarely to 6-7days) |
(2)
Duration of OOPA in a usual week (i)Duration of OOPA on weekdays in a usual week (ii)
Duration of OOPA on weekends in a usual week; Response: (<=30 to upto >120) |
Parent’s survey |
|
|
|
2) Mode of travel to school2 (MTS) |
Sub-scale
(2 items) |
|||
|
(1)
Active mode of travel Response:
(Walking/ Cycling) |
(2)
Passive mode of travel Response:
(Driven by parents/ Pub Transport / Hired vehicular transport |
Parent’s survey |
||
|
3) Mode of travel to the neighbourhood2 (MTN) |
||||
|
4) Habitual Active independent home range in the
neighbourhood3 (HAIHR) |
Single
question: Name/ location of the place Response:
Simultaneous mapping of the places on the satellite image with the help of
the respondent using Google Earth Pro and Google Street View. |
Parent’s survey |
||
|
Independent variables |
Measurement/Indicator (Formula/Scale) |
Source |
|
|
|
Neighbourhood Outdoor Physical Environment (OPE)4 |
|
|||
|
Built Form |
|
|||
|
1) Built-up area density5 |
Built-up
area ratio (Gross floor area of all buildings / Total land area in
400 M. buffer) Unit: Area in SQM |
GIS |
|
|
|
2) Land use mi x 6 |
Entropy index: (Ratio calculated for six land uses
residential, commercial, mixed-use, institutional, recreation open spaces,
and other open spaces) |
GIS |
|
|
|
3)
Street connectivity7 |
Intersection
density7: Count of 3 or more legged intersections in 400 M. buffer Unit:
Count in numbers |
GIS |
|
|
|
Vehicular network |
|
|
||
|
4)
Traffic exposure8 |
The
ratio of high-speed roads: (Total length
of high-speed roads / Total length of low-speed roads in 400 M. buffer) |
GIS |
|
|
|
Pedestrian
and cycling infrastructure |
|
|||
|
5) Footpath availability9 |
The
ratio of roads with footpaths: (Total length
of roads with a footpath / Total length of all the rods in the 400 M. buffer) |
GIS |
||
|
6) Utility of pedestrian and cycling infrastructure10 |
Sub-scale:
(6 items) |
|||
|
(1)
Frequency of footpath use (2)
Barriers to use of footpath (3) Barriers to cycling |
Response:
4-point Likert scale (strongly
disagree=1 and strongly agree=4) |
Children’s survey |
||
|
Neighbourhood destinations |
||||
|
7)
Availability of RS within 20 min distance from home11 |
Sub-scale:
(8 items) |
|||
|
Perceived
walking proximity to a list of 8 number of recreational destinations in the neighbourhood |
Response:
(1 to 5 min walking distance=5; to > 30-min walking distance =1) Sum
recreation spaces within 20 Min Walk |
Parent’s survey |
||
|
Recreation open spaces (ROS) |
|
|
||
|
8)
Proximity to ROS12 |
Street network distance to nearest ROS from home (Unit: Dist.in Meters) |
GIS |
|
|
|
9)
Amount of ROS13 |
The
total area of ROS within 400 M buffer in SQM (Unit: Area in
SQM) |
GIS |
|
|
|
10)
Number of ROS14 |
Count
of ROS within 400 M buffer (Unit: Count in
numbers) |
GIS |
|
|
|
11)
Quality of ROS15 |
A
quality audit was conducted for 5 ROS features. Of all ROS within 400 M
buffer: (1) Access and surrounding (2) Play
facilities. (3) Amenities (4) Aesthetic features (5) Safety (Unit: Sum of
quality audit score of all the ROS in the 400 M buffer) |
Quality
audit |
||
|
Perception of
the neighbourhood environment. |
|
|||
|
12)
Children’s perception of Traffic safety16 |
Single
question Response:
4-point Likert scale (strongly
disagree=1 and strongly agree=4) |
Children’s survey |
|
|
|
13)
Children’s perception of safety17 |
||||
|
14)
Parent’s perception of Traffic safety18 |
Single
question Response:
4-point Likert scale (strongly
disagree=1 and strongly agree=4) |
Parent’s survey |
|
|
|
15)
Parent’s perception of personal
safety19
|
|
|||
|
16)
Perception of neighbourhood PA environment 20 |
Sub-scale
(4 items) |
|
||
|
(1)
Satisfaction with PA facilities (2)
Presence of PA culture and friendliness in the neighbourhood
|
Response:
4-point Likert scale (strongly
disagree=1 to strongly agree=4) |
Children’s survey |
||
|
17) Neighbourhood attractiveness21 |
Sub-scale
(3 items) |
|||
|
(i)Presence of dense mature trees in Nh (ii)
(ii)Cleanliness and order in Nh. (iii) (iii)Aesthetic appeal of Nh. |
Response:
4-point Likert scale: (strongly disagree=1 to strongly agree=4) |
Children’s survey |
||
|
Personal Characteristics, Interpersonal and
Other Factors |
||||
|
18)
Motivation for PA22 |
Sub-scale
(6 items) |
|||
|
(i) Self-efficacy for PA (ii) Social support for PA (iii)
Enjoyment of PA |
Response:
4-point Likert scale (strongly disagree=1 to strongly agree=4) |
Children’s survey |
||
|
|
Sub-scale
(2 items) |
|||
|
19)
License for IM 23 |
Paren’s
permission for (i) Walking/cycling in the neighbourhood (ii)
(ii) Crossing the main roads |
Response:
4-point Likert scale: (Never/ Rarely=0, Sometimes=1, Always=2) |
Parent’s survey |
|
|
Footnotes: 1 Outdoor out-of-school PA in a usual week (OOPA): Rosenberg et al. (2009), Telford et al. (2004) 2
Mode of travel to school (MTS), Mode of travel to the neighbourhood (MTN): Tetali et al. (2015) 3Habitual Active independent
home range in the neighbourhood
(HAIHR):
Huang et
al. (2009), Islam . (2008), Telford. (2004) 4 Characteristics
of the Outdoor Physical Environment
of the Neighbourhood (OPE): Davison et al. (2006), Ding et al (2011) 5Built-up area density is measured as the built-up area ratio. Forsyth. (2007), Islam . (2008), Nordbø. (2019)
6 Land-use mix is represented by the entropy index, which is the
most used and widely accepted index.
It is an evenness distribution of the proportion of the estimated
square footage/ floor space of different land uses within the buffers using
the following formula known as the Entropy index. Forsyth . (2007), Nordbø et al. (2019),
Tyagi & Raheja (2021) 7 Street connectivity: Intersection density is a measure of connectivity of
the street network. Forsyth. (2007), Nordbø et al. (2018) 8 Traffic exposure is measured as the ratio of high-speed road length
to low-speed road length. In the absence of traffic volume data, the traffic
function was used as a proxy and traffic speed exposure. (Forsyth, 2007; Nordbø et al., 2018) The data on the design speed of four urban roads
(arterial, sub-arterial, collector and local) were obtained from the Indian
Road Congress manual IRC:86-1983 The arterial and sub-arterial roads
formed the category of high-speed roads (>50 km/h ) and collector and
local rods formed the category of low-speed roads (<50km/h). Giles. (2005) 9Footpath availability: Forsyth. (2007), Nordbø et al. (2018) 10Utility of pedestrian and cycling
infrastructure: Adlakha et al. (2016), Cerin et al. (2019) 11Availability of RS within
20 min distance from home: Cerin et al. (2019), Rosenberg et al. (2009) 12Proximity to ROS: Davison & Lawson, (2006), Forsyth, (2007),
Koohsari et al. (2015), Nordbø et al. (2018) 13Amount of ROS8: Forsyth. (2007), Koohsari et al. (2015),
Nordbø et al. (2018) 14 No of ROS: Forsyth. (2007), Koohsari et
al. (2015), Nordbø et al. (2018)
15Quality of ROS: Forsyth. (2007), Kaczynski et al. (2020), Nordbø et al. (2018) 16 Children’s traffic safety: Rosenberg et al. (2009), Timperio. (2004) 17 Children’s personal safety: Ding et al. (2011), Timperio. (2004) 18 Parent’s traffic safety: Cerin et al. (2019), Rosenberg et al. (
2009) 19 Parent’s personal safety: Cerin et al., (2019), Rosenberg et al. (2009)
20 Presence of PA facilities and PA culture in the
neighbourhood: Holt et al. (2008)
21 Neighbourhood attractions: Adlakha et al. (2016), Cerin et al. (2019),
Rosenberg et al. (2009) 22 Child’s motivation for
outdoor PA: (Cerin et al. (2019), Rosenberg et al. (2009), Saunders et al. (1997) 23 License for independent mobility: Tetali
et al. (2016) |
||||
3. Methodology
3.1. Study settings
Nagpur, located
at the geographical centre of India was the place of this study. With a
population of 24.48 lakhs Chandramouli & General (2011), it is the regional main centre for
commerce, industries, services, health and education. In the last two decades,
there have been progressive changes in Nagpur's industrial, economic profile,
and real estate growth especially induced by the MIHAN project (Multi-Modal
International Cargo Hub and Airport at Nagpur) coupled with the significant
in-migration from the surrounding central region, transforming the city
physically, socially, and culturally. The rapidly changing urban landscape is
putting the city’s infrastructure under stress resulting in urban sprawl,
increased densities, higher crime rates, increase in traffic volume, and lack/
shortage of open spaces, leisure and amenities are affecting liveability for
children. Nagpur, a tier-II city is significant as a representative case of
transforming the urban living environment in India, hence a suitable context
for exploring the relationship between neighbourhood OPE characteristics and
children’s active living patterns.
Adopting a
comparative case study approach two neighbourhoods, namely Trimurti Nagar (TN) and Jaripatka (JP) were identified for sample
recruitment for this pilot study. Since
the primary constituent of the children’s ALP is their OOPA and routine AT to
the neighbourhood, the initial selection criteria to identify potential
neighbourhoods included three outdoor physical environments (OPE) factors
namely, intersection density, traffic exposure and area of ROS. These factors
are hypothesised to facilitate children’s outdoor PA and AT. The preliminary data for physical
characteristics was acquired either by direct observation or by using GIS
within tentatively delineated neighbourhood boundaries by consulting the neighbourhood
residents. This purposeful selection of neighbourhoods was helpful to maximise
the variability in OPE profile within the pilot study sample.
Table 2
|
Table 2 Physical Profile of Neighbourhoods |
||
|
Character |
Trimurti Nagar (TN) (N=25) |
Jaripatka (JP) (N=18) |
|
Location |
South –West |
North |
|
Age of locality |
40-30 years |
60-50 years |
|
OPE Characteristics (Tentative neighbourhood
boundary) |
Intersection density =273 |
Intersection density =230 |
|
Traffic exposure= 0.59 (Ratio) |
Traffic exposure= 0.18 (Ratio) |
|
|
Amount of recreation spaces= 43661 SQM |
Amount of recreation spaces= 27964 SQM |
|
|
Housing typology |
Plotted, low-rise upto
(G+3) |
Row housing, low-rise up to (G+3) |
|
Street pattern |
Irregular partially disconnected grid |
Regular connected grid |
|
Stage of development |
Developed |
Partial redevelopment |
|
Socio-economic character |
MIG-I-II, LIG: (Predominant Maharashtrian
community) |
MIG-I-II, LIG: (Mixed community including
North-Indians, Maharashtrian, Buddhist) |
3.2. Participants
A
sample of 43 children aged 8-12 years along with one parent participated in
this pilot study. The participants living in TN and JP neighbourhoods and
belonging to middle and lower-income households were recruited from parks and
residential areas through door-to-door visits. The precaution was taken to
recruit children from all parts of the neighbourhood to cover the whole spatial
range. Middle childhood years were considered for this investigation as during
this there is a developmental need for increased independence, outdoor
exploration, and social interactions and children greatly depend on
neighbourhood resources for PA during this age DelGiudice. (2018), Eccles. (1999), Moore & Theokas (2008). Several national and international studies have also
focused on the same age for investigating neighbourhood effects on children's
various health behaviour outcomes such as physical activities and active travel
Kyttä et al., (2012), Oliver et al. (2015)independent mobility Tyagi & Raheja (2020); travel to
school Tetali et al. (2016)daily activities and play provisions Bhonsle & Adane (2015). The data on the exact share of MIG and LIG households
in urban India is limited but based on the evidence from various sources like
govt. schemes PMAY. (2015), and thoughts expressed by
various field experts suggest Chhabra. (2023), Roy. (2018), Roy & Sowgat (2024) that MIG and
LIG households represent a substantial population in urban India. Focusing on
the PA needs of children from this segment is important, as interventions to
improve their ALP will potentially benefit the majority of the urban
population.
3.3. Data Collection
3.3.1. Subjective data
The cross-sectional data for this
pilot study was collected from the interviewer-administered survey for children
and their parents. Upon explaining the purpose and the process of the survey,
prior consent was secured from both parents and children. Survey interviews
were conducted in the language of choice and lasted for 20 min. The
questionnaire included 13 questions ( 7
for parents and 6 for the child) and 8 subscales (4 for parents and 4
for the child), adapted from internationally and nationally recognised scales.
(See footnotes of Table 1). The residential address provided by the parents was
re-checked using Google Earth and Google Street View Tetali et al. (2016) and confirmed by the parents or by direct observation.
3.3.2.
Objective data
A circular buffer of a 400-meter
radius was created around each child’s home location (n=43) to obtain the
objective data of OPE variables, which was similar to several international
studies and national studies of the same genre Kyttä et al.(2012), MoHUA & BvLF, (2019), Tyagi &
Raheja (2021)
GIS data extraction was a three-step process as follows: (Step-1): Base data
collection: The building footprint was generated from Google satellite imagery
using Mapflow AI (https://mapflow.ai/, n.d.), a machine learning algorithm
for automated feature extraction. OpenStreetMap, Google Street View and Google
Maps /Earth were used to create vector data for locating the participant’s home
and buffering, identifying the road categories, marking the footpath, land use
and recreation open spaces Forsyth, (2007), Lahoti et al. (2019), Nordbø et al. (2019),
Pindarwati & Wijayanto, 2023), (Step-2): Augmentation: To enhance and refine the base
data, Google Street View and Ground Truthing process (direct observation, photo
documentation) were used for attribute addition like building type, number of
stories, and quality audit of recreation open spaces; (Step-3): Analysis: Spatial analysis and map
creation were performed using QGIS (version 3.24) geographic information system
software (QGIS Development Team, 2021).
Intersection analysis was done to calculate road intersection density. Pivot
tables were used for summarising and aggregating the data. Data output tables
were created for further analysis.
3.4. Analysis
Statistical analysis was performed
using IBM SPSS Statistics version 26. The descriptive (Mean, SD, frequency and
percentage) and ANOVA analysis
(Independent sample t-test / Chi2 test as applicable) was performed for the
active pattern variable (ALP) and its component variables (OOPA, MATS, MATN and
HAIHR) along with perceived OPE characteristics, individual characteristics,
and other interpersonal factors for overall and by gender are also included in Table 3. Whereas, Table 4 contains
descriptive (Mean, SD, frequency and percentage) and ANOVA statistics
(Independent sample t-test / Chi2 test as applicable) for the active pattern
variable (ALP) and its component variables (OOPA, MATS, MATN and HAIHR) along
with objective and perceived OPE characteristics, personal characteristics, and
other interpersonal factors for overall and by neighbourhood. Bivariate
correlation analysis was used to investigate the association between children’s
ALP and its component variables (OOPA, MATS, MATN and HAIHR) and objective and perceived OPE
characteristics, personal characteristics and interpersonal factors as
explained in (Table 2) and (Table 5). Several
studies from Asia have employed a similar approach to examine built
environment's influence on children’s outdoor PA Bao et al. (2021), Islam, (2008), children’s independent mobility Tyagi & Raheja (2020), and time spent outdoors Islam et al. (2016). Other international studies have also employed similar
statistical strategies to examine the influence of OPE characteristics on
children’s various developmental outcomes like PA, AT and IM Bao et al. (2021), Oliver et al.(2016), Timperio et al., (2008).
Table 3
|
Table 3 Descriptive Information and Analysis of Variance by Gender for Subjective Measures |
|||||
|
Variable |
Overall
(N=43) Mean
(SD) Or Frequency
(%) |
Independent
sample t-test / Chi2 test |
|||
|
Girls
(N=17) Mean(SD) Or Frequency
(%) |
Boys
(N=26) Mean (SD) Or Frequency
(%) |
t (df) Or X2 (df) |
Cohen’s d Or Phi |
||
|
Dependant variables |
|||||
|
1. ALP in a usual week. |
7.44 (3.19) Active A |
5.65 (2.29) Underactive A |
8.62 (3.19) Active A |
t (41) =3.31 , p = 0.002 |
1.03 |
|
2. OOPA/day in a usual week in
minutes |
64.27 (42.21) |
36.47 (19.82) |
82.45 (43.27) |
t (37.57)=4.71 , p = <0.001 |
0.76 |
|
3. Mode of travel to school (MTS) |
Active: 14 (32.56 %) |
8 (47.06 % ) |
6(23.08 %) |
(ns) |
- |
|
Passive: 29 (67.44%) |
9 (52.94%) |
20
(76.92 %) |
|||
|
4. Mode of travel to the
neighbourhood (MTN) |
Active: 34 (79.07 %) |
13 (76.47%) |
21 (80.77%) |
(ns) |
- |
|
Passive: 9 (20.93 %) |
4 (23.53%) |
5 (19.23 %) |
|||
|
5. HAIHR (in meters) |
857.63
(603.88) ModerateB |
645 (482.88) Limited B |
996.65 (642.32) Moderate B |
t (40.09)=2.04 , p = 0.048 |
0.64 |
|
Independent variables: Percepveied OPE characteristics |
|||||
|
6. Children’s perception of Traffic safety |
2.49 (0.8) Fairly safeC |
2.41(0.87) Fairly safeC |
2.54(0.76) SafeC |
(ns) |
- |
|
7. Children’s perception of personal safety |
2.33 (0.94) Fairly safeC |
2.59(1.0) SafeC |
2.15 (0.88) Fairly safeC |
(ns) |
- |
|
8. Parent’s perception of Traffic safety of children |
2.37 (0.73) Fairly safeC |
2.35(0.75) Fairly safeC |
2.38 (0.74) Fairly safeC |
(ns) |
- |
|
9.
Parent’s perception of the personal safety of children |
2.37 (0.95) Fairly safeC |
2.06(0.97) Fairly safeC |
2.58 (0.9) SafeC |
(ns) |
- |
|
10. Perception of neighbourhood PA
environment |
6.17 (1.08) V.Supp. PA Envt.D |
5.62(1.02) Supp.
PA Envt.D |
6.52 (0.97) V.Supp PA Envt.D |
(ns) |
- |
|
11. Neighbourhood attractiveness |
7.84 (1.68) Attractive E |
7.76(1.6) Attractive E |
7.88 (1.75) Attractive E |
(ns) |
- |
|
Personal
Characteristics, and Interpersonal and
Other Factors |
|||||
|
7) Child’s motivation for outdoor PA |
8.75 (1.74) Good motivation F |
7.73(1.93) Good motivation F |
9.42 (1.23) High motivation F |
t (24.51)=3.22 , p = 0.004 |
1 |
|
8) Liscence for independent mobility |
Never G: 8 (18.6 %) |
4(9.3 %) |
4 (9.3 %) |
(ns) |
- |
|
Some timesG:5 (11.63 %) |
3 (6.98 %) |
2 (4.65 %) |
|||
|
AlwaysG: 30 (69.77 %) |
10 (23.266 %) |
20 (46.51 %) |
|||
|
9) Distance to school |
24903 (2958) |
1234(1457) |
3310 (3410) |
t (36.51)=2.75 , p=0.009 |
0.89 |
|
A
The Active Living Pattern categories were categorized
into quartiles based on the total possible score of 12. (Inactive: Up to 3.0;
Underactive: >3.0 to 6.0; Active: >6.0 to 9.0; Very Active: >9.0 to
12.0) B HAIHR categories based on the furthest distance generally allowed to
actively travel to a destination within the neighbourhood by the child
without an adult's company. (Restricted: 0-400 M; Limited: 401-800 M;
Moderate: 801-1200 M; Expansive: >1200 M) C Traffic and personal safety perception categories based on the total
possible score of 4 (Unsafe: 1.0 - 1.75; Fairly safe:
1.76 - 2.50; Safe: 2.51 - 3.25; Very Safe: 3.26 - 4.0) D Neighbourhood PA environment categories based on the total possible
score of 8 (Unsupportive PA environment: 0.0 - 2.0; Fairly
supportive PA environment: 2.01 - 4.0; Supportive PA environment: 4.01
- 6.; Very Supportive PA environment: 6.01 - 8.0) E Neighbourhood attractiveness is categories based on the total
possible score of 12 (Not attractive: 0.0 - 3.0; Fairly
attractive: 3.01 - 6.0; Attractive: 6.01 - 9.0; Very Attractive: 9.01
- 12.0) F Child’s motivation for outdoor PA categories based on the total
possible score of 12 (Poor motivation: 0.0 - 3.0; Fair motivation: 3.01 -
6.0; Good motivation: 6.01 - 9.0; High motivation: 9.01 - 12.0) G License for independent mobility was categorised
based on the total possible score of 2 (Never/ Rarely:0; Sometimes:1;
Always:2) H Utility of pedestrian and cycling infrastructure categories
based on the total possible score of 12 (Poor Utility: 0.0 - 3.0; Fair
Utility: 3.01 - 6.0; Moderately high Utility: 6.01 - 9.0; Excellent Utility:
9.01 - 12.0) |
|||||
4. RESULT AND DISCUSSION
4.1. Objective 1: Influence of Gender on ALP among Children in Nagpur
4.1.1. Gender and ALP (Ref. Table 3)
Out of 43 (aged 8-12 years) children participating in this pilot study, 26 (60%) were boys and 17 (40%) were girls. The exclusive participation of mothers in the survey was suggestive of their central position and prevailing cultural expectation of responsibility for children’s daily routines on mothers. The boys demonstrated significantly higher levels of ALP than the girls. (F:5.65(Underactive), M: 8.62 (Active)); The overall OOPA of children is just about 64.27 minutes per day in a usual week with boys accumulating significantly higher OOPA than girls. (F:36.47, M: 82.45); Many children use motorised MTS (67.44%) and an active MTN (79.07%). Though not significantly higher, more girls are engaging in active MTS. (F:47.06%, M: 23.08%) Page et al. (2010) Whereas more boys use active MTN than girls. (F:76.47%, M: 80.77%). The higher number of girls engaging in active MTS was probably because girls attend schools which are significantly closer distance than boys. (F:1234 M, M: 3310M); The significantly higher value of mean HAIHR for boys than the girls, (F:645 (Limited), M: 996.65 (Moderate) suggests that they can access a wider range of destinations within the neighbourhood such as parks, shops, or friend’s house etc. Where a girl’s limited range of HAIHR indicates that they can access some neighbourhood destinations but are still relatively confined.
4.1.2. Gender differences in perceived neighbourhood OPE characteristics (Ref. Table 3)
The children and their parents perceived that their neighbourhoods were only fairly safe from traffic and incivilities. Compared to girls, boys perceive that their neighbourhood was marginally safer from traffic. (F:2.41(fairly safe), M: 2.54(Safe)). But girls were less concerned about their safety in the neighbourhood than the boys. (F:2.59(Safe), M: 2.15 (Fairly safe). Compared to boys, parents of girls feel that their neighbourhoods have a lower level of personal safety. (F:2.06 (fairly safe), M: 2.58(Safe). Boys find their neighbourhood safer from traffic as compared to their parents. (Boys:2.5 (Safe), Parents: 2.38(Fairly Safe). Overall the differences in the perceived traffic and personal safety between boys and girls themselves Wen et al. (2009) and between their parents are not statistically significant.
4.1.3. Gender Differences in Motivation for PA and License for IM (Ref. Table 3, Table 4)
Overall and individually girls and boys find their neighbourhoods as very supportive of PA in terms of facilities and the presence of PA culture and friendliness in the community (Table 4). Both boys and girls find their neighbourhood attractive. Overall, all the children showed good motivation for pursuing outdoor PA with boys significantly more motivated than girls. (F:7.73(Good motivation), M: 9.42 (High motivation)) Overall 69.77% of children were always permitted IM as compared to 18.6% who were never permitted IM in the neighbourhood. A greater number of boys are permitted IM than girls. (F:23.26%, M: 46.51%).
It is evident from the above outcomes that boys are leading a more active lifestyle as compared to girls. Previous studies investigating children’s PA have also revealed gender differences of similar patterns. In this study, boys were accumulating more OOPA Page et al. (2010), J. F. Sallis et al. (1999), engaging in more active travel, and accessing a wider range of neighbourhood destinations without adult supervision Timperio. (2004), Villanueva et al. (2012). The 2022, India Report Card Bhawra et al. (2023), upon extensive evaluation of the relevant literature on PA patterns among Indian children and adolescents has revealed that compared to girls boys have higher levels of PA and AT. In the present study, boys have reported less concern about the traffic situation and greater freedom for IM than girls Page et al. (2010). Boys were found very satisfied with the physical activity facilities De Vries et al. (2007), overall greenery, and upkeep of their neighbourhood Molnar et al. (2004), and displayed high motivation levels for outdoor PA Brockman et al. (2011). All these factors appear to work in tandem to contribute to higher levels of recreation PA and AT for boys thus enhancing the ALP of boys. On the other side, though not substantially different than boys, the parents of girls are more concerned about traffic and personal safety Weir et al. (2006) and girls were permitted less IM in the neighbourhood as compared to boys. Interestingly both boys and girls rate the neighbourhood PA environment as supportive and the neighbourhood as attractive, still, girls are significantly less motivated to do outdoor PA. These observations regarding girls indicate their parents might be more cautious and prioritize safety over girls' autonomy for PA and IM Grow et al. (2008).
Given the preceding discussion on gender differences in ALP, and other factors that influence children’s ALP, it is important to examine the correlations between gender and various aspects of APL. Gender has moderate strength, positive and significant correlation with ALP (r pb=0.36, p= 0.019) and high strength, positive and significant correlation with OOPA (r pb= 0.54, p= <0.001). It also has a moderate strength, positive and marginal correlation with HAIHR (r pb= 0.39, p= 0.061). Despite the limited sample size of this pilot study, these consistent correlations demonstrate the importance of considering gender in policies and interventions to improve children's ALP.
Table 4
|
Table 4 Descriptive Information and Analysis of Variance by Neighbourhoods for Subjective and Objective Measures |
|||||
|
Variable |
Overall
(N=43) Mean (SD) / Frequency
(%) |
Independent
sample t-test / Chi2 test |
|||
|
TN (N=17) Mean(SD) / (%) |
JP
(N=26) Mean (SD) / (%) |
t (df) OR X2 (df) |
Cohen’s d / Phi |
||
|
Dependant variables |
|||||
|
1) Childre’s Active Living Pattern in a
usual week. |
7.44
(3.19) Active A |
6.56(3.0) Active A |
8.67 (3.12) Active A |
t (41) =-2.223 p = 0.031 |
0.69 |
|
2) Outdoor
out-of-school PA/day in a usual week in minutes (OOPA) |
64.27 (42.21) |
56.21 (33.16) |
75.46 (51.19) |
(ns) |
- |
|
3) Mode of
travel to school (MTS) |
Active: 14 (32.56 %) |
7 (28 % ) |
7 (38.89 %) |
(ns) |
- |
|
Passive: 29 (67.44%) |
18 (72%) |
11
(61.11 %) |
|||
|
4) Mode of
travel to the neighbourhood (MTN) |
Active: 34 (79.07 %) |
18 (72 %) |
16 (88.89%) |
(ns) |
- |
|
Passive: 9 (20.93 %) |
7 (28%) |
2 (11.11 %) |
|||
|
5) Habitual
Active independent home range in the
neighbourhood (HAIHR) |
857.63
(603.88) Moderate B |
733.28
(578.99) (Limited B |
1030.33.65 (611.05) Expansive B |
(ns) |
- |
|
Independent variables: OPE characteristics |
|||||
|
1) Built-up area density |
0.84 (0.14) |
08(0.07) |
0.89(0.0.19) |
t (20.62)=-1.9, p=0.072 |
0.59 |
|
2) Land use mix |
0.42 (0.08) |
0.41(0.09) |
0.43(0.0.6) |
(ns) |
- |
|
3) Street connectivity |
275 (60) |
284(73) |
263(34) |
(ns) |
- |
|
4) Traffic Exposure |
0.12 (0.07) |
0.16(0.0.05) |
0.06(0.05) |
t(41)=6.2 p=<0.001 |
1.92 |
|
5) Footpath availability |
0.36 (0.08) |
0.41(0.05) |
0.3(0.06) |
t(41)=6.76 p=<0.001 |
2.1 |
|
6) Utility of pedestrian and cycling infrastructure |
6.87 (1.3) Good UtilityH |
6.77(0.77) Good UtilityH |
7.02(1.81) Good UtilityH |
(ns) |
- |
|
7) Availability of RS within 20 min distance from home |
3.81 (0.76) |
3.44
(0.51 ) |
4.33 (0.77) |
t(27.44)=- 4.6 , p=0.001 |
0.89 |
|
8) Proximity to ROS8 (in m) |
239.07 (101.89) |
231.92(86.24) |
250.28(122.15) |
(ns) |
- |
|
9) Amount of ROS9 (in
m2) |
28807.98 (14451.47) |
33449.04 (10797.11) |
22362.06 (16604.82) |
t (27.14) =-2.48 , p=0.02 |
0.82 |
|
10) Number of ROS10 |
4.98 (2.11) |
5.44(2.04) |
4.33(2.09) |
t (41) =1.74 , p=0.09) |
0.54 |
|
11) Quality of ROS |
221.68 (95.79) |
267.17(75.15) |
158.57(86.28) |
t (41) =4.39 , p=<0.001 |
1.36 |
|
Independent variables: Percepveied OPE characteristics |
|||||
|
12)
Children’s perception of Traffic safety |
2.49 (0.8) Fairly safeC |
2.52 (0.82) SafeC |
2.44(0.78) SafeC |
(ns) |
- |
|
13)
Children’s perception of personal safety |
2.33 (0.94) Fairly safeC |
2.52 (0.92) SafeC |
2.06 (0.94) Fairly safeC |
(ns) |
- |
|
14) Parent’s
perception of Traffic safety of children |
2.37 (0.73) Fairly safeC |
2.26 (0.61) Fairly safeC |
2.53 (0.87) SafeC |
(ns) |
- |
|
15) Parent’s perception of the personal safety of
children |
2.37 (0.95) Fairly safeC |
2.2 (0.91) Fairly safeC |
2.61 (0.98) SafeC |
(ns) |
- |
|
16) Presence of PA facilities and PA
culture in the neighbourhood |
6.17 (1.08) Suppo. PA Envt.D |
6.41(0.94) Suppo. PA EnvtD. |
5.83 (1.18) Fairly suppo.PAD envt. |
(ns) |
- |
|
17) Neighbourhood attraction |
7.84 (1.68) AttractiveE |
8.76(1.33) AttractiveE |
6.56 (1.2) Attractive E |
t (38.88) =5.68 , p=<0.001 |
1.75 |
|
Personal Characteristics,
and Other Interpersonal Factors |
|||||
|
18) Child’s motivation for outdoor PA |
8.75 (1.74) Good motivationF |
9.09 (1.9) High motivationF |
8.28 (1.41) Good motivationF |
(ns) |
- |
|
19) Liscence for independent mobility |
NeverG :8 (18.6 %) |
NeverG: 7 (28 %) |
NeverG1 (5.56%) |
(ns) |
- |
|
SometimesG: 5(11.63 %) |
SometimesG: 2(8 %) |
SometimesG3:(16.67 %) |
|||
|
AlwaysG: 30(69.8 %) |
High IM: 16(64 %) |
14 (77.78 %) |
|||
|
20) Distance to school |
24903 (2958) |
1990(1994) |
3383 (3889) |
(ns) |
- |
|
Notes: (i) n.s.
indicates non-significant correlations (p>0.05) (ii) A, B, C, D, E, F, G, H: Refer to footnotes of Table 3 |
|||||
4.2.
Objective 2: Relationship between the ALP and neighbourhood
OPE
4.2.1. OPE characteristics across the Neighbourhood (Ref. Table 4)
To explore the
strength and direction of the relationship of children's ALP and its
sub-components with neighbourhood PE characteristics (both subjective and
objective measures) spearmen ranked-order correlation analysis was performed
for the entire sample (N=43). Once again, a hierarchical cluster analysis was
performed using the comprehensive detailed data (GIS) acquired for five OPE
characters within a 400-meter buffer around each child’s home. (N-43). The
dendrogram was created based on the z scores of means, median and SD of built
density, land-use mix, intersection density, traffic exposure, and area and
quality of recreation spaces, demon. The OPE profile of the two neighbourhoods
has been comprehensively interpreted with the help of a cluster dendrogram
which demonstrated TN and JP as two distinct Neighbourhoods, descriptive
statistics (Table 4), and observed characteristics of the
neighbourhood (Table 2) which was essential to interpret the
statistical analysis results. The profile of the two neighbourhoods is briefly
described here.
Jaripatka (JP) is the oldest (60-50 years old)
neighbourhood with a higher density (0.89) and land-use mix (0.49) than TN. It
has marginally lower street connectivity (263 intersections/km2)
than TN. Traffic exposure (0.06), amount
of ROS (22362 m2/km2) and quality ROS (158.57) is much lower
than TN. JP neighbourhood is also undergoing partial redevelopment, which
implies a transition in its built form towards mixed land use. Whereas TN
(40-30 years old), with its marginally lower built-up area density (0.8) and
land-use mix (0.41) than JP, has higher street connectivity (284 intersections
/ km2) and more traffic exposure (0.16) than JP. TN has an ample
amount of ROS (33,449 m2/km2) of high-quality facilities
and amenities. (262.12). TN has a well-established infrastructure, reflecting
its developed stage.
4.2.2. Childre’s Active Living Pattern in a Usual Week (Ref. Table 4, Table 5, Table 3)
A greater share
of children lived in Trimurti Nagar (TN) (58%) compared to Jaripatka
(JP) (42%). Overall children are demonstrating (Mean: 7.44, SD: 3.19) an
‘Active1’ PA pattern with a moderate degree of variability. Children
in the JP neighbourhood have higher levels of ALP compared to TN (TN:6.56
(Active), JP: 8.67 (Active)) and this difference is statistically significant
with a moderate to large effect size. This outcome can be related to the trends
of higher levels of AT to school (TN:28%, JP: 38.89%) and neighbourhood
(TN:72%, JP: 88.89%) and expansive HAIHR (TN:733.28 M. (Limited HAIHR), JP:
1030.33M. (Expansive HR)) demonstrated by children from JP neighbourhood. This
suggests that the OPE of JP is more conducive to children’s AL than TN. We
provide further insights and discuss potential explanations for this observed
pattern of this relationship.
Table 5
|
Table 5 Association Between Active Living Pattern and Neighbourhood OPE Characteristics |
|||||
|
Childre’s Active Living Pattern in a usual week. |
(OOPA) |
Mode of travel to school |
Mode of travel to neighbourhood |
HAIHR |
|
|
OPE
characteristics |
Spearman's
Rank-Order Correlations (r, p-value) |
||||
|
OPE characteristics |
(Spearman) |
|
|
|
|
|
1) Built-up-area-density |
r= 0.39, p=0.011 |
r=0.32,p=0.034 |
ns |
ns |
ns |
|
2) Land-use-mix |
ns |
ns |
ns |
ns |
ns |
|
3) Street connectivity |
ns |
ns |
ns |
ns |
ns |
|
4) Traffic Exposure |
r= 0.29,p=0.095+ |
ns |
ns |
ns |
r=-0.31,p=0.044 |
|
5) Footpath availability |
ns |
ns |
ns |
ns |
ns |
|
6) Utility of pedestrian and cycling infrastructure |
r= 0.25, p=0.1+ |
ns |
ns |
ns |
r=0.26, p=0.094+ |
|
7) Availability of RS within 20 min distance from home |
ns |
ns |
r=0.31, p=0.045 |
ns |
ns |
|
8) Proximity to ROS8 |
ns |
ns |
ns |
r=-0.38, p=0.012 |
ns |
|
9) Amount of ROS9 |
r=-0.26, p=0.089+ |
ns |
r=-0.27, p=0.077+ |
r=-0.3, p=0.055+ |
ns |
|
10) Number of ROS10 |
ns |
ns |
ns |
ns |
ns |
|
11) Quality of ROS11 |
ns |
ns |
ns |
ns |
ns |
|
Percepveied
OPE charecteristics |
Spearman's
Rank-Order Correlations (r, p-value) |
||||
|
|
Spearman |
|
|
|
|
|
12) Children’s perception of Traffic safety |
r =-0.26 , p=0.086+ |
ns |
ns |
ns |
r =-0.49 ,p=0.001 |
|
13) Children’s perception
of personal safety |
r =-0.47,p=0.002 |
ns |
ns |
r =-0.42,p=0.005 |
r =-0.58, p=<0.001 |
|
14) Parent’s
perception of Traffic safety of cuhildren |
ns |
ns |
ns |
ns |
r =0.25 , p=0.1+ |
|
15) Parent’s perception
of personal safety of children |
r =0.38 , p=0.012 |
ns |
ns |
r =0.38 ,p=0.013 |
r =0.48 ,p=0.001 |
|
16Neighbourhood PA environment |
r =0.31,p=0.041 |
r =0.5, p=0.001 |
ns |
ns |
ns |
|
17) Neighbourhood attractivness |
ns |
ns |
ns |
ns |
ns |
|
Personal characteristics and other factors |
Spearman's Rank-Order Correlations (r, p-value) |
||||
|
18) Child’s motivation for outdoor PA |
ns |
r=0.6, p=<0.001 |
ns |
ns |
ns |
|
19) Liscence for independent mobility |
r =0.59, p=<0.001 |
r=0.35, p= 0.021 |
r=0.45, p= 0.002 |
r=0.76,p= <0.001 |
r=0.56,p= <0.001 |
|
20)Distance to school |
ns |
ns |
r =- 0.67, p=<0.001 |
ns |
ns |
|
|
Point-biserial Correlation (rpb,p-value) |
||||
|
21) Gender |
r pb= 0.36 , p= 0.019 |
rpb=0.54, p= <0.001 |
|
|
rpb=0.29, p= 0.061+ |
|
Notes:
(i) n.s. indicates non-significant correlations (p>0.05), (ii) Values within the 0.05 to 0.10 range are
considered as marginally significant and denoted as (+) |
|||||
4.2.3. Built form and ALP (Ref. Table 4, Table 5, Table 3)
Referring to the
physical profiles of the neighbourhood discussed earlier, JP has a relatively
more compact built form than TN. The built density showed a moderate but
significant correlation with the overall ALP (r = 0.32, p= 0.038) and OOPA. (r
= 0.32, p = 0.034). Though a smaller number of respondent children reside in JP
(41.86%) compared to TN (58.14%), the combined effect of higher built density,
land-use mix, and moderate street connectivity of the JP offers more walkable
recreational and utilitarian destinations (more alternate routes to multiple
destinations) Braza et al. (2004), Frank et al. (2007), a higher concentration of people, children,
dwellings, and shops translating into a higher hustle and bustle of daily
activities like pedestrian traffic and social activities on the streets and
more eyes on the streets. This can be linked to the parents from JP finding
their neighbourhood safe for the personal safety of their children. Previous
studies have also suggested that neighbourhood safety and social aspects are
important factors that parents consider while permitting their children outdoor
play and IM Veitch et al. (2006), Weir et al. (2006). The specific influence of land-use mix, and
street connectivity could not be detected on ALP or its sub-components probably
because variation in these factors across the neighbourhoods was not
significant or the limitations of the pilot sample.
4.2.4. Traffic Exposure and ALP (Ref. Table 4, Table 5, Table 3)
The transport
situation can influence children’s ALP primarily in two interlinked ways, their
exposure to traffic and their choice of mode of travel to routine destinations
in the neighbourhood Abdollahi et al. (2023). Apart from street connectivity the speed and volume directly affect
children’s AT and IM and indirectly influence their overall activity pattern Babb et al. (2011). The average traffic exposure level within
400-meter butter was low (Mean:0.12, SD:0.07), with TN children having a higher
ratio of highspeed roads (TN-0.16, JP-0.06) and this difference was
statistically significant. Traffic exposure showed a weak negative yet
significant correlation with children’s HAIHR (r = -0.31, p = 0.044) and a weak
negative and marginally significant correlation with children’s APL (r = -0.29,
p = 0.095+). These two correlations can be interpreted as emerging trends which
suggest that traffic exposure may restrict children’s HAIHR and potentially
limit their PA levels. Previous studies have associated traffic exposure with
children’s PA De Vries et al. (2007) and AT Grow et al. (2008).
4.2.5. Pedestrian
infrastructure (Ref. Table 4, Table 5, Table 3)
The ANOVA analysis
reveals that footpath availability is generally low in both neighbourhoods
(Mean: 0.36, SD (0.08) but it is significantly higher in TN compared to JP.
(TN:0.41, JP: 0.3) and this difference was statistically significant. No
significant correlation was found between footpath availability and ALP or its
sub-components. Despite the significant difference in the availability of the
footpaths, children from both TN and JP find pedestrian infrastructure
moderately useful, meaning design features, upkeep of footpaths, and
convenience of cycling might be similar in both neighbourhoods. However, there
was a weak positive and marginally significant correlation between the utility
of pedestrian infrastructure, children’s ALP (r = 0.25, p =0.1), and
HAIHR. ALP (r = 0.26, p =0.94). These
associations suggest that well-designed and usable pedestrian infrastructure
might increase willingness to venture out and explore their surroundings and
provide more opportunities and incentives for active travel and play. Previous
studies have also associated the use of the pedestrian infrastructure with the
active use of recreation sites and AT to recreation sites De Vries et al. (2007), Ding et al. (2011), Grow et al. (
2008). These emerging trends warrant further
investigation with more variability and a larger sample.
4.2.6. Recreation open spaces (ROS) (Ref. Table 4, Table 5, Table 3)
Playgrounds, parks,
and sports courts serve as physiographic settings and their physical
characteristics may hinder or facilitate PA.
There was a significant difference in the objectively measured variables
of ROS like the Amount of ROS; Number of ROS; and Quality of ROS across the two
neighbourhoods. TN scores higher for all the above aspects of ROS. Whereas JP
children have more availability of ROS within 20 min distance from home (TN:
3.44 (0.51), JP: 4.33 (0.77) than TN and this difference is significant. As
hypothesized, the proximity of ROS has a negative and significant correlation
with an active MTN. (r = -0.38, p =0.012). The amount of ROS was consistently
but negatively correlated with ALP (r = -0.26, p =0.089+). and MTN (r = -0.32, p =0.033). (Table 5). The consistent negative direction of these
correlations is counterintuitive as the substantial literature evidence
suggests that the of availability, amount, variety and quality of ROS promotes
non-school PA Frank et al. (2012), Kaczynski et al. (2016). It
draws our attention to India-specific pervasive issues like the deficit in
infrastructure provision and maintenance.
The mandatory statutory requirements like the area of ROS, often get
partially fulfilled but the provision of age-appropriate play facilities,
amenities, physical and personal safety features, general aesthetics, and
upkeep of ROS, are crucial factors in stimulating children’s interest and
attracting them to visit ROS regularly, does not meet the required standards Loon & Frank. (2011). Contrary to the expectations, despite the lesser amount and lower quality
of ROS the children from JP had demonstrated consistently higher scores for ALP
and its sub-components. (Table 4). This suggests that the walkability features
like built density, land-use mix Ding et al. (2011), and having more parks within 20 min walking distance from home Timperio et al. (2008) were more influential in enhancing ALP in this
study.
4.2.7. Perception of Neighbourhood Safety and ALP (Ref. Table 4, Table 5, Table 3)
There was no
significant difference demonstrated in traffic and personal safety perceptions
of either children or their parents across TN and JP. (Table 4).
However, children from TN are more confident in traffic and personal
safety (“Safe”’ 3 on the scale) as compared to their parents (“Fairly Safe”’ 2
on the scale). On the other side children from JP are less assured of personal
safety (“Fairly Safe”’ 2 on the scale) as compared to their parents (“Safe”’ 3
on the scale). The disagreement between children and their parents’ perceptions
of neighbourhood safety has been observed in previous studies also. (Timperio,
2004) Children’s perception of traffic safety had a low strength, negative, and
marginally significant correlation with ALP (r =-0.26, p =0.086) and a moderate
strength, negative, and significant correlation with HAIHR (r = -0.49, p
=0.001). Whereas children’s perception of personal safety had moderate
strength, negative and significant correlation with ALP (r = -0.47, p =0.002),
moderate strength, negative and significant correlation with MTN (r = -0.42, p
=0.005), and high strength, negative and significant correlation with HAIHR (r
=-0.58, p =<0.001). It is evident from these consistent negative
correlations that children’s favorable views of
neighbourhood safety could not translate into positive correlations with ALP or
its subcomponents. However, many previous studies have positively associated
children’s perceptions of traffic and personal safety with their overall PA and
walking or cycling with recreation sites or other destinations Grow et al. (2008), Taylor et al. (2018), and home range Spilsbury et al. (2009). Parents' perceptions of traffic safety did
not significantly correlate with ALP or its subcomponents (Table 5). TN
has a higher proportion of high-speed roads and JP has mixed and commercial
land use ingress into its residential areas. In both situations, there is an
increased traffic movement in the residential areas. Thus, the parental concern
over neighbourhood traffic in JP and TN is obvious and ubiquitous Weir et al. (2006).
Parents residing in
JP perceived their neighbourhood as safer for traffic.(TN: 2.26 (Fairly safe),
JP: 2.53 (Safe) and personal safety than TN. (TN: 2.2 (Fairly safe), JP: 2.61
(Safe)) This observation can be linked to the physical features specific to JP
such as a relatively compact built form with integrated mixed and commercial
land-use, mixed community vibrant social-cultural character, and lively
streets. These features induce a sense of safety and surveillance, often called
“Eyes on the streets” Kanigel. (2016), fostering parental confidence and comfort in
allowing their children greater freedom for outdoor play and active independent
travel. This observation was further underscored as children from JP were
engaging in higher levels of outdoor PA (TN: 56.21, JP: 75.46) and a greater
number of children were opting for AT in the neighbourhood. than TN. (TN: 72%,
JP: 88.89%). Parent’s perception of
personal safety had moderate strength, positive and significant correlations
with ALP (r = 0.38, p =0.012), (Molnar et
al., 2004) MTN (r = 0.38, p =0.013) Timperio. (2004), and HAIHR (r = 0.48, p =0.001). From these
results, it is clear that parental perception of their
children’s personal safety in the neighbourhood has a stronger influence on
their children’s AT and IM than their children’s perceptions of neighbourhood
safety. This finding is in line with another Indian study Tyagi & Raheja (2021), and several studies from other countries
Timperio.
(2004), Weir et al. (2006),
suggesting that parents tend to be the main decision-makers in their
children’s PA behaviors Panter et al. (2008).
4.2.8. Neighbourhood Physical Activity Environment and Attractiveness (Ref. Table 4, Table 5, Table 3)
Children’s perceptions of the neighbourhood PA environment did not
significantly differ across the neighbourhoods demonstrating the higher mean
score for TN (TN: 6.41, JP: 5.83). The neighbourhood PA environment had a
positive and significant correlation of moderate strength, with ALP (r =0.31, p
=0.041). and of high strength amongst the subcomponents, only with OOPA (r
=0.5, p =0.001). These results are in
line with the findings from previous studies, suggesting the availability and
quality of neighbourhood recreation facilities Hayball et al., (2018), Wong et al. (2010), and modeling
of PA culture by adults, other children, and friendliness Villanueva et al. (2012), among the neighbourhood community positively
influences children’s activity levels.
Children from TN
perceive their neighbourhood as more attractive in terms of the greenery,
cleanliness and aesthetically appealing buildings compared to children from JP
(TN: 8.76, JP:6.56). But despite the
significant variation across the neighbourhoods, all the correlations of
neighbourhood attractiveness with ALP or its subcomponents were statistically
non-significant. These results indicate that attractive neighbourhoods which
are important for adults didn’t seem to influence children’s activity levels in
this study. This might be due to the growing children’s limited abilities to
comprehend surroundings at a larger scale. Probably children are easily drawn
to immediate gratification like enjoyment and instantaneous apprehension like
safety concerns. Neighbourhood attractiveness may be important for overall
well-being but may not be the primary driver of PA during middle childhood.
4.2.9. Motivation for Outdoor PA and ALP (Ref. Table 4, Table 5, Table 3)
Both TN and JP
children demonstrate a good level of motivation for outdoor PA (TN: 9.09,
JP:8.28) with insignificant differences. It indicates general enthusiasm
towards outdoor PA activities among the children participating in the study. On
the expected lines it has shown a strong positive correlation with OOPA. (r=0.6,
p=<0.001). The desire to be physically active is a biological and
psychological need during the middle childhood years of development Schonert-Reichl. (2011). It is an innate drive that propels children
to outdoor exploration and physical and social play despite an ideal
environment. Therefore, intervention aimed at fostering and nurturing intrinsic
motivation, rather than only focusing on PE factors could be a more effective
strategy for promoting an AL among children.
4.2.10. License for Independent Mobility and ALP (Ref. Table 4, Table 5, Table 3)
In this study, the
overall sample has the license for a high degree of independent mobility
(69.8%). JP has a higher proportion of children having high IM (TN: 64%,
JP:77.78 %). It is interesting to note
that though TN has a well-developed infrastructure, it has a large proportion
of children who have no IM. (28%) compared to just 5.56% of children from JP
having no IM. The correlations analysis demonstrates a strong positive
correlation between the license for IM and ALP (r =0.65, p=<0.001) and
several moderate to high correlations with the subcomponents of ALP (Table 5). There were moderate to high strength
significant correlations with active MTS (r =0.45, p= 0.002) and MTN (r =0.76,
p= <0.001). This means that if children had permission to walk and cycle
independently without adult company, they were more likely to choose active
mode over passive mode to travel to school and the neighbourhood. A strong
positive correlation is found with HAIHR (r =0.56, p= <0.001), indicating
parents’ permission for IM largely gets translated into children habitually
walking and cycling to further distance from home to recreation spaces and
other neighbourhood destinations acquiring longer HAIHR. Children from JP
having significantly longer HAIHR than TN children (JP: 1030.33, TN: 733.28)
may be linked to their higher levels of IM. Taken together these findings
underscore the importance of facilitating children’s IM to promote their
engagement in active travel affording children’s greater access to recreational
PA as they can confidently navigate to parks and playgrounds on their own. Many
previous studies had outcomes along similar lines Veitch et al. (2014) have found that AT mode and IM increase the
frequency of children’s park visits Schoeppe et al. (2013) in their review of 52 studies focusing on the
association of children’s IM, and AT with PA, have concluded that children who
have the freedom to travel actively without adult supervision often play
outdoors and accumulate more physical activity than those who do not Page et al. (2010) in their study have emphasized that IM to
local destinations is a consistent correlation for outdoor PA, structured
sports, and active commuting.
4.2.11. Distance to school and ALP (Ref. Table 4, Table 5, Table 3)
For the overall
sample, the average distance to school was 2.5 Km. (SD 2.95 Km) This indicates
a wide range of distances within the sample which is similar
to other Indian studies conducted in Hyderabad (Avg. distance to school:
2.0 Km, SD: 2.6 Km). TN children have their schools much closer than JP (TN:
1990 M, JP: 3183M). However, this difference is not statistically significant.
Overall, only 32.56% of children are found to actively commute to schools in
this study. This finding is similar to a previous study from Kolkatta, India which has reported that only 35% of
children use active MTS Tyagi & Raheja. (2020). Despite the longer mean distance to school, a
greater number of children from JP (39%) were actively commuting to school as
compared to TN (28%). This trend can be partially attributed to JP’s compactly
built form and its advantages like more eyes on the street, and lively streets
creating a sense of neighbourhood safety among residents.
As expected,
distance to school has a strong negative correlation with active travel mode to
school (r = -0.67, p=<0.001). This finding is similar to the previous
literature suggesting that children were more likely to actively commute to
school if their routes were about 750 to
800 meters Tetali et al. (2016), Timperio et al. (2006). The
lack of a significant correlation between distance to school and overall, ALP
may be attributed to some local factors and practices. It is a common practice for children in
Nagpur to attend schools outside their neighbourhood localities and engage
passive modes of transport for commuting. Many children attend after-school
extra tuition classes. These overscheduled patterns of children’s daily
routines consume time, and energy, leaving no room for outdoor PA but
increasing their reliance on passive travel modes, and fostering a sedentary
lifestyle, majorly compromising their willingness to develop independent active
travel skills or engage in spontaneous physical activities.
5. CONCLUSION
This study is one of
the few to specifically focus on exploring the relationship between
neighbourhood environment and children’s ALP in urban India, particularly
focusing on the middle and low-income class, which constitute a substantial
majority of India’s urban populace. This study has demonstrated the adaptation
and application of the ecological model of active living to the Indian urban
context and provided a comprehensive framework for understanding the complex
neighbourhood PE, and personal and intrapersonal factors influencing routine
children’s activity patterns, especially in the data-limited context of India.
This study has included both objective and subjective measures to get a
comprehensive understanding of the complex spatial, socio-economic and cultural
profile of the Indian urban neighbourhoods.
Additionally, by providing empirical evidence on children’s active
living patterns in urban India, it adds to the growing body of ‘Active Living
Research’ from the Global South. Considering the lack of previous research of a
similar kind, the research was framed as an exploratory pilot study with a
limited sample. Recalling the results, built density, traffic exposure, utility
of pedestrian infrastructure, proximity and amount of ROS have shown significant
influence on children’s ALP and its subcomponents. The findings of the study
also revealed disagreement between children and their parents about perceptions
of neighbourhood safety. Parents’ heightened neighbourhood safety concerns
override children’s own perceptions, as evidenced by several positive
correlations between parental restrictions, specifically limiting children’s
license for IM and ALP and its subcomponents. Children’s motivation has also
emerged as a very influential factor for children’s outdoor out-of-school PA.
In India, where
gender disparities persist in various spheres of life, it is not surprising
that these differences extend to children's ALP, as evidenced by the higher
levels of OOPA observed in boys compared to girls in this study. Despite better
development and amenities, TN children could not exhibit higher levels of
active living compared to children from the JP neighbourhood. This observation
highlights the importance of the role of the cultural environment, as the JP
neighbourhood’s vibrant mixed community culture and compact built form,
characterized by higher building density and diverse land use, appear to foster
a more active lifestyle despite relative infrastructural limitations. These
findings indicate at the influence of cultural norms and societal structures on
children's behaviours and preferences, emphasising the necessity of a holistic
approach. Considering, India’s fast-transforming urban environments, vast
socio-cultural diversity burgeoning child population, and the overarching
challenge of economic constraints,
understanding and leveraging the specific cultural advantages inherent
in Indian society may be an important component of a holistic approach in
designing effective interventions and policies to promote ALP among Indian
children This approach should
prioritise the development of infrastructure that supports children’s
out-of-school physical activities like active play, organised sports, and
active travel, while also addressing the gender disparities and parental safety
concerns and leveraging upon promotive factors like to motivation to create a
supportive ecosystem to support children’s active living. This paper presents a case of an initial
foray into the field of neighbourhood PE effects on children’s PA patterns.
This study conducted in Nagpur, a case of fast transforming and expanding
typical tier-II cities of India, demonstrates high relevance and potential for
transformative impact.
6. LIMITATIONS AND FUTURE DIRECTION
This pilot study's cross-sectional nature and limited sample size limits the analysis to establish causal relationships. The key strengths of this study were its holistic conceptual framework, and rigorous methods employed for the comprehensive data collection incorporating objective and subjective measures of OPE and other variables, adopted and modified from international scales and GIS protocols, keeping in view the contextual challenges of demographic, land-use and digital data deficiency. The findings of this study provide preliminary evidence for several pathways through which OPE of neighbourhoods may influence children’s active living patterns. Future studies can replicate and expand upon the comprehensive research structure of this pilot study. This research can potentially inform area-based planning and design strategies to improve children's active living.
CONFLICT OF INTERESTS
None.
ACKNOWLEDGMENTS
None.
REFERENCES
AMRUT. (n.d.). Atal Mission for Rejuvenation and Urban Transformation -AMRUT: Ministry of Housing and Urban Affairs, Government of India. Retrieved From 2024, July 29.
Aarthi, G. R., Begum, T. S. M., Al Moosawi, S., Kusuma, D., Ranjani, H., Paradeepa, R., Padma, V., Mohan, V., Anjana, R. M., & Fecht, D. (2023). Associations of the Built Environment with Type 2 Diabetes in Asia: A Systematic Review. BMJ Open, 13(4). https://doi.org/10.1136/bmjopen-2022-065431
Abdollahi, S., Waygood, E. O. D., Aliyas, Z., & Cloutier, M.-S. (2023). An Overview of How the Built Environment Relates to Children's Health. Current Environmental Health Reports, 10(3), 264-277. https://doi.org/10.1007/s40572-023-00405-8
Active Healthy Kids India. (2022). India Report Card on Physical Activity for Children and Adolescents.
Adlakha,
D., Hipp, J., & Brownson, R. (2016). Adaptation and Evaluation of
the Neighborhood Environment Walkability Scale in India (NEWS-India).
International Journal of Environmental Research and Public Health, 13(4), 401. https://doi.org/10.3390/ijerph13040401
Agarwal, M. K., Sehgal, V., & Ogra, A. (2021). A Critical Review of Standards to Examine the Parameters of Child-Friendly Environment (CFE) in Parks and Open Space of Planned Neighbourhoods: A Case of Lucknow City, India. Social Sciences, 10(6), 199. https://doi.org/10.3390/socsci10060199
Arup. (2017). Cities
Alive: Designing for Urban Childhoods. Arup.
Babb, C. W. (2014). Built Environment Auditing, Active Mobility and Children's Wellbeing [PhD Thesis, Curtin University].
Babb, C., Burke, M., & Paul, T. (2011). Developing Neighbourhood 'Walkability' Indices for Children's Active Transport.
Bao, Y., Gao, M., Luo, D., & Zhou, X. (2021). Effects of Children's Outdoor Physical Activity in the Urban Neighborhood Activity Space Environment. Frontiers in Public Health, 9. https://doi.org/10.3389/fpubh.2021.631492
Bhawra, J., Khadilkar, A., Krishnaveni, G. V., Kumaran, K., &
Katapally, T. R. (2023). The 2022 India Report Card on Physical Activity
for Children and Adolescents. Journal of Exercise Science & Fitness, 21(1),
74-82. https://doi.org/10.1016/j.jesf.2022.10.013
Bhonsle, K. D., & Adane, V. S. (2015). Status of Children's Outdoor Play in Urban Settings-Case Study-Nagpur [Maharashtra, India]. American Journal of Civil Engineering and Architecture, 3(6), 200-207. https://doi.org/10.3390/buildings6030031
Biddle, S. J., Gorely, T., & Stensel, D. J. (2004).
Health-Enhancing Physical Activity and Sedentary Behaviour in Children and
Adolescents. Journal of Sports Sciences, 22(8), 679-701. https://doi.org/10.1080/02640410410001712412
Braza, M., Shoemaker, W., & Seeley, A. (2004). Neighborhood
Design and Rates of Walking and Biking to Elementary School in 34 California
Communities. American Journal of Health Promotion, 19(2), 128-136. https://doi.org/10.4278/0890-1171-19.2.128
Brockman, R., Jago, R., & Fox, K. R. (2011). Children's Active Play: Self-Reported Motivators, Barriers and Facilitators. BMC Public Health, 11(1), 461. https://doi.org/10.1186/1471-2458-11-461
Brodersen, N. H., Steptoe, A., Williamson, S., & Wardle, J.
(2005). Sociodemographic, Developmental, Environmental, and
Psychological Correlates of Physical Activity and Sedentary Behavior at Age 11
to 12. Annals of Behavioral Medicine, 29(1), 2-11. https://doi.org/10.1207/s15324796abm2901_2
Carver, A., Timperio, A., & Crawford, D. (2008).
Playing it Safe: The Influence of Neighbourhood Safety on Children's Physical
Activity-A Review. Health & Place, 14(2), 217-227. https://doi.org/10.1016/j.healthplace.2007.06.004
Cavill,
N., Biddle, S., & Sallis, J. F. (2001). Health Enhancing Physical
Activity for Young People: Statement of the United Kingdom Expert Consensus
Conference. Pediatric Exercise Science, 13(1), 12-25. https://doi.org/10.1123/pes.13.1.12
Cerin, E., Conway, T. L., Barnett, A., Smith, M., Veitch, J., Cain, K. L., Salonna, F., Reis, R. S., Molina-García, J., & Hinckson, E. (2019). Development and Validation of the Neighborhood Environment Walkability Scale for Youth Across Six Continents. International Journal of Behavioral Nutrition and Physical Activity, 16(1), 1-16. https://doi.org/10.1186/s12966-019-0890-6
Chandramouli, C., & General, R. (2011).
Census of India, Rural
Urban Distribution of Population, Provisional
Population Total. New Delhi: Office of the Registrar
General and Census Commissioner,
India.
Chhabra, R. (2023, July
6). India to have Billion-Plus Middle Class by
2047: Study. Financialexpress.
Chinapaw, M. J. M., Mokkink, L. B., Van Poppel, M. N. M., Van
Mechelen, W., & Terwee, C. B. (2010). Physical Activity
Questionnaires for Youth: A Systematic Review of Measurement Properties. Sports
Medicine, 40(7), 539-563. https://doi.org/10.2165/11530770-000000000-00000
Corbin, Guy C. Le Masurier, & Dolley D. Lambdin. (2018).
Fitness for Life: Middle School
2nd Edition PDF. Human Kinetics.
Das, R., & Banerjee, A. (2023). Identifying The Parameters for
Assessment of Child-Friendliness in Urban Neighborhoods in Indian Cities.
Journal of Urban Affairs, 45(2), 217-235. https://doi.org/10.1080/07352166.2020.1863815
Davison, K., & Lawson, C. T. (2006). [No title found]. International Journal of Behavioral Nutrition and Physical Activity, 3(1), 19. https://doi.org/10.1186/1479-5868-3-19
De Vries, S. I., Bakker, I., Van Mechelen, W., & Hopman-Rock, M.
(2007). Determinants of Activity-Friendly Neighborhoods for Children:
Results from the Space Study. American Journal of Health Promotion,
21(4_suppl), 312-316. https://doi.org/10.4278/0890-1171-21.4s.312
DelGiudice, M. (2018). Middle Childhood: An
Evolutionary-Developmental Synthesis. In N. Halfon, C. B. Forrest, R. M.
Lerner, & E. M. Faustman (Eds.), Handbook of Life Course Health Development
(pp. 95-107). Springer International Publishing. https://doi.org/10.1007/978-3-319-47143-3_5
Ding, D., Sallis, J. F., Kerr, J., Lee, S., & Rosenberg, D. E. (2011).
Neighborhood Environment and Physical Activity Among Youth. American Journal of
Preventive Medicine, 41(4), 442-455. https://doi.org/10.1016/j.amepre.2011.06.036
Dutta, S., Bardhan, S., & Bhaduri, S. (2017, February 3). Multi-Criteria Approach for Assessing Neighbourhood Environmental Quality - A Way Towards Future Sustainable Development of Indian Cities.
Eccles,
J. S. (1999). The Development of Children Ages 6 to 14. The Future of
Children, 9(2), 30. https://doi.org/10.2307/1602703
Edwards,
P., & Tsouros, A. (2006). Promoting Physical Activity and Active Living in Urban Environments:
The Role of Local Governments.
World Health Organization. Regional Office for Europe.
Eime,
R. M., Young, J. A., Harvey, J. T., Charity, M. J., & Payne, W. R. (2013).
A Systematic Review of the Psychological and Social Benefits of Participation
in Sport for Adults: Informing The Development of a Conceptual Model of Health
Through Sport. International Journal of Behavioral Nutrition and Physical
Activity, 10(1), 135. https://doi.org/10.1186/1479-5868-10-135
Forsyth, A. (2007). Twin Cities Walking Study, Environment and Physical Activity: GIS Protocols. USA: University of Minnesota and Cornell.
Frank, L. D., Saelens, B. E.,
Chapman, J., Sallis, J. F., Kerr, J., Glanz, K., Couch, S. C., Learnihan, V.,
Zhou, C., Colburn, T., & Cain, K. L. (2012). Objective
Assessment of Obesogenic Environments in Youth. American Journal of Preventive
Medicine, 42(5), e47-e55. https://doi.org/10.1016/j.amepre.2012.02.006
Frank, L. D., Schmid, T. L., Sallis, J. F., Chapman, J., &
Saelens, B. E. (2005). Linking Objectively Measured Physical Activity
with Objectively Measured Urban Form. American Journal of Preventive Medicine,
28(2), 117-125. https://doi.org/10.1016/j.amepre.2004.11.001
Frank, L., Kerr, J., Chapman, J., & Sallis, J. (2007).
Urban Form Relationships with Walk Trip Frequency and Distance among Youth.
American Journal of Health Promotion, 21(4_suppl), 305-311. https://doi.org/10.4278/0890-1171-21.4s.305
Franzini,
L., Elliott, M. N., Cuccaro, P., Schuster, M., Gilliland, M. J., Grunbaum, J.
A., Franklin, F., & Tortolero, S. R. (2009). Influences of Physical
and Social Neighbourhood Environments on Children's Physical Activity and
Obesity. American Journal of Public Health, 99(2), 271-278.
https://doi.org/10.2105/AJPH.2007.128702
Giles-Corti, B., Timperio, A., Bull, F., & Pikora, T. (2005).
Understanding Physical Activity Environmental Correlates: Increased Specificity
for Ecological Models: Exercise and Sport Sciences Reviews, 33(4), 175-181. https://doi.org/10.1097/00003677-200510000-00005
Giles-Corti, B., Wood, G., Pikora, T.,
Learnihan, V., Bulsara, M., Van Niel, K., Timperio, A., McCormack, G., &
Villanueva, K. (2011). School Site and The Potential to walk to School:
The Impact of Street Connectivity and Traffic Exposure in School Neighborhoods.
Health & Place, 17(2), 545-550. https://doi.org/10.1016/j.healthplace.2010.12.011
Goenka, S., & Devarajan, R. (2020). Higher Physical Activity
Levels in Children Have Wide-Ranging Benefits: Towards Multisectoral Action.
Indian Pediatrics, 57(8), 705-706. https://doi.org/10.1007/s13312-020-1911-x
Grow, H. M., Saelens, B. E., Kerr, J., Durant, N. H., Norman, G. J.,
& Sallis, J. F. (2008). Where Are Youth Active? Roles of Proximity,
Active Transport, and Built Environment. Medicine & Science in Sports &
Exercise, 40(12), 2071-2079. https://doi.org/10.1249/MSS.0b013e3181817baa
Guthold, R., Cowan, M. J., Autenrieth, C. S., Kann, L., & Riley,
L. M. (2010). Physical Activity and Sedentary Behavior Among
Schoolchildren: A 34-Country Comparison. The Journal of Pediatrics, 157(1),
43-49.e1. https://doi.org/10.1016/j.jpeds.2010.01.019
Harjani, A. (2012, October 24). India's
Secret Weapon: Its Young Population. CNBC.
Hayball,
F., McCrorie, P., Kirk, A., Gibson, A., & Ellaway, A. (2018).
Exploring Children's Perceptions of Their Local Environment in Relation to Time
Spent Outside. Children & Society, 32(1), 14-26. https://doi.org/10.1111/chso.12217
Holt, N. L., Spence, J. C., Sehn, Z. L., &
Cutumisu, N. (2008). Neighborhood and Developmental Differences in
Children's Perceptions of Opportunities for Play and Physical Activity. Health
& Place, 14(1), 2-14. https://doi.org/10.1016/j.healthplace.2007.03.002
Horelli, L. (2007). Constructing a Theoretical Framework for Environmental Child-Friendliness. Children, Youth and Environments, 17(4), 267-292. https://doi.org/10.1353/cye.2007.0032
Huang,
Y. J., Wong, S. H. S., & Salmon, J. (2009). Reliability and Validity
of the Modified Chinese Version of the Children's Leisure Activities Study
Survey (CLASS) Questionnaire in Assessing Physical Activity among Hong Kong
Children. Pediatric Exercise Science, 21(3), 339-353. https://doi.org/10.1123/pes.21.3.339
Högman, J., Augustsson, C., & Hedström, P. (2020). Let's do
those 60 minutes! Children's Perceived Landscape for Daily Physical Activity.
Sport, Education and Society, 25(4), 395-408. https://doi.org/10.1080/13573322.2019.1610374
Indian Road Congress. (1983). IRC 086: Geometric Design Standards for Urban Roads in Plains. IRC:86.
Islam, M. Z. (2008). Children
and Urban Neighborhoods: Relationships Between Outdoor Activities of Children and Neighborhood Physical Characteristics
in Dhaka, Bangladesh. North Carolina State University.
Islam,
M. Z., Moore, R., & Cosco, N. (2016). Child-Friendly, Active,
Healthy Neighborhoods: Physical Characteristics and Children's Time Outdoors.
Environment and Behavior, 48(5), 711-736. https://doi.org/10.1177/0013916514554694
Kaczynski, A. T., Hughey, S. M., Stowe, E. W., Wende, M. E.,
Hipp, J. A., Oliphant, E. L., & Schipperijn, J. (2020). ParkIndex:
Validation and Application of a Pragmatic Measure of Park Access and Use.
Preventive Medicine Reports, 20, 101218. https://doi.org/10.1016/j.pmedr.2020.101218
Kaczynski, A. T., Schipperijn, J., Hipp, J. A., Besenyi, G. M.,
Wilhelm Stanis, S. A., Hughey, S. M., & Wilcox, S. (2016).
ParkIndex: Development of a Standardized Metric of Park Access for Research and
Planning. Preventive Medicine, 87, 110-114. https://doi.org/10.1016/j.ypmed.2016.02.012
Kanigel, R. (2016). Eyes on the Street: The Life of
Jane Jacobs. New York: Knopf.
Karki, A., Shrestha, A., & Subedi, N. (2019). Prevalence and Associated Factors of Childhood Overweight/Obesity
Among Primary School Children in Urban Nepal. BMC Public Health, 19(1), 1055. https://doi.org/10.1186/s12889-019-7406-9
Khadilkar, V. V., Khadilkar, A. V., Cole, T. J., Chiplonkar, S. A.,
& Pandit, D. (2011). Overweight and Obesity Prevalence and Body Mass
Index Trends in Indian children. International Journal of Pediatric Obesity,
6(2-2), e216-e224. https://doi.org/10.3109/17477166.2010.541463
Khatavkar,
P. R. (2018). Nurturing Children's Health Through Neighbourhood
Morphology. Creative Space, 6(1), 11-22.
https://doi.org/10.15415/cs.2018.61002
Kingsly,
A., Timperio, A., Veitch, J., Salmon, J., Pradeepa, R., Ranjani, H., &
Anjana, R. M. (2020). Individual, Social and Environmental Correlates of
Active School Travel among Adolescents in India. International Journal of
Environmental Research and Public Health, 17(20), 7496. https://doi.org/10.3390/ijerph17207496
Kohl,
H. W., & Hobbs, K. E. (1998). Development of Physical Activity
Behaviours among Children and Adolescents. Pediatrics, 101(3 Pt 2), 549-554. https://doi.org/10.1542/peds.101.S2.549
Koohsari, M. J., Mavoa, S., Villanueva, K.,
Sugiyama, T., Badland, H., Kaczynski, A. T., Owen, N., & Giles-Corti, B.
(2015). Public Open Space, Physical Activity, Urban Design and Public
Health: Concepts, Methods and Research Agenda. Health & Place, 33, 75-82. https://doi.org/10.1016/j.healthplace.2015.02.009
Kundu, D. (with N.I.U.A. (Organization : India) & UNICEF, New Delhi). (2020). Children and Adolescents in Urban India: Scale and Nature of Deprivation. National Institute of Urban Affairs.
Kyttä, A. M., Broberg, A. K., & Kahila, M. H. (2012). Urban
Environment and Children's Active Lifestyle: SoftGIS Revealing Children's
Behavioral Patterns and Meaningful Places. American Journal of Health
Promotion, 26(5), e137-e148. https://doi.org/10.4278/ajhp.100914-QUAN-310
Lahoti,
S., Kefi, M., Lahoti, A., & Saito, O. (2019). Mapping Methodology of
Public Urban Green Spaces Using GIS: An Example of Nagpur City, India.
Sustainability, 11(7), 2166. https://doi.org/10.3390/su11072166
Leventhal, T., & Brooks-Gunn, J. (2000). The
neighborhoods they live in: The Effects of Neighborhood Residence on Child and
Adolescent Outcomes. Psychological Bulletin, 126(2), 309.
https://doi.org/10.1037//0033-2909.126.2.309
Loebach,
J., & Gilliland, J. (2022). Examining the Social and Built
Environment Factors Influencing Children's Independent Use of Their
Neighborhoods and the Experience of Local Settings as Child-Friendly. Journal
of Planning Education and Research, 42(4), 539-553. https://doi.org/10.1177/0739456X19828444
Loon,
J. V., & Frank, L. (2011). Urban Form Relationships with Youth
Physical Activity: Implications for Research and Practice. Journal of Planning
Literature, 26(3), 280-308. https://doi.org/10.1177/0885412211400978
MoHUA & BvLF. (2019). Infant, Toddler,
Caregiver-Friendly Neighbourhood
(Itcn) Framework and Guidelines.
Molnar, B. E., Gortmaker, S. L., Bull, F. C., & Buka, S. L. (2004).
Unsafe to Play? Neighborhood Disorder and Lack of Safety Predict Reduced
Physical Activity among Urban Children and Adolescents. American Journal of
Health Promotion, 18(5), 378-386. https://doi.org/10.4278/0890-1171-18.5.378
Moore, K. A., & Theokas, C. (2008). Conceptualizing a
Monitoring System for Indicators in Middle Childhood. Child Indicators
Research, 1(2), 109-128. https://doi.org/10.1007/s12187-008-9011-9
Moore, R., & Young, D. (1978). Childhood Outdoors: Toward a Social Ecology of the Landscape. In I. Altman & J. F. Wohlwill (Eds.), Children and the Environment (pp. 83-130). Springer US. https://doi.org/10.1007/978-1-4684-3405-7_4
Mukherjee, M., Roy, U., Biswas,
A., Arora, K., De, B., & Srivastava, A. (2016, March 2). Changing Paradigms
of Affordable Housing in
Independent India.
NIUA (2016a). Indicators for CHIld friendly Local Development (I - CHILD). National Institute of Urban Affairs, DELHINIUA.
NIUA. (2016b, July 14). Child Friendly
Smart Cities Hub at NIUA [Text]. https://jobs.niua.org/projects/child-friendly-smart-cities-hub-niua
Nordbø, E. C. A., Nordh, H., Raanaas, R. K., & Aamodt, G. (2018). GIS-Derived Measures of The Built Environment Determinants of Mental Health and Activity Participation in Childhood and Adolescence: A Systematic Review. Landscape and Urban Planning, 177, 19-37. https://doi.org/10.1016/j.landurbplan.2018.04.009
Nordbø, E. C. A., Nordh, H., Raanaas, R. K., & Aamodt, G.
(2020). Promoting Activity Participation and Well-Being Among Children
and Adolescents: A Systematic Review of Neighborhood Built-Environment
Determinants. JBI Evidence Synthesis, 18(3), 370-458. https://doi.org/10.11124/JBISRIR-D-19-00051
Nordbø, E. C. A., Raanaas, R. K., Nordh, H., & Aamodt, G.
(2019). Neighborhood Green Spaces, Facilities and Population Density as
Predictors of Activity Participation Among 8-Year-Olds: A Cross-Sectional Gis
Study Based on The Norwegian Mother and Child Cohort Study. BMC Public Health,
19(1), 1426. https://doi.org/10.1186/s12889-019-7795-9
Oliver, M., Mavoa, S., Badland, H., Parker, K.,
Donovan, P., Kearns, R. A., Lin, E.-Y., & Witten, K. (2015).
Associations Between The Neighbourhood Built Environment and Out of School
Physical Activity and Active Travel: An examination from the Kids in the City
study. Health & Place, 36, 57-64. https://doi.org/10.1016/j.healthplace.2015.09.005
Oliver, M., McPhee, J., Carroll, P., Ikeda, E., Mavoa, S., Mackay,
L., Kearns, R. A., Kyttä, M., Asiasiga, L., Garrett, N., Lin, J., Mackett, R.,
Zinn, C., Moewaka Barnes, H., Egli, V., Prendergast, K., & Witten, K.
(2016). Neighbourhoods for Active Kids: Study Protocol For A
Cross-Sectional Examination of Neighbourhood Features and Children's Physical
Activity, Active Travel, Independent Mobility and Body Size. BMJ Open, 6(8),
e013377. https://doi.org/10.1136/bmjopen-2016-013377
Ortegon-Sanchez,
A., McEachan, R. R. C., Albert, A., Cartwright, C., Christie, N., Dhanani, A., Islam,
S., Ucci, M., & Vaughan, L. (2021). Measuring the Built Environment
in Studies of Child Health-A Meta-Narrative Review of Associations.
International Journal of Environmental Research and Public Health, 18(20),
10741. https://doi.org/10.3390/ijerph182010741
PMAY, P. M. A. (2015). Housing for all (Urban), Scheme Guidelines 2015. Report. Ministry of Housing and Urban Poverty Alleviation, Government of India. Government of India.
PMAY-HFA(Urban). (n.d.). Retrieved July 18, 2024,
from https://pmaymis.gov.in/
Page,
A. S., Cooper, A. R., Griew, P., & Jago, R. (2010). Independent
mobility, Perceptions of The Built Environment and Children's Participation in
Play, Active Travel and Structured Exercise and Sport: The PEACH Project.
International Journal of Behavioral Nutrition and Physical Activity, 7(1), 17. https://doi.org/10.1186/1479-5868-7-17
Panter,
J. R., Jones, A. P., & Van Sluijs, E. M. (2008). Environmental
Determinants of Active Travel in Youth: A Review and Framework for Future
Research. International Journal of Behavioral Nutrition and Physical Activity,
5(1), 34. https://doi.org/10.1186/1479-5868-5-34
Pikora, T., Giles-Corti, B., Bull, F., Jamrozik, K., & Donovan, R. (2003). Developing a Framework for Assessment of The Environmental Determinants of Walking and Cycling. Social Science & Medicine, 56(8), 1693-1703. https://doi.org/10.1016/S0277-9536(02)00163-6
Pindarwati, A., & Wijayanto, A. W. (2023). Automatic
Detection and Counting of Urban Housing and Settlement in Depok City,
Indonesia: An Object-Based Deep Learning Model on Optical Satellite Imageries
and Points of Interests. Proceedings of The International Conference on Data
Science and Official Statistics, 2023(1), 162-176. https://doi.org/10.34123/icdsos.v2023i1.349
Prezza,
M., Pilloni, S., Morabito, C., Sersante, C., Alparone, F. R., & Giuliani,
M. V. (2001). The influence of Psychosocial and Environmental Factors on
Children's Independent Mobility and Relationship To Peer Frequentation. Journal
of Community & Applied Social Psychology, 11(6), 435-450.
https://doi.org/10.1002/casp.643
PwC India & Save the Children India. (2015). Forgotten voices: The World of Urban Children in India.
Ranjani,
H., Mehreen, T., Pradeepa, R., Anjana, R., Garg, R., Anand, K., & Mohan, V.
(2016). Epidemiology of Childhood Overweight & Obesity in India: A
Systematic Review. Indian Journal of Medical Research, 143(2), 160. https://doi.org/10.4103/0971-5916.180203
Roemmich, J. N., Epstein, L. H., Raja, S., & Yin, L. (2007). The Neighborhood and Home Environments: Disparate Relationships with Physical Activity and Sedentary Behaviors in Youth. Annals of Behavioral Medicine, 33(1), 29-38. https://doi.org/10.1207/s15324796abm3301_4
Rosenberg, D., Ding, D., Sallis, J. F., Kerr, J., Norman, G. J.,
Durant, N., Harris, S. K., & Saelens, B. E. (2009). Neighborhood
Environment Walkability Scale for Youth (NEWS-Y): Reliability and Relationship
with Physical Activity. Preventive Medicine, 49(2-3), 213-218.
https://doi.org/10.1016/j.ypmed.2009.07.011
Roy, A. (2018). From 1947 to the Present And Beyond, 23(1).
Roy, S., & Sowgat, T. (2024). The Neighbourhood Effect on
Mental Well-Being in the Global South. Cities & Health, 1-27. https://doi.org/10.1080/23748834.2024.2303565
Rudd, M. (2019). Feeling Short on Time: Trends, Consequences, and
Possible Remedies. Current Opinion in Psychology, 26, 5-10. https://doi.org/10.1016/j.copsyc.2018.04.007
Sallis,
J. F., & Glanz, K. (2006). The Role of Built Environments in
Physical Activity, Eating, and Obesity in Childhood. The Future of Children,
16(1), 89-108. https://doi.org/10.1353/foc.2006.0009
Sallis, J. F., & Owen, N. (1998). Physical Activity and Behavioral Medicine. Sage Publications.
Sallis, J. F., Alcaraz, J. E., McKenzie, T. L., & Hovell, M. F.
(1999). Predictors of Change in Children's Physical Activity Over 20
months. American Journal of Preventive Medicine, 16(3), 222-229. https://doi.org/10.1016/S0749-3797(98)00154-8
Sallis, J. F., Cervero, R. B., Ascher,
W., Henderson, K. A., Kraft, M. K., & Kerr, J. (2006). An ecological
approach to creating active living communities. Annual Review of Public Health,
27(1), 297-322.
https://doi.org/10.1146/annurev.publhealth.27.021405.102100
Sallis, J. F., Prochaska, J. J., & Taylor, W. C. (2000).
A Review of Correlates of Physical Activity of Children and Adolescents:
Medicine & Science in Sports & Exercise, 963-975. https://doi.org/10.1097/00005768-200005000-00014
Sallis, J., Owen, N., & Fisher, E. (2008). Ecological Models of Health Behavior. Health Behavior and Health Education, 4.
Saunders,
R. P., Pate, R. R., Felton, G., Dowda, M., Weinrich, M. C., Ward, D. S.,
Parsons, M. A., & Baranowski, T. (1997). Development of
Questionnaires to Measure Psychosocial Influences on Children's Physical
Activity. Preventive Medicine, 26(2), 241-247. https://doi.org/10.1006/pmed.1996.0134
Schoeppe, S., Duncan, M. J., Badland, H., Oliver, M., & Curtis,
C. (2013). Associations of Children's Independent Mobility and Active
Travel with Physical Activity, Sedentary Behaviour and Weight Status: A
Systematic Review. Journal of Science and Medicine in Sport, 16(4), 312-319. https://doi.org/10.1016/j.jsams.2012.11.001
Schonert-Reichl, K. A.
(2011). Middle Childhood Inside and Out.
Shastri,
P. (2009). Promotion and Prevention in Child Mental Health. Indian
Journal of Psychiatry, 51(2), 88. https://doi.org/10.4103/0019-5545.49447
Smartcities. (n.d.). Retrieved July 29, 2024, from
Smith, M., Hosking, J., Woodward, A., Witten, K., MacMillan, A., Field,
A., Baas, P., & Mackie, H. (2017). Systematic Literature Review of
Built Environment Effects on Physical Activity and Active Transport - An Update
and New Findings on Health Equity. International Journal of Behavioral
Nutrition and Physical Activity, 14(1), 158. https://doi.org/10.1186/s12966-017-0613-9
Spilsbury, J. C., Korbin, J. E., & Coulton, C. J. (2009).
Mapping Children's Neighborhood Perceptions: Implications for Child Indicators.
Child Indicators Research, 2(2), 111-131. https://doi.org/10.1007/s12187-009-9032-z
Swaminathan, S., Selvam, S., Thomas, T., Kurpad, A. V., & Vaz, M. (2011). Longitudinal Trends in Physical Activity Patterns in Selected Urban South Indian School Children. The Indian Journal of Medical Research, 134(2), 174.
TRB
Special Reoprt. (2005). Does the Built Environment Influence Physical
Activity?: Examining the Evidence-Special Report 282 (p. 11203). Transportation
Research Board. https://doi.org/10.17226/11203
Tapnikar, L. A., & Dhingra, S. (2014). Prevalence of obesity and Overweight among High School Children in Nagpur, Maharashtra: A Cross-Sectional Study. Sch J Appl Med Sci.
Taylor,
L. G., Clark, A. F., Wilk, P., Button, B. L., & Gilliland, J. A. (2018).
Exploring the Effect of Perceptions on Children's Physical Activity in Varying
Geographic Contexts: Using a Structural Equation Modelling Approach to Examine
a Cross-Sectional Dataset. Children, 5(12), 159. https://doi.org/10.3390/children5120159
Telama,
R., Yang, X., Hirvensalo, M., & Raitakari, O. (2006). Participation
in Organized Youth Sport as a Predictor of Adult Physical Activity: A 21-Year
Longitudinal Study. Pediatric Exercise Science, 18(1), 76-88. https://doi.org/10.1123/pes.18.1.76
Telford,
A., Salmon, J., Jolley, D., & Crawford, D. (2004). Reliability and
Validity of Physical Activity Questionnaires for Children: The Children's
Leisure Activities Study Survey (CLASS). Pediatric Exercise Science, 16(1),
64-78. https://doi.org/10.1123/pes.16.1.64
Tetali, S., Edwards, P., & Roberts, G. V. S. M. I. (2016).
How do Children Travel to School in Urban India? A cross-sectional Study of
5,842 Children in Hyderabad. BMC Public Health, 16(1), 1099. https://doi.org/10.1186/s12889-016-3750-1
Tetali, S., Edwards, P., Murthy, G. V. S., & Roberts, I. (2015).
Development and Validation of A Self-Administered Questionnaire to Estimate The
Distance and Mode of Children's Travel to School in Urban India. BMC Medical
Research Methodology, 15(1), 92. https://doi.org/10.1186/s12874-015-0086-y
Thakre, S. B., Mohane, S. P., Ughade, S. M., Thakre, S. S., Morey, S. S., & Humne, A. Y. (2011). Correlates of Overweight and Obesity Among Urban School-Going Children of Nagpur City. Journal of Clinical and Diagnostic Research, 5(8), 1593-1597.
Timperio, A. (2004). Perceptions about the Local
Neighborhood and Walking And Cycling Among Children. Preventive Medicine,
38(1), 39-47. https://doi.org/10.1016/j.ypmed.2003.09.026
Timperio, A., Ball, K., Salmon, J., Roberts, R., Giles-Corti,
B., Simmons, D., Baur, L. A., & Crawford, D. (2006). Personal,
Family, Social, and Environmental Correlates of Active Commuting to School.
American Journal of Preventive Medicine, 30(1), 45-51. https://doi.org/10.1016/j.amepre.2005.08.047
Timperio, A., Giles-Corti, B., Crawford, D., Andrianopoulos, N.,
Ball, K., Salmon, J., & Hume, C. (2008). Features of Public Open
Spaces and Physical Activity Among Children: Findings from the CLAN study.
Preventive Medicine, 47(5), 514-518. https://doi.org/10.1016/j.ypmed.2008.07.015
Trost, S. G., Pate, R. R., Ward, D. S., Saunders, R., & Riner, W.
(1999). Correlates of Objectively Measured Physical Activity in
Preadolescent Youth. American Journal of Preventive Medicine, 17(2), 120-126. https://doi.org/10.1016/S0749-3797(99)00056-2
Tyagi, M., & Raheja, G. (2020). Indian Parents'
Perception of Children's Independent Mobility in Urban Neighbourhoods: A case
study of Delhi. Children's Geographies, 19(4), 390-406. https://doi.org/10.1080/14733285.2020.1797996
Tyagi, M., & Raheja, G. (2021). Children's Independent
Mobility Licence and its Association with The Built and Social Environment: A
Study Across Neighbourhood Typologies in Kolkata. Children's Geographies,
19(6), 717-734. https://doi.org/10.1080/14733285.2021.1891526
Veitch, J., Bagley, S., Ball, K., & Salmon,
J. (2006). Where do Children Usually Play? A Qualitative Study of
Parents' Perceptions of Influences on Children's Active Free-Play. Health &
Place, 12(4), 383-393. https://doi.org/10.1016/j.healthplace.2005.02.009
Veitch,
J., Carver, A., Hume, C., Crawford, D., Timperio, A., Ball, K., & Salmon,
J. (2014). Are Independent Mobility and Territorial Range Associated
with Park Visitation Among Youth? International Journal of Behavioral Nutrition
and Physical Activity, 11(1), 73. https://doi.org/10.1186/1479-5868-11-73
Veitch,
J., Salmon, J., & Ball, K. (2010). Individual, Social and Physical
Environmental Correlates of Children's Active Free-Play: A Cross-Sectional
Study. International Journal of Behavioral Nutrition and Physical Activity,
7(1), 11. https://doi.org/10.1186/1479-5868-7-11
Villanueva, K., Badland, H., Kvalsvig, A., O'Connor, M., Christian,
H., Woolcock, G., Giles-Corti, B., & Goldfeld, S. (2016). Can the
Neighborhood Built Environment Make a Difference in Children's Development?
Building the Research Agenda to Create Evidence for Place-Based Children's
Policy. Academic Pediatrics, 16(1), 10-19. https://doi.org/10.1016/j.acap.2015.09.006
Villanueva, K., Giles-Corti, B., Bulsara,
M., McCormack, G. R., Timperio, A., Middleton, N., Beesley, B., & Trapp, G.
(2012). How Far Do Children Travel From Their Homes? Exploring
Children's Activity Spaces in Their Neighborhood. Health & Place, 18(2),
263-273. https://doi.org/10.1016/j.healthplace.2011.09.019
WHO 2006. (n.d.). Global Strategy on Diet, Physical Activity and Health. Retrieved July 7, 2024, from
WHO
2016. (2016). Report of the Commission On Ending
Childhood Obesity. World Health Organization.
WHO.
(2017). Mental Health Status
of Adolescents in South-East Asia: Evidence for
Action. World Health Organization.
Regional Office for South-East Asia.
WHO.
(2018). ACTIVE: A Technical
Package for Increasing Physical Activity. World Health Organization.
WHO. (2021). Obesity
and Overweight.
Weir, L. A., Etelson, D., & Brand, D. A. (2006). Parents'
Perceptions of Neighborhood Safety and Children's Physical Activity. Preventive
Medicine, 43(3), 212-217. https://doi.org/10.1016/j.ypmed.2006.03.024
Wong, B. Y.-M., Cerin, E., Ho, S.-Y., Mak, K.-K., Lo, W.-S., & Lam,
T.-H. (2010). Adolescents' Physical Activity: Competition Between
Perceived Neighborhood Sport Facilities And Home Media Resources. International
Journal of Pediatric Obesity, 5(2), 169-176. https://doi.org/10.3109/17477160903159432
 This work is licensed under a: Creative Commons Attribution 4.0 International License
© Granthaalayah 2014-2024. All Rights Reserved.