Understanding Social Media Application for Sustainable Development Goals
Pooja Singh 1![]()
![]() ,
Dr. Shrikant Singh 2
,
Dr. Shrikant Singh 2![]()
1 Ph.D.
Research Scholar Designation, Electronic Media Department, Makhanlal
Chaturvedi National University of Journalism and Communication, Bhopal, (M.P),
India
2 Professor,
Electronic Media Department, Makhanlal Chaturvedi
National University of Journalism and Communication, Bhopal, (M.P), India
|
|
|
ABSTRACT |
|
|
In recent
years, social media has emerged as a powerful medium for promoting and
achieving Sustainable Development Goals (SDGs). This paper explores the
multifaceted role of social media applications in advancing the 17 SDGs
outlined by the United Nations. By analyzing literatures,
user engagement metrics, and usage strategies, we aim to understand how
social media can drive awareness, mobilize communities, and foster
collaboration among stakeholders. The study identifies key platforms and
tactics that have proven effective in influencing public opinion,
disseminating critical information, and key purpose for using social media
toward sustainability. Furthermore, it highlights the challenges of
applications, digital divide, and correlation among different sustainable
goals (Quality Education, Good Health and Well Being, Sustainable
Communities, Climate Action) concerns that could undermine these efforts. Our
findings suggest that when strategically leveraged, social media not only
enhances communication and outreach but also accelerates the implementation
of sustainable practices globally. However, there are total sample taken for
study is 500 out of which 466 have been collected, it includes descriptive
study with survey method to collect responses. This paper concludes with
recommendations for policymakers, NGOs, and social media companies to utilize
the full potential of these digital platforms in achieving a more sustainable
future. |
|||
|
Received 14 June
2024 Accepted 15 July 2024 Published 05 August 2024 Corresponding Author Pooja
Singh, pooja03.media@gmail.com DOI 10.29121/granthaalayah.v12.i7.2024.5691 Funding: This research
received no specific grant from any funding agency in the public, commercial,
or not-for-profit sectors. Copyright: © 2024 The
Author(s). This work is licensed under a Creative Commons
Attribution 4.0 International License. With the
license CC-BY, authors retain the copyright, allowing anyone to download,
reuse, re-print, modify, distribute, and/or copy their contribution. The work
must be properly attributed to its author.
|
|||
|
Keywords: Social Media, Application, Youtube, Facebook, Instagram, Twitter, Whatsapp, Sustainable Goals, Youth |
|||
1. INTRODUCTION
In today's digitally interconnected world, social media applications have become omnipresent tools for communication, collaboration, and community building. These platforms have revolutionized the way individuals interact, share information, and express themselves online. From connecting with friends and family to networking with professionals and exploring new interests, social media applications offer a diverse range of functionalities that shape our online experiences. The growth of social media applications has transformed the landscape of communication, providing users with unusual opportunities to connect with others across geographical boundaries and cultural divides. Whether through text, images, videos, or live streams, these platforms enable users to express themselves in diverse and creative ways, fostering a global exchange of ideas and perspectives.
Moreover, social media applications serve as powerful tools for information dissemination and facilitating the rapid spread of news, trends, and viral content. From breaking news updates to grassroots movements, social media platforms have played a significant role in shaping public discourse and mobilizing collective action on a wide range of social and political issues. However, the widespread adoption of social media applications has also raised concerns about privacy, security, and digital well-being. As users entrust these platforms with personal data and engage in online interactions, questions arise about the protection of privacy rights, the prevalence of online harassment, and the impact of excessive screen time on mental health.
1.2. Understanding social media
The emergence of social media applications marks a paradigm shift in communication. From the early days of platforms like Six Degrees and Friendster to the global dominance of Facebook, Twitter, and Instagram, social media has evolved rapidly. Today, new platforms like TikTok and Clubhouse are redefining the landscape, catering to changing user preferences and technological advancements.
Social media platforms facilitate communication, networking, and collaboration, enabling individuals to maintain relationships and discover new opportunities. They allow users to express themselves through curated profiles, posts, and multimedia content, with platforms like Instagram and Facebook popularizing visual storytelling. These platforms rapidly disseminate information, promoting awareness and civic engagement but also posing challenges related to misinformation and echo chambers. Privacy concerns arise due to the vast amounts of personal data collected, often without users fully understanding the implications. Social media serves as a network that crosses the boundaries of learning, work, and leisure.
1.3. Navigating Social Application
the Internet and the social media networking applications are not only just a haven from the outside world of technology but are seen more as a network of informal connections that crossed the boundaries of learning, work and leisure.
YouTube:
Owned by Google, YouTube is the second most visited website globally, with over 2.5 billion monthly users watching over one billion hours of videos daily.
WhatsApp:
Owned by Meta, WhatsApp is an instant messaging and voice-over-IP service enabling users to send messages, make calls, and share various content types.
Instagram:
Also owned by Meta, Instagram is a photo and video sharing platform where users can upload, edit, and share media, organized by hashtags and geotags, with followers.
Twitter/X:
A major social media platform with over 500 million users, allowing sharing of text, images, and videos through posts, along with direct messaging and audio features.
Facebook:
Created by Mark Zuckerberg and now owned by Meta, Facebook has about 3 billion monthly active users and is the third most visited website, allowing users to connect and share content.
2. OBJECTIVES
1) To determine which social platform respondents, use for sustainable goals.
2) To study whether social media bring positive or adverse changes toward sustainability
3. REVIEW OF LITERATURE
Zita (2014) about the usage of social media for increasing environmental awareness in higher education. Knag and Park (2018) has discussed about the usage of social media tools for sustainable marketing efforts. Social media tools provide an opportunity to the companies to engage in active dialogues with their customers. Through these social networking sites, people can share news, promote products, develop relationship outside the domestic boundaries, establish two-way communication and share connections. Onete (2013) have argued that social media is providing platform for sustainable business. Social media provide support in different functions of business. It allows customers to gather all information about products and services before purchasing actual product or service. As per the statistics based on report published in 2015, social media usage has been in more than 240 countries around the world. Approximately 42% of world populations are active users of internet and 29% have active social media content. The striking feature of social media tools is the low cost and ability to take the products and services outside domestic boundaries within no time. Media is a concept with multiple meanings and goals, as it deals with studying, downloading and describing the treatment of various social, political, economic, and environmental, health and other phenomena that govern the process of steady development that the world is witnessing in various fields. social media has given us various platforms that enable us to be more vocal on important topics Thirwall (2019). The role digital media undertakes to develop communities is called “Social Engineering in Mass Media”, the importance of which can be spotted in highlighting all development issues, including the economic, social, political, and environmental ones. According to Mcquail (1983), there is a thin line between the media’s role in developing countries and its role in communism. y. Moreover, the liberals criticized the communism theory since they consider the development media a controlling and manipulative tool to news, which the advanced countries produce. Zita (2014) about the usage of social media for increasing environmental awareness in higher education. Pacific Media Assistance Scheme (PACMAS) capacity development advisor Dr Inga Mafileo – also a panellist – said one of the most important roles played by Pacific Island media bodies is to facilitate the journey towards sustainable development. “Media plays a major role in changing mind sets and this means we play several roles – we need to be the watchdog and be at the forefront of closely monitoring and translating knowledge.” Today youth are getting their education online. Social sites are facilitating them in different ways. Social sites are enriched with new knowledge. Social media should be more and more active to inform, engage and empower the youth to contribute in the sustainable human development. Social media should present these issues through interesting ways. For example, if we want to make aware of the school students about ESD (Environment Sustainable Development), then we should make this the part of the curriculum. Rapidly evolving technology, proving to be the most effective region for triggering the development factor in them. This demonstrates how technological growth is yielding positive effects and helping to general development in a variety of economic and noneconomic domains. The use of mobile apps and technologies in general can provide numerous benefits to the university learning environment. The use of YouTube videos can be leveraged as an educational and motivational tool towards achieving learning goals and objectives that is student centered and can be used for student pedagogy with the video as a vehicle for students’ discovery of knowledge and for instructional videos on an online space to share student authored content.
4. RESEARCH METHODOLOGY
Here a research methodology includes systematic approach or technique used to conduct research and gather data in order to answer research questions or objectives of the study. In this study, research method provides a framework for collecting, analyzing and interpreting data in a structured manner. For this study descriptive method has been taken which include survey method to collect data from individuals about their attitudes, beliefs, behaviors or characteristics. Conducting surveys on social media platforms gather data directly from users. This surveys, help to understand demographics, preferences, behaviors, and attitudes of social media users. For making this study more effective we have taken 500 total respondents out of which, we got 466 responses. In this study the sample has been collected through non-probable method that is through snowball sampling method. The data based on questionnaire included close ended question with related demography, which include respondents age, profession, education, gender. Questionnaire mainly focused on usage, purpose, its consumption of time, frequency of using application and its social and personal use. social applications like YouTube, Twitter, Instagram, WhatsApp, Facebook are taken as a medium for user to communicate. Based on these applications we collected the data which reflect the present utility of respondents toward social media applications. Moreover, this study also reflects the effective and adverse factor of social media applications.
5. DATA ANALYSIS
Table 1
|
Table 1 |
|||
|
|
|
Frequency |
Percent |
|
|
FEMALE |
354 |
54.5 |
|
Valid |
MALE |
212 |
45.5 |
|
|
Total |
466 |
100.0 |
Percentage of gender include out of 500 we have collected 466 respondent’s data of which 54.5% are female and 45.5% are male respondents. (Table 1)
Table 2
|
Table 2 |
|||
|
|
|
Frequency |
Percent |
|
|
18-21 |
244 |
52.4 |
|
|
22-26 |
57 |
12.2 |
|
Valid |
27-31 |
70 |
15.0 |
|
|
32-36 |
95 |
20.4 |
|
|
Total |
466 |
100.0 |
Percentage of age categories (Table 2)
Table 3
|
Table 3 |
||||||
|
Case
Summary |
||||||
|
|
Cases |
|||||
|
Valid |
Missing |
Total |
||||
|
N |
Percent |
N |
Percent |
N |
Percent |
|
|
$platform use*Gender |
421 |
90.3% |
45 |
9.7% |
466 |
100.0% |
|
$platform use*Gender Crosstabulation |
|||||
|
|
GENDER OF RESPONDENTS |
Total |
|||
|
FEMALE |
MALE |
||||
|
Applicationa |
Which social platforms do you use (YOUTUBE) |
Count |
176 |
129 |
305 |
|
|
Which social platforms do you use (WHATSAAP) |
Count |
163 |
123 |
286 |
|
|
Which social platforms do you use (INSTAGRAM) |
Count |
160 |
135 |
295 |
|
|
Which social platforms do you use (TWITTER) |
Count |
73 |
64 |
137 |
|
|
Which social platforms do you use (FACEBOOK) |
Count |
63 |
86 |
149 |
|
Total |
|
Count |
231 |
190 |
421 |
|
Percentages and totals
are based on respondents. |
|||||
|
a. Dichotomy group
tabulated at value
1. |
|||||
This table calculated the ratio of both male and female with respected to their responses toward the use of social media application. (Table 3)
General Aspects:
1) The total number of respondents is 421, consisting of 231 females and 190 males.
2) There is a higher number of females 176 use YouTube compared to males 129, and similarly
3) WhatsApp is more popular among females 163 than males 123
4) Instagram usage is also higher among females 160 compared to males 135.
5) Twitter has a relatively balanced usage but still slightly more females 73 use it compared to males 64.
6) Facebook is the only platform in this table where male users 86 outnumber female users 63.
Conclusion:
1) Overall, females are more likely to use YouTube, WhatsApp, Instagram, and Twitter compared to males.
2) Males are more likely to use Facebook compared to females.
3) YouTube is the most used platform among both genders, followed by Instagram and WhatsApp.
4) Twitter and Facebook have fewer users compared to the other platforms listed.
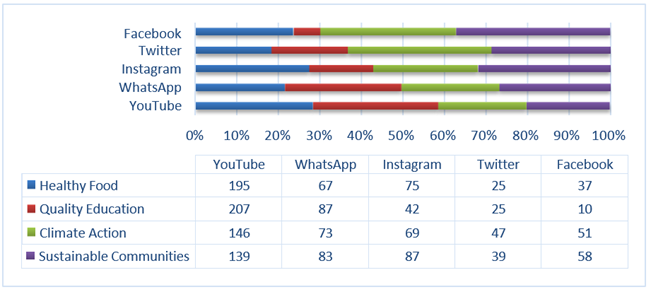
Table 4
|
Table 4 |
|
|
|
|
|
|||||
|
|
YouTube |
WhatsApp |
Instagram |
Twitter |
Facebook |
|||||
|
M |
F |
M |
F |
M |
F |
M |
F |
M |
F |
|
|
Healthy Food |
89 |
106 |
33 |
34 |
32 |
43 |
10 |
15 |
22 |
15 |
|
Quality Education |
97 |
110 |
43 |
44 |
21 |
21 |
12 |
13 |
10 |
18 |
|
Climate Action |
65 |
81 |
34 |
39 |
30 |
39 |
21 |
26 |
25 |
26 |
|
Sustainable
Communities |
66 |
73 |
35 |
48 |
46 |
41 |
20 |
19 |
23 |
35 |
This table indicate the figure in which both male and
female access social platform to collect information about sustainable goals
written above. (Table 4)
The chart presents a comparison of social media platform usage based on four sustainable goals: Healthy Food, Quality Education, Climate Action, and Sustainable Communities. The data is visualized using a stacked bar chart showing the proportion of users for each theme across five platforms (YouTube, WhatsApp, Instagram, Twitter, and Facebook).
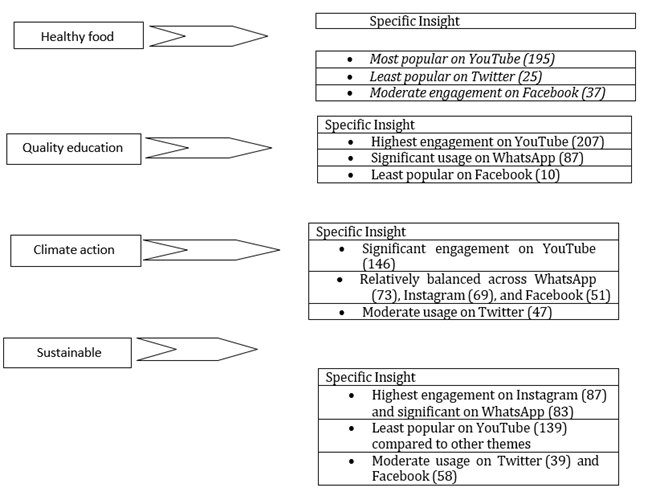
Goals Specific Insight:
Conclusion:
· YouTube is the dominant platform for all themes, particularly for Quality Education.
· WhatsApp and Instagram show notable engagement for Sustainable Communities.
· Twitter and Facebook are less popular overall but have specific niches, with Facebook showing higher engagement for Climate Action and Sustainable Communities.
· Healthy Food and Quality Education have the least engagement on Twitter and Facebook, respectively.
Table 5
|
Table 5 |
|||||
|
Case Summary |
|||||
|
|
Cases |
||||
|
Valid |
Missing |
Total |
|||
|
N |
Percent |
N |
Percent |
N |
|
|
$advertisement*Gender |
202 |
43.3% |
264 |
56.7% |
466 |
|
$advertisement*Gender Crosstabulation |
||||
|
|
GENDER OF RESPON |
|||
|
FEMALE |
MA |
|||
|
Social app |
Does
the social applications inform you about
advertisements related to
sustainable lifestyle (FACEBOOK) |
Count |
54 |
32 |
|
Does the social
applications inform you about
advertisements related to
sustainable lifestyle (WHATSAAP) |
Count |
38 |
25 |
|
|
Does the social
applications inform you about advertisements related to sustainable lifestyle (YOUTUBE) |
Count |
90 |
69 |
|
|
Does the social
applications inform you about
advertisements related to
sustainable lifestyle (TWITTER) |
Count |
29 |
30 |
|
|
Does the social
applications inform you about advertisements related to sustainable lifestyle (INSTAGRAM) |
Count |
47 |
40 |
|
|
Total |
Count |
113 |
89 |
|
|
Percentages and totals are based on respondents. |
||||
|
a. Dichotomy group tabulated at value 1. |
||||
The table analyze response
toward advertisement related to sustainable goal on social application in
respondents’ perspectives. (Table 5)
The provided table shows a crosstabulation of respondents' gender against their responses to whether different social media applications inform them about advertisements related to sustainable lifestyles. The data is divided by social media platform (Facebook, WhatsApp, YouTube, Twitter, Instagram) and gender (female and male), with the total number of responses for each category.
General Aspects:
1) YouTube has the highest number of respondents (159) who receive advertisements related to sustainable lifestyles, followed by Instagram (87) and Facebook (86).
2) For all social media platforms except Twitter, there are more female respondents than male respondents.
3) The gender split among respondents for Twitter is almost equal (29 females and 30 males).
4) Overall, more female respondents (113) reported seeing advertisements related to sustainable lifestyles compared to male respondents (89).
5) WhatsApp has the lowest number of respondents (63) who report seeing these advertisements, with fewer male respondents (25) compared to female respondents (38).
Conclusion
· Females tend to report seeing advertisements related to sustainable lifestyles more frequently than males on most social media platforms except Twitter.
· YouTube is the most common platform for both genders to encounter these advertisements, indicating a potentially wider reach for sustainability-related ads on this platform.
· Twitter is unique in having a nearly balanced gender distribution among respondents who see these ads.
Descriptive analysis using crosstabulation for analyzing promoting sustainable approaches through social media and social platform may bring positive changes toward sustainability.
Table 6
|
Table 6 |
||||
|
Count |
||||
|
|
|
GENDER OF RESPONDENTS |
Total |
|
|
|
|
FEMALE |
MALE |
|
|
Do social platforms promote sustainable approaches? |
STRONGLY AGREE |
69 |
41 |
110 |
|
AGREE |
148 |
129 |
277 |
|
|
NEITHER AGREE NOR DISAGREE |
35 |
34 |
69 |
|
|
DISAGREE |
0 |
6 |
6 |
|
|
STRONGLY DISAGREE |
2 |
2 |
4 |
|
|
Total |
|
354 |
212 |
466 |
Do social platforms promote sustainable approaches? *
GENDER OF RESPONDENTS Crosstabulation (Table 6)
1) General
Aspects:
· The majority of respondents (59.4%) agree that social platforms promote sustainable approaches.
· A significant proportion (23.6%) strongly agree with this statement.
· Only a small fraction (1.3%) disagrees, and even fewer (0.9%) strongly disagree.
2) Gender
Dissimilarity:
· Agreement Levels: A higher percentage of males (60.8%) agree compared to females (58.3%). However, a larger percentage of females (27.2%) strongly agree compared to males (19.3%).
· Neutral Responses: Males are slightly more likely (16.0%) to be neutral compared to females (13.8%).
· Disagreement: All the disagreement comes from males, with 2.8% disagreeing and 0.9% strongly disagreeing. Females have no respondents who disagree, but 0.8% strongly disagree.
Conclusion
The data suggests that both male and female respondents generally perceive social platforms as promoting sustainable approaches, with a combined 83% (sum of "Strongly Agree" and "Agree") of all respondents expressing agreement. While there are some gender differences, they are relatively minor, with females slightly more likely to strongly agree and males slightly more likely to agree or be neutral. Very few respondents of either gender disagree or strongly disagree with the statement.
Table 7
|
Table 7 |
||||||
|
Count |
||||||
|
|
|
AGE OF RESPONDENTS |
Total |
|||
|
|
|
18-21 |
22-26 |
27-31 |
32- 36 |
|
|
Do social platforms promote sustainable approaches? |
STRONGLY AGREE |
46 |
9 |
20 |
35 |
110 |
|
AGREE |
165 |
37 |
31 |
44 |
277 |
|
|
NEITHER AGREE NOR DISAGREE |
28 |
8 |
19 |
14 |
69 |
|
|
DISAGREE |
3 |
3 |
0 |
0 |
6 |
|
|
STRONGLY DISAGREE |
2 |
0 |
0 |
2 |
4 |
|
|
|
244 |
57 |
70 |
95 |
466 |
|
Do social platforms promote sustainable approaches? *
AGE OF RESPONDENTS Crosstabulation (Table 7)
1) General
Aspects:
· The majority of respondents (59.4%) agree that social platforms promote sustainable approaches.
· A significant proportion (23.6%) strongly agree with this statement.
· Only a small fraction (1.3%) disagrees, and even fewer (0.9%) strongly disagree.
2) Age
Dissimilarity:
· Age 18-21: The majority (67.6%) agree, and 18.9% strongly agree. A smaller proportion is neutral (11.5%) or disagrees (1.2%).
· Age 22-26: Most respondents (64.9%) agree, and 15.8% strongly agree. There is a higher proportion neutral (14.0%) and disagreeing (5.3%) compared to other age groups.
· Age 27-31: A lower percentage (44.3%) agree, but a higher percentage strongly agree (28.6%). A significant portion is neutral (27.1%), and none disagree.
·
Age 32-36: Less than half (46.3%) agree, but the
highest percentage (36.8%) strongly agree. A smaller proportion is neutral
(14.7%), and a small percentage strongly disagree (2.1%)
Conclusion
The data suggests that younger respondents (18-21) are more likely to agree that social platforms promote sustainable approaches, with a combined 86.5% (sum of "Strongly Agree" and "Agree"). As age increases, the proportion of respondents who strongly agree also increases, particularly notable in the 32-36 age group where 36.8% strongly agree. However, agreement decreases slightly in older age groups, with a higher percentage of neutrality in the 27-31 age group. Disagreement is generally low across all age groups, with slightly higher levels in the 22-26 age group.
Overall, while there are some variations by age, the general consensus across all age groups is that social platforms are seen as promoting sustainable approaches, with agreement rates consistently high.
Table 8
|
Table 8 |
||||
|
Count |
||||
|
|
|
GENDER
OF RESPONDENTS |
Total |
|
|
|
|
FEMALE |
MALE |
|
|
Can
social media be used to bring positive changes towards sustainability |
STRONGLY AGREE |
88 |
59 |
147 |
|
AGREE |
145 |
136 |
281 |
|
|
NEITHER
AGREE NOR
DISAGREE |
17 |
12 |
29 |
|
|
DISAGREE |
4 |
5 |
6 |
|
|
Total |
254 |
212 |
466 |
|
Can social media be used to bring positive changes
towards sustainability * GENDER OF RESPONDENTS Crosstabulation (Table 8)
1) General
Aspects:
· The majority of respondents (60.3%) agree that social media can be used to bring positive changes towards sustainability.
· A significant proportion (31.5%) strongly agree with this statement.
· Only a small fraction (6.2%) is neutral, and even fewer (1.9%) disagree.
2) Gender
Dissimilarity
· Strongly Agree: A higher percentage of females (34.6%) strongly agree compared to males (27.8%).
· Agree: A slightly higher percentage of males (64.2%) agree compared to females (57.1%).
· Neutral Responses: Similar percentages of females (6.7%) and males (5.7%) are neutral.
· Disagree: A slightly higher percentage of males (2.4%) disagree compared to females (1.6%).
Conclusion
The data suggests that both male and female respondents generally believe that social media can be used to bring positive changes towards sustainability, with combined agreement rates (sum of "Strongly Agree" and "Agree") being high for both genders:
· Females: 91.7% (34.6% strongly agree + 57.1% agree)
· Males: 92.0% (27.8% strongly agree + 64.2% agree)
While there are slight differences between genders, with females more likely to strongly agree and males more likely to agree, these differences are relatively minor. Neutral and disagreement responses are low across both genders, indicating a strong consensus on the positive potential of social media for promoting sustainability.
Overall, this indicates a broad belief among both male and female respondents in the efficacy of social media as a tool for fostering sustainable practices.
Table 9
|
Table 9 |
||||||||
|
Count |
||||||||
|
|
AGE OF RESPONDENTS |
Total |
||||||
|
18-21 |
22-26 |
27-31 |
32-36 |
|||||
|
Can social media be used to bring
positive changes towards sustainability |
STRONGLY AGREE |
67 |
18 |
23 |
|
39 |
|
147 |
|
AGREE |
158 |
34 |
37 |
|
52 |
|
281 |
|
|
NEITHER AGREE OR DISAGREE |
15 |
2 |
9 |
3 |
29 |
|||
|
DISAGREE |
4 |
3 |
1 |
1 |
9 |
|||
|
Total |
244 |
57 |
70 |
95 |
466 |
|||
Can social media be used to bring positive changes
towards sustainability * AGE OF RESPONDENTS Crosstabulation (Table 9)
1) General
Aspects:
· The majority of respondents (60.3%) agree that social media can be used to bring positive changes towards sustainability.
· A significant proportion (31.5%) strongly agree with this statement.
· Only a small fraction (6.2%) is neutral, and even fewer (1.9%) disagree.
2) Age
Dissimilarity:
· Age 18-21: The majority (64.8%) agree, and 27.5% strongly agree. A small proportion is neutral (6.1%) or disagrees (1.6%).
· Age 22-26: Most respondents (59.6%) agree, and a higher percentage (31.6%) strongly agree compared to the youngest age group. A smaller proportion is neutral (3.5%) or disagrees (5.3%).
· Age 27-31: Over half (52.9%) agree, and 32.9% strongly agree. A higher percentage is neutral (12.9%) compared to other age groups, and a very small percentage disagrees (1.4%).
· Age 32-36: Over half (54.7%) agree, and the highest percentage (41.1%) strongly agree. A small proportion is neutral (3.2%) or disagrees (1.1%).
Conclusion
The data suggests that across all age groups, there is a strong belief that social media can be used to bring positive changes towards sustainability. The agreement rates (sum of "Strongly Agree" and "Agree") are high for all age groups, with the highest strong agreement seen in the 32-36 age group (41.1%).
· Younger Respondents (18-21): While the majority agree (64.8%), a smaller proportion strongly agree (27.5%) compared to older age groups.
· Mid-Age Respondents (22-26): Show slightly higher strong agreement (31.6%) and agreement (59.6%) than the youngest group.
· Older Respondents (27-31 and 32-36): Show a shift towards stronger agreement with 32.9% and 41.1% respectively, while maintaining high overall agreement levels.
Overall, this indicates a widespread belief in the efficacy of social media for fostering sustainable practices, with the strongest endorsement coming from the oldest age group surveyed (32-36)
Correlation Analysis of using social media applications
and the tendency of respondents seeing advertisements related to sustainable
lifestyle.
Table 10
|
Table 10 |
|||
|
Correlations |
|||
|
|
|
Which social platforms do you use
(YOUTUBE) |
Does the social applications inform you about advertisements related to
sustainable lifestyle (YOUTUBE) |
|
Which social
platforms do you use (YOUTUBE) |
Pearson Correlation |
1 |
.234** |
|
Sig. (2-tailed) |
|
.000 |
|
|
N |
466 |
466 |
|
|
Does the social applications inform you about
advertisements related to sustainable lifestyle (YOUTUBE) |
Pearson Correlation |
0234** |
1 |
|
Sig. (2-tailed) |
.000 |
|
|
|
N |
466 |
466 |
|
|
**. Correlation is significant at the 0.01
level (2-tailed). |
|||
This table presents the Pearson correlation between two
variables: the use of YouTube as a social platform and whether users report
being informed about advertisements related to sustainable lifestyle on
YouTube. (Table 10)
Pearson Correlation (0.234): The value of 0.234 indicates a weak positive correlation between the two variables. This means that there is a slight tendency for respondents who use YouTube to also report seeing advertisements related to sustainable lifestyle on YouTube.
The weak positive correlation (0.234) suggests that while there is some association between using YouTube and being informed about sustainable lifestyle advertisements on the platform, it is not a strong relationship.
Table 11
|
Table 11 |
|||
|
Correlations |
|||
|
|
Which social platforms do you use (WhatsApp) |
Does the social
applications inform you about
advertisements related to sustainable lifestyle (WhatsApp) |
|
|
Which social platforms
do you use (WHATSAAP) |
Pearson Correlation |
1 |
.037 |
|
Sig. (2-tailed) |
|
.424 |
|
|
N |
466 |
466 |
|
|
Does the social
applications inform you about advertisements related to sustainable lifestyle (WHATSAAP) |
Pearson Correlation |
.037 |
1 |
|
Sig. (2-tailed) |
.424 |
|
|
|
N |
466 |
466 |
|
This table presents the Pearson correlation between two
variables: the use of WhatsApp as a social platform and whether users report
being informed about advertisements related to sustainable lifestyle on
WhatsApp. (Table 11)
Pearson Correlation (0.037): The value of 0.037 indicates a very weak positive correlation between the two variables. This means there is almost no relationship between respondents using WhatsApp and being informed about sustainable lifestyle advertisements on WhatsApp.
The very weak positive correlation (0.037) suggests there is almost no association between using WhatsApp and being informed about sustainable lifestyle advertisements on the platform.
Table 12
|
Table 12 |
|||
|
Correlations |
|||
|
|
Which social platforms do you use (Instagram) |
Does the social
applications inform you about
advertisements related to sustainable lifestyle (Instagram) |
|
|
Which social platforms
do you use (Instagram) |
Pearson Correlation |
1 |
.064 |
|
Sig. (2-tailed) |
|
.170 |
|
|
N |
466 |
466 |
|
|
Does the social
applications inform you about advertisements related to sustainable lifestyle (Instagram) |
Pearson Correlation |
.064 |
1 |
|
Sig. (2-tailed) |
.170 |
|
|
|
N |
466 |
466 |
|
This table presents the Pearson correlation between two
variables: the use of Instagram as a social platform and whether users report
being informed about advertisements related to sustainable lifestyle on
Instagram. (Table 12)
Pearson Correlation (0.064): The value of 0.064 indicates a very weak positive correlation between the two variables. This means there is a slight, but almost negligible, relationship between respondents using Instagram and being informed about sustainable lifestyle advertisements on Instagram.
Very Weak Positive Correlation: The very weak positive correlation (0.064) suggests there is almost no association between using Instagram and being informed about sustainable lifestyle advertisements on the platform.
Table 13
|
Table 13 |
|||
|
Correlations |
|||
|
|
Which social platforms do you use (Facebook) |
Does
the social applications inform you about
advertisements related to sustainable lifestyle (Facebook) |
|
|
Which
social platforms do you use (Facebook) |
Pearson Correlation |
1 |
.054 |
|
Sig. (2-tailed) |
|
.248 |
|
|
N |
466 |
466 |
|
|
Does the social applications inform you about advertisements
related to sustainable lifestyle (Facebook) |
Pearson Correlation |
.054 |
1 |
|
Sig. (2-tailed) |
.248 |
|
|
|
N |
466 |
466 |
|
This table presents the Pearson correlation between two
variables: the use of Facebook as a social platform and whether users report
being informed about advertisements related to sustainable lifestyle on
Facebook. (Table 13)
Pearson Correlation (0.054): The value of 0.054 indicates a very weak positive correlation between the two variables. This means there is almost no relationship between respondents using Facebook and being informed about sustainable lifestyle advertisements on Facebook.
Sig. (2-tailed) (0.248): The significance value (p-value) is 0.248, which is greater than 0.05. This indicates that the correlation is not statistically significant. In other words, there is a high likelihood that this correlation could be due to random chance.
Table 14
|
Table 14 |
|||
|
Correlations |
|||
|
|
Which social platforms do you use
(Twitter) |
Does
the social applications inform
you about advertisements related to sustainable lifestyle (Twitter) |
|
|
Which social
platforms do you use
(Twitter) |
Pearson Correlation |
1 |
.074 |
|
Sig. (2-tailed) |
|
.112 |
|
|
N |
466 |
466 |
|
|
Does the social applications inform you about advertisements
related to sustainable lifestyle (Twitter) |
Pearson Correlation |
.074 |
1 |
|
Sig. (2-tailed) |
.112 |
|
|
|
N |
466 |
466 |
|
This table presents the Pearson correlation between two
variables: the use of Twitter as a social platform and whether users report
being informed about advertisements related to sustainable lifestyle on
Twitter. (Table 14)
Pearson Correlation (0.074): The value of 0.074 indicates a very weak positive correlation between the two variables. This means there is almost no relationship between respondents using Twitter and being informed about sustainable lifestyle advertisements on Twitter.
Sig. (2-tailed) (0.112): The significance value (p-value) is 0.112, which is greater than 0.05. This indicates that the correlation is not statistically significant. In other words, there is a high likelihood that this correlation could be due to random chance.
Table 15
|
Table 15 |
||||||
|
$social
influence*Education Crosstabulation |
||||||
|
|
EDUCATION
OF THE RESPONDENTS |
|||||
|
|
12th
OR BELOW |
GRADUATE |
POSTGRADUATE |
DOCTORATE |
||
|
|
||||||
|
|
The
health products that we buy are greatly influenced by social media platform
(HEALTH) |
Count |
17 |
53 |
33 |
8 |
|
Different Goalsa |
Social
media platform is a better, cheaper and effective mode of education (EDUCATION) |
Count |
40 |
108 |
83 |
14 |
|
|
Social
media highly influenced the basic elements of sustainable communities such as
clean air & water, economic security, safe & healthy housing
(SUSTAINABLE COMMUNITIES) |
Count |
29 |
82 |
54 |
9 |
|
|
Raising
the voice for environmental issue on social platform influence (CLIMATE
CHANGE) |
Count |
35 |
85 |
60 |
8 |
|
Total |
|
Count |
49 |
147 |
100 |
17 |
|
Percentages and totals
are based on respondents. |
||||||
|
a. Dichotomy group
tabulated at value 1. |
||||||
This table presents the crosstabulation of respondents'
education levels and their agreement with different statements about social
media's influence in various areas. (Table 15)
1) General
Aspects:
· Social media is seen as a better, cheaper, and effective mode of education by the majority of respondents across all education levels (78.0% overall).
· The influence of social media on purchasing health products and raising environmental issues is also significant, but slightly lower compared to its role in education.
· The perception of social media's impact on sustainable communities varies more, with 56.3% of respondents overall acknowledging its influence.
2) Education
Level Differences:
· Health Products: Higher agreement among respondents with a Doctorate (47.1%) and Professional (50.0%) education levels compared to other groups.
· Education: Very high agreement across all education levels, particularly among Postgraduate (83.0%) and Doctorate (82.4%) respondents.
· Sustainable Communities: Higher agreement among respondents with Professional education (80.0%), with slightly lower agreement in other groups.
· Climate Change: The highest agreement is seen among respondents with education levels 12th or below (71.4%) and Professional (60.0%), with lower but still significant agreement among other groups.
Conclusion
The data suggests that social media is widely perceived as influential across various aspects such as health products, education, sustainable communities, and climate change advocacy. This perception varies somewhat with education level:
· Highly educated respondents (Doctorate and Professional) tend to see social media as particularly influential in health product purchases and sustainability issues.
· Less educated respondents (12th or below) are more likely to see social media as a powerful tool for environmental advocacy.
· Overall, the role of social media in promoting positive changes, particularly in education and sustainability, is recognized across all education levels, with slight variations in the degree of perceived influence.
6. DISCUSSION AND CONCLUSION
There is a weak but statistically significant positive correlation between the use of YouTube, WhatsApp, Instagram, Facebook Twitter, and the likelihood of being informed about sustainable lifestyle advertisements on the platform. This suggests some level of effectiveness in using all these platforms for promoting sustainable lifestyle advertisements, but other factors should also be considered to enhance the reach and impact of such advertisements. However, marketers might need to consider other factors or platforms to effectively promote sustainable lifestyle advertisements. Therefore, the results what we have concluded is using these applications for respondents may have different other reasons to indulge, despite off being considered as a mode of collecting information about sustainable goals. Here we can also say that social application has its effective impact on different respondents, the data suggests that both male and female respondents generally perceive social platforms as promoting sustainable approaches, with a combined 83% (sum of "Strongly Agree" and "Agree") of all respondents expressing agreement. While determining how much users use social media for collecting information about sustainable goals the finding shows that YouTube is the dominant platform for all themes basically for quality education. Whereas WhatsApp and Instagram notably for getting informed about communities related issues like basic amenities, how to make sustainable community. Here App like Facebook also use for quality education and health related issues. According to data overall like hood captured by YouTube which has highest number of respondents 159, and rest covered by Instagram and Facebook. If we talk about male and female then (Female tend to report seeing advertisement related to sustainable goals more frequently than males on most social media platform except Twitter. This study also suggest that younger respondents (18-21) are more likely to agree that social platforms promote sustainable approaches, with a combined 86.5%, As age increases, the proportion of respondents who strongly agree also increases, particularly notable in the 32-36 age group where 36.8% strongly agree. However, agreement decreases slightly in older age groups, with a higher percentage of neutrality in the 27-31 age group. Same with the age group there is a strong belief that social media can be used to bring positive changes towards sustainability. The agreement rates (sum of "Strongly Agree" and "Agree") are high for all age groups, with the highest strong agreement seen in the 32-36 age group (41.1%). Overall, this indicates a widespread belief in the efficacy of social media for fostering sustainable practices, with the strongest endorsement coming from the oldest age group surveyed (32-36). Making this study more fruitful and reliable we did Pearson correlation between two variables: the use of social application and whether respondents saw advertisements related to sustainable goals, however with the overall analysis we found that each individual platform has weak positive correlation like a) there is a slight tendency for respondents who use YouTube to also report seeing advertisements related to sustainable lifestyle on YouTube. B) There is almost no relationship between respondents using WhatsApp and being informed about sustainable lifestyle advertisements on WhatsApp. C) There is a slight, but almost negligible, relationship between respondents using Instagram and being informed about sustainable lifestyle advertisements on Instagram. D) There is almost no relationship between respondents using Facebook and being informed about sustainable lifestyle advertisements on Facebook. E) There is almost no relationship between respondents using Twitter and being informed about sustainable lifestyle advertisements on Twitter. This study also represents the crosstabulation of respondents' education levels and their agreement with different statements about social media's influence in various areas. The findings show social media is seen as a better, cheaper, and effective mode of education by the majority of respondents across all education levels (78.0% overall), the influence of social media on purchasing health products and raising environmental issues is also significant, but slightly lower compared to its role in education, the perception of social media's impact on sustainable communities varies more, with 56.3% of respondents overall acknowledging its influence. The usage of social media application can be in the mass medium, marketing, advertising, promotion and motivating students for educating towards sustainable living. An organization has varied functional departments. The social media application can be used in those functional departments to sustain the goals of sustainability in the organization. The most likely and famous social media tool is YouTube. It provided the flexibility to share videos, audios, text, advertisements, or we can say that all activities on a single platform about sustainability. The social media also minimizes the usage of paper in the organizations.
CONFLICT OF INTERESTS
None.
ACKNOWLEDGMENTS
None.
REFERENCES
Alfonso Piscitelli, A. M. (2022). Do Young People Really Engage in Sustainable Behaviour in Their Lifestyle. Social Indicators Research, 1467-1485. https://doi.org/10.1007/s11205-022-02955-0
Anonymous. (2024, April Saturday). What is Social Media. Retrieved from Economictimes. Indiatimes.Com.
Anuj Kumar, R. A. (2018). Sustainable Development
Through Social Media Tools. Journal of Management,
47-51.
Chaudhary, A. (2016). Role of Social Media to Empower
Youth-Challenges and Opportunities.
Clayton Burger, B. S. (2014). The Use of Social Media as an Enabler to Create
Environmental Awareness of
Staff in Higher Education. 28th EnviroInfo
2014 Conference. Oldenburg.
Fadi Kotob MPM, B. A. (2011). What is Sustainability.
Hanan Esmaeel AI Sheikh, F. A. (2022). Role of Digital Media in Achieving Sustainable Development in the Arab World. Saudi Journal of Humanities and Social Science, 177-187. https://doi.org/10.36348/sjhss.2022.v07i05.002
Lewis Akenji,
H. C. (2016). A Framework for Shaping
Sustainable Lifestyle. U.K: UNEP.
Michaellsbell. (2024, May Monday). Facebook.
Oommen, B. E. (2020). Impact of Social Media on Sustainable Development. International Journal of Science and Research.
Soetermans. (2024, May 03). Instagram.
Sustainability, M. (2012). What is Sustainability.
Thomas Aichner, M. G. (2021). Twenty Five Year of Social Media: A Review of Social Media Applications and Definitions from 1994 to 2019. PubMed Central, 215-222. https://doi.org/10.1089/cyber.2020.0134
Tom Kuhlman, J. F. (2010). What is Sustainability. MDPI, 3436-3448. https://doi.org/10.3390/su2113436
 This work is licensed under a: Creative Commons Attribution 4.0 International License
© Granthaalayah 2014-2024. All Rights Reserved.