EFFECT OF CALCINATION TEMPERATURE VARIATION ON GREEN SYNTHESIS OF CADMIUM SULFIDE FOR CIPROFLOXACIN PHOTODEGRADATION
Aminatul Haq Faizah 1, Gunawan 1 ![]()
![]() ,
Khabibi 1, Roni Adi Wijaya 1
,
Khabibi 1, Roni Adi Wijaya 1
1 Department
of Chemistry, Diponegoro University, Semarang, 50275, Indonesia
|
|
|
ABSTRACT |
|
|
The green
synthesis method has been successfully carried out to CdS with tea leaf
extract and calcination temperature variation for the application of
photocatalytic degradation of ciprofloxacin antibiotic. Variations in
calcination at temperatures of 500, 600, and 700 ℃ were carried out to
determine the effect of temperature on morphology and elemental composition,
crystal structure and size, functional groups, and band gap energy by
SEM-EDX, XRD, FTIR, and UV-DRS Spectrophotometer. The SEM-EDX image of the
synthesized CdS is smooth and spherical and there is agglomeration with an
even distribution of elements. The results of XRD and FTIR characterization
showed the CdS peaks. The size of the CdS crystal increased with increasing
temperature, namely CdS-600 at 64 nm and CdS-700 at 81.58 nm. The band gap
energy value is influenced by the calcination temperature during synthesis
with the band gap energy values of CdS-600 2.3 eV and CdS-700 2.38 eV. The
percentage of CdS effectiveness with variations in calcination temperature in
ciprofloxacin photodegradation is CdS-500 at 32.18%, CdS-600 at 48.72%, and
CdS-700 at 8.73%. The optimum condition of CdS synthesis in degrading
ciprofloxacin by photocatalytic process occurs at a temperature of 600℃
with a photocatalytic irradiation time under visible light for 120 minutes, a
CdS mass of 10 mg, and an initial concentration of ciprofloxacin of 25 ppm.
This result demonstrates the potential of an environmentally friendly method
that can be applied in wastewater treatment. |
|||
|
Received 22 April
2024 Accepted 27 May 2024 Published 30 June 2024 Corresponding Author Gunawan, gunawan@live.undip.ac.id DOI 10.29121/granthaalayah.v12.i6.2024.5681 Funding: This research
received no specific grant from any funding agency in the public, commercial,
or not-for-profit sectors. Copyright: © 2024 The
Author(s). This work is licensed under a Creative Commons
Attribution 4.0 International License. With the
license CC-BY, authors retain the copyright, allowing anyone to download,
reuse, re-print, modify, distribute, and/or copy their contribution. The work
must be properly attributed to its author.
|
|||
|
Keywords: Cadmium Sulfide, Green Synthesis,
Calcination, Photocatalytic, Ciprofloxacin |
|||
1. INTRODUCTION
Ciprofloxacin (CIP) is a third-generation fluoroquinolone antibiotic, which is widely used to treat bacterial infections due to its broad spectrum of antibacterial activity (i.e., it can inhibit both gram-negative and gram-positive bacteria). On the other hand, excessive use of CIP can pose a serious threat to the ecosystem such as antibiotic resistance Kelly & Brooks (2018), Mathur et al. (2021). Consumption of water contaminated by ciprofloxacin in the environment can cause health problems such as vomiting, headaches, diarrhoea, skin disorders, and the immune system Gunawan et al. (2023), Shehu Imam et al. (2018). Organic contamination in waters originating from the pharmaceutical industry often contains toxic pollutants with low biodegradability Barra Caracciolo et al. (2015), Chopra & Kumar (2017), Dsikowitzky & Schwarzbauer (2014), so an efficient method is needed to overcome this problem.
Various methods are carried out to overcome organic pollutants in waters such as bioremediation and coagulation-flocculation followed by the activated sludge biological process Kumar et al. (2023), Majumder et al. (2014). This method still has shortcomings compared to photocatalytic. The semiconductor photocatalytic method is considered one of the promising methods for CIP degradation in water because it is environmentally friendly, has low energy consumption, low cost, and has no secondary pollutants Zhao et al. (2021), Zhao et al. (2021). Another advantage is that the photocatalytic reaction is a non-specific reaction, meaning it can destroy organic compounds widely ranging from alkanes, alkenes, alcohols, phenols, carboxylic acids, aromatic compounds, dyes, pesticides, to surfactants. In addition, photocatalysis can degrade organic compounds because it has a very strong oxidation power Akerdi & Bahrami (2019).
The photocatalytic activity comes from a hydroxyl radical resulting from an electron-hole pair (e-/h+), an electron-hole pair e-/h+ is produced when the photon energy exceeds the band gap value, electrons (e-) then settle in the conduction band (CB) after leaving their place in the valence band (VB) producing holes (h+) in the valence band Gunawan et al. (2023), Verma & Singh (2023). Photocatalytic activity depends on semiconductor characteristics, where the photocatalytic properties can be modified through the techniques and methods used for synthesis to control particle size and shape.
Cadmium sulfide (CdS) is a semiconductor compound with a band gap of 2.4 eV which is suitable and excellent in photocatalytic activity due to its visible light absorption feature. The photocatalytic activity of CdS is influenced by the synthesis conditions, structure, morphology, particle size, surface area, and crystallinity Lang et al. (2014). CdS displays efficient visible light absorption at wavelengths up to 530 nm Shen et al. (2013). CdS is easy to synthesize, one of which is by the green synthesis method.
The synthesis of cadmium sulfide by the green synthesis method is now starting to be developed because it is cost-effective, harmless, and environmentally friendly. Several biological entities that can play a role in the green synthesis method to produce nanoparticles include algae, fungi, microbes, actinomycetes, and plant extracts. Each of these agents has its advantages. Compared to other agents, tea extract used as a component in green synthesis acts as a complexing agent that regulates the size of cadmium sulfide in the form of more stable nanoparticles Shivaji et al. (2018).
Efforts to increase the photocatalytic effectiveness of semiconductors can be calcined to increase light absorption and charge separation processes during the reaction. Increasing the calcination temperature will affect the increase in crystal size. In addition, heating with high temperature can also affect the band gap energy so that it can increase photocatalytic activity Asadah et al. (2022). Therefore, in this study, the synthesis of green semiconductor CdS with tea leaf extract with calcination temperature variation was carried out for the application of photocatalytic degradation of ciprofloxacin antibiotic. Calcination variations at 500, 600, and 700 °C were carried out to determine the effect of temperature on crystal size, crystallinity, and band gap energy. Morphology and elemental composition, crystal structure and size, functional groups, and band gap energy of the synthesized CdS were characterized by SEM-EDX, XRD, FTIR, and UV-DRS spectrophotometer. The results of this study are expected to provide new insights into developing more efficient and environmentally friendly photocatalysts for wastewater treatment applications.
2. EXPERIMENTS
2.1. MATERIALS AND INSTRUMENTS
Trade tea powder, Cadmium sulfate octahydrate (3CdSO4.8H2O) (Merck), sodium sulfide (Na2S) (Loba Chemie), methanol (Merck), deionized water (Waterone), acetone, distilled water, ciprofloxacin (Sigma Aldrich). The instruments used are glassware (Herma), filter paper (Whatman no.42 ), 1 mL volume pipette (Iwaki), analytical balance (Ohaus, Model PA323), oven, furnace (Nabertherm), hotplate (Thermo Scientific Cimarec), centrifuge (Hettich Zentrifugen), photocatalytic reactor with visible light (Vaco IP 66, 200 W), UV-Vis spectrophotometer (Shimadzu UV-1280), UV-DRS spectrophotometer (Shimadzu UV-2450), Scanning Electron Microscope (JSM-6510LA), Energy Dispersion X-Ray Spectroscopy (JED-2300 Analysis Station Plus), X-Ray Diffraction (Shimadzu 7000), and FTIR Spectrophotometer (PerkinElmer Frontier).
2.2. Green synthesis of Cadmium sulfide
The synthesis was carried out by dissolving 3.848 grams of 3CdSO4.8H2O and 0.39 grams of Na2S each in a 10 mL volumetric flask using distilled water to obtain a solution of 0.5 M CdSO4 and 0.5 M Na2S. The solution was stored in vials for further use. 0.5 grams of tea powder was mixed in 30 mL of methanol and left in the dark for 1 day, after 1 day filtering was done to separate the tea precipitate from the solution. The extract was added to 2 mL of 0.5 M CdSO4 solution and left in the dark for 3 days, followed by the addition of 0.5 mL of 0.5 M Na2S solution and left in the dark for 4 days. The precipitate was washed with deionized water and centrifuged at 6000 rpm for 10 minutes then dried on a hotplate at 70℃.
2.3. Determination of temperature Calcination variation
The calcination process was carried out at temperature variations of 500, 600, and 700 °C for 2 hours each, which were then named CdS-500; CdS-600; and CdS-700. The process started by putting the samples into a vacuum furnace instrument at a constant time for 60 minutes.
2.4. Characterization
The synthesized CdS samples were characterized using a Scanning Electron Microscope-Energy Dispersive X-ray (SEM-EDX) instrument to determine the morphology and elemental composition. Meanwhile, X-ray diffraction (XRD) to determine the crystal structure and a UV-DRS Spectrophotometer to determine the band gap. In addition, the difference in functional groups of CdS was observed by Fourier Transform Infrared (FTIR).
2.5. Photocatalytic test
Photodegradation applications were carried out with 100 mL of 25 ppm ciprofloxacin solution added with 10 mg of CdS semiconductor catalyst and mixed in dark conditions for 1 hour to achieve adsorption-desorption equilibrium. It was illuminated with visible light and stirred with a magnetic stirrer at time intervals of 15; 30; 45; 60; 75; 90; 105; and 120 minutes. The solution was centrifuged at 5000 rpm for 5 minutes before measuring the absorbance of ciprofloxacin solution after photocatalytic with UV-Vis spectrophotometer at 319 nm wavelength.
3. RESULT AND DISCUSSION
3.1. Green synthesis of CdS
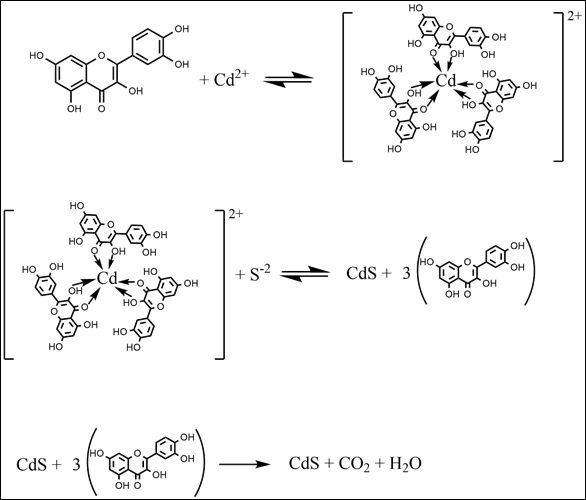
The synthesis of green CdS was carried out using tea leaves that had previously been tested for flavonoids with the results in 0.01 g of tea containing 0.41% flavonoid quercetin. Predicted reactions that occur in the mechanism of green cadmium sulfide synthesis are described in Figure 1. Phytochemical screening is carried out first to determine the presence or absence of alkaloids, flavonoids, phenols, tannins, quinones, saponins, etc. Quercetin can chelate metal ions (Cd2+) to form metal complexes Dolatabadi (2011). The cadmium complex with quercetin is formed by the way quercetin acts as a capping agent which then can also protect Cd from bulk and against aggregation so that when the addition of S-2 ions from Na2S can form nano-sized CdS crystals Zhou et al. (2014).
Figure 1
|
Figure 1 CdS Formation Reaction by Green Synthesis Method |
3.2. CHARACTERIZATION
3.2.1. MORPHOLOGY AND ELEMENTAL COMPOSITION
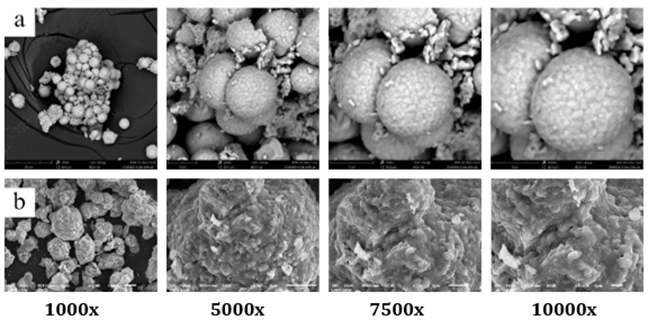
The semiconductor catalysts that were characterized
were CdS powder calcined at 600 ℃ and 700 ℃ while SEM images at
1000x, 5000x, 7500x, and 10000x magnifications are given in Figure 2. Based on the SEM
characterization results of the CdS-600 sample at 5000x magnification, it can be seen that the morphology of the particles is
smooth and round and there is agglomeration. The CdS-700 sample SEM
characterization results at 1000x magnification showed a less smooth spherical
change with non-uniform size and agglomeration. The spherical morphology and
small particle size are expected that the synthesized cadmium sulfide has good
photocatalytic activity. In the case of biogenic synthesis based on plant
extracts, nanoparticles are generally formed that are very stable and
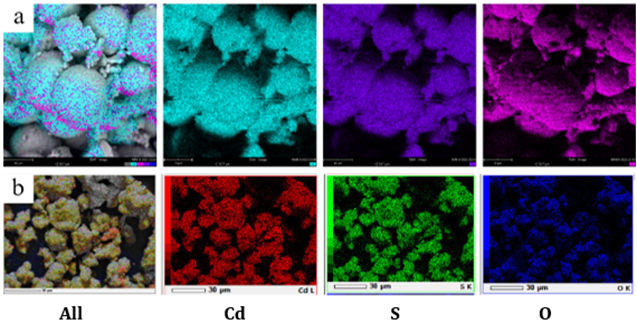
homogeneous in shape Shivaji et al. (2018). In addition, Figure 3 is the result of mapping or
elemental distribution of samples tested with the different colouring of each
element. Both CdS-600 and CdS-700 samples have an even distribution of
elements.
Figure 2
|
Figure 2 SEM Morphology of a) CdS-600 b) CdS-700 |
Figure 3
|
Figure 3 Surface Metal Mapping of a) CdS-600 b) CdS-700 |
The
EDX analyzer results of both samples prove that there are elements of the
constituent elements of cadmium sulfide, namely Cd and S, so it can be
concluded that cadmium sulfide has been synthesized properly as shown in Table 1. The CdS-600 sample contained
the element C which was thought to come from the carbon tab used to attach the
sample during EDX testing. The O element that appears with a large enough
percentage is caused by air during the calcination process. The presence of
additional oxygen peaks in the EDX spectra may come from the organic capping
material i.e. tea extract bound to the surface. Another possibility for the
presence of elemental oxygen is due to calcination occurring in atmosphere
conditions. Shivaji et al. (2018).
Table 1
|
Table 1 Shows the Atomic Element Content on the Surface of Each CdS Sample |
||
|
Sample |
Element |
Weight Concentration (%) |
|
CdS 600 |
Cd |
48,18 |
|
O |
38,23 |
|
|
S |
9,47 |
|
|
C |
4,13 |
|
|
|
Cd |
44,41 |
|
CdS 700 |
S |
11,53 |
|
|
O |
44,06 |
3.2.2. CRYSTALLINITY ANALYSIS
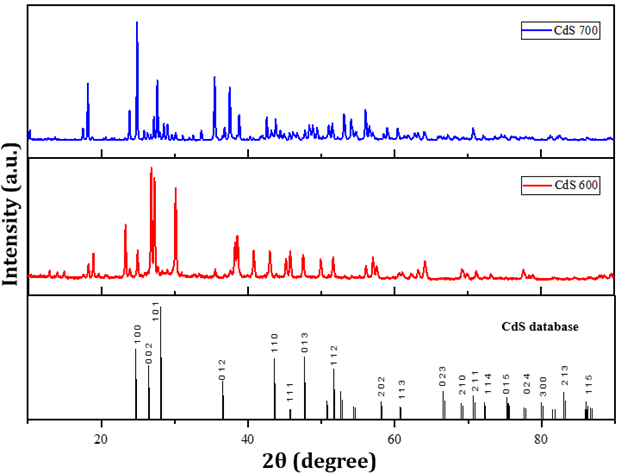
To examine the crystal size
and phase structure, XRD testing of CdS nanoparticle structures prepared by
green synthesis at different temperatures was carried out. The test was
conducted using Kα radiation from a copper anode (Cu- Kα) with a wavelength
of 0.154 nm and recorded at a diffraction angle of 2θ between 10-90°. The
diffractogram of the measurement results in the form of diffraction peaks with
a certain intensity was then compared with the standard data obtained from
Crystallography Open Database (COD) No. 1011054 shown in Figure 4.
Figure 4
|
Figure 4 XRD Spectrum CdS-600 dan CdS-700 |
The XRD pattern results of
the measured samples show that cadmium sulphide (CdS) has been formed which is
characterised by the formation of diffraction peaks with high intensity, this
proves that the crystallinity of the synthesised CdS sample is quite good Asadah et al. (2022). Diffractogram peaks with the highest
intensity of CdS-600 and CdS-700 samples are shown in Table 2. The peak intensity of the diffractogram
increases with increasing synthesis temperature, The increase in the intensity
of various peaks indicates better crystallinity which leads to a decrease in
the strain value and dislocation density Chauhan (2020). The synthesised CdS has a crystal phase with
a p-63mc space group, which is hexagonal. To maintain excellent optoelectronic
properties, CdS must remain in the hexagonal wurtzite structure Xiao et al. (2014). The crystal size was calculated based on the Full Width at
Half Maximum (FWHM) values at various peaks with the Debye-Scherrer equation
(1) Gunawan et al. (2022).
![]() (1)
(1)
Where
G is the crystal size, k = 0.9 is the formation factor, λ is the
wavelength of the CuKα line, D is the FWHM in radians, and θ is the
Bragg angle.
The
crystal size increases with increasing synthesis temperature, the crystal size
of CdS-600 is 64 nm to CdS-700 of 81.58 nm and it can be concluded that the
synthesized CdS includes nanoparticles. Crystal grains undergo a growth process
when CdS is calcined. If the temperature used is a temperature that exceeds the
optimum temperature, the crystals will be larger. If the temperature used is
below the optimum temperature, it is possible that the expected crystals have
not formed or even formed but are not pure Aprilianingrum (2016). The higher calcination
temperature causes the crystal size and per cent crystallinity to be greater.
This is because high temperatures make particles move more reactive and faster
than low temperatures and result in agglomeration Asadah
et al. (2022).
Table 2
|
Table 2 XRD Result Analysis of CdS-600 and CdS-700 |
|||
|
Sample |
2 |
h k l |
d
(nm) |
|
24,95 |
(1 0 0) |
43,74 |
|
|
26,44 |
(0 0 2) |
40,23 |
|
|
CdS-600 |
28,28 |
(1 0 1) |
64,00 |
|
45,79 |
(1 1 1) |
39,02 |
|
|
47,53 |
(0 1 3) |
38,58 |
|
|
51,62 |
(1 1 2) |
37,87 |
|
|
24,88 |
(1 0 0) |
81,35 |
|
|
26,29 |
(0 0 2) |
81,58 |
|
|
CdS-700 |
27,99 |
(1 0 1) |
48,16 |
|
43,47 |
(1 1 0) |
37,84 |
|
|
47,79 |
(0 1 3) |
77,66 |
|
|
51,51 |
(1 1 2) |
66,31 |
|
3.2.3. BAND GAP DETERMINATION
Determination
of the band gap of each CdS sample that has been synthesized is done by UV-DRS
characterization, where data will be obtained in the form of absorbance,
reflectance, and wavelength. Band gap calculation can use the tauc plot method
and the absorbance edge method. Cadmium sulfide is a semiconductor so the
calculation of the tauc plot method is done by extrapolating from the graph of
the relationship between transmittance (αhv2) to band gap
energy (eV) then forming a straight line to the x-axis (hv) Asadah et al. (2022). The band gap energy graph is
shown in Figure 5.
Figure 5
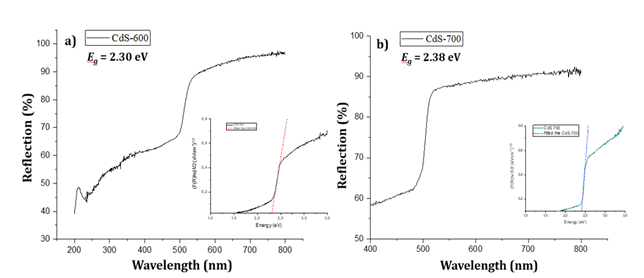
|
Figure 5 UV-DRS Result Graph of Tauc Plot Method a) CdS-600 and b) CdS-700 |
Figure 5 shows that the calcination
temperature during synthesis affects the band gap energy. The band gap value of
CdS-600 is 2.30 eV while the CdS-700 band gap energy is 2.38 eV. Crystal
formation is accelerated by the calcination temperature, which allows agglomeration
to occur. The shift in absorption can be affected by agglomeration which causes
a change in the Eg (band gap energy) value Asadah et al. (2022). The smaller the band gap, the
lower the energy required to excite electrons. As a result, the light
adsorption of the sample is greater. Increased light adsorption offers better
opportunities for photocatalytic applications Asadah et al. (2022).
3.2.4. FUNCTIONAL GROUP ANALYSIS
The
peak spectra for the two cadmium sulfide samples, CdS-600 and CdS-700, did not
show significant peak shifts, proving that the change in calcination
temperature did not affect the functional groups. The absorption peak at 3061
cm-1 corresponds to the stretching vibration of hydroxyl group (O-H)
adsorbed on the catalyst surface. The absorption peak at 1550 cm-1
indicates the presence of C=O asymmetry stretching vibration. Peaks at 1174 cm-1;
1175 cm-1; 1070 cm-1; and 1057 cm-1 are
related to C=S stretching vibrations derived from sulfide compounds and C-O Kumar & Sharma (2016). Other absorption peaks at 880
cm-1 and 883 cm-1 are out-of-plane bending vibrations of
O-H from H2O molecules Kumar & Sharma (2016). Typical absorption peaks of
Cd-S bond stretching vibrations were observed at peaks below 700 cm-1
namely 585, 588, 650, and 652 cm-1 Munyai et al. (2021), Bakhsh & Khan (2022). These results indicate that
tea leaf extract has a good effect in stabilizing CdS nanoparticles.
Figure 6
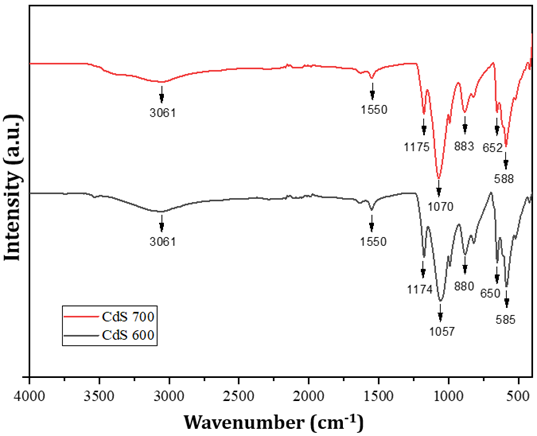
|
Figure 6 FTIR Spectrum CdS-600 (Black Line) and CdS-700 (Red Line) |
3.3. Application of CdS for ciprofloxacin photodegradation
The
photocatalytic degradation in Figure 7 shows that the variation of
calcination temperature in the synthesis of cadmium sulfide affects the
photocatalytic quality. The three variations of CdS show that the longer the
irradiation time of the photocatalyst, the higher the percentage of degradation.
This is due to the more energy the electrons get to excite to produce hydroxy
radicals. The increasing number of hydroxy radicals will increase the
bond-breaking process in organic pollutants, namely ciprofloxacin and is
characterized by a decrease in the absorbance of ciprofloxacin Kumar & Sharma (2016).
The
degradation of ciprofloxacin by CdS-500 to CdS-600 increased and decreased at
CdS-700. The decreased photocatalytic activity can be caused by precipitation
on the catalyst during photocatalysis so that there are parts of the catalyst
surface that do not absorb photons or ciprofloxacin compounds optimally.
Another possibility is that CdS-700 is affected by a decreased surface area. A
large surface area will provide more active sites that not only react with
absorbed water and hydroxyl to form oxidative hydroxyl radicals but also
organic molecules for photodegradation. Generally, the specific surface area
increases with decreasing crystal size Cheng et al. (2014) (this is supported by CdS
crystal size data by XRD).
The
best degradation percentages of each sample namely CdS-500; CdS-600; and
CdS-700 were 32.18%; 48.72%; and 8.73%, respectively. The optimum condition of
CdS synthesis in photocatalytic degradation of ciprofloxacin in this study
occurred at a temperature of 600 ℃ with a CdS mass of 10 mg, irradiation
time for 120 minutes and ciprofloxacin concentration of 25 ppm. The
photocatalytic degradation test was carried out to see how effective the
photocatalyst activity of the synthesized CdS was in degrading ciprofloxacin at
various photocatalytic times.
Figure 7
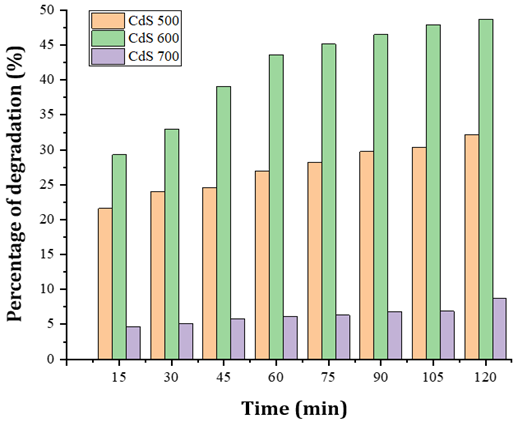
|
Figure 7 Graph of Degradation Percentage of Ciprofloxacin 25 ppm 100 mL Using CdS 10 mg for Variations of CdS-500; CdS-600; and CdS-700 Against Time. |
3.4. Reaction kinetics of the photocatalytic process
Pseudo reaction order is
determined by making a graph between the concentration of ciprofloxacin at time
t (Ct) against time. A pseudo-first-order reaction is a graph
between ln initial ciprofloxacin concentration (C0) divided by
ciprofloxacin concentration at time t against time. While pseudo-second order
is a graph between (1/Ct) - (1/C0) against time. From the
calculation of the reaction order, R2 data were obtained for each
CdS calcination temperature variation which followed the second-order pseudo
kinetics. The kinetics curve of ciprofloxacin degradation by cadmium sulfide at
various calcination temperatures is shown in Figure 8. Based on the figure, explains
that the rate of photocatalytic degradation of ciprofloxacin is the highest on
CdS-600. It was found that the reaction rate constants for CdS-500; CdS-600;
and CdS-700 were 4 x 10⁻⁴; 11x10-4; and 8x10⁻⁵
mg-1Lmin-1, respectively. The value of the reaction rate
constant depends on several factors, in this study is the initial concentration
of ciprofloxacin Usman et al. (2021).
Figure 8
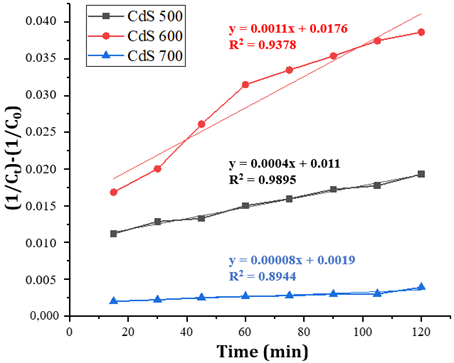
|
Figure 8 Kinetic Curve of Ciprofloxacin Degradation |
4. CONCLUSION
Cadmium sulfide has been successfully synthesized via the green synthesis method with various calcination temperature variations for ciprofloxacin photocatalytic degradation applications. XRD and FTIR characterization results display CdS peaks. SEM-EDX image of the synthesized CdS is smooth round and there are agglomerations with an even distribution of elements. The band gap energy value is influenced by the calcination temperature obtained by CdS-600 of 2.3 eV and CdS-700 of 2.38 eV. Calcination temperature variations affect the size of CdS crystals formed and their band gap energy. Increasing the calcination temperature gives a larger crystal size but the energy of the pit gap increases due to agglomeration which results in a shift in the energy of the band gap. The effectiveness of cadmium sulfide in degrading ciprofloxacin was shown in CdS-600 with a result of 48.72%, CdS-500 at 32.18%, and CdS-700 at 8.73%. Photocatalytic optimal conditions under visible light for 120 minutes with 10 mg of CdS catalyst and an initial ciprofloxacin concentration of 25 ppm. This shows the potential of developing an environmentally friendly antibiotic waste treatment method.
CONFLICT OF INTERESTS
None.
ACKNOWLEDGMENTS
None.
REFERENCES
Akerdi, A. G., & Bahrami, S. H. (2019). Application of Heterogeneous Nano-Semiconductors for Photocatalytic Advanced Oxidation of Organic Compounds: A Review. Journal of Environmental Chemical Engineering, 7(5). https://doi.org/10.1016/J.JECE.2019.103283
Aprilianingrum, F. A. (2016). Optimasi Dan Regenerasi Fotokatalis Ca. Universitas Negeri Yogyakarta.
Asadah, E., Hadisantoso, E. P., Soni Setiadji, D., Kimia, J., Sains, F., Teknologi, D., Gunung, S., Bandung, D., Nasution, J. A. H., 105 A, N., Cibiru, C., & Jawa Barat, B. (2022). Pengaruh Suhu Kalsinasi Terhadap Sintesis Kadmium Sulfida (Cds) Menggunakan Metode Presipitasi untuk Penanganan Metilen Biru Secara Fotokatalisis. Gunung Djati Conference Series, 7, 60–69.
Bakhsh, E. M., & Khan, M. I. (2022). Clove Oil-Mediated Green Synthesis of Silver-Doped Cadmium Sulfide and Their Photocatalytic Degradation Activity. Inorganic Chemistry Communications, 138(November 2021). https://doi.org/10.1016/j.inoche.2022.109256
Barra Caracciolo, A., Topp, E., & Grenni, P. (2015). Pharmaceuticals in the Environment: Biodegradation and Effects on Natural Microbial Communities. A review. Journal of Pharmaceutical and Biomedical Analysis, 106, 25–36. https://doi.org/10.1016/J.JPBA.2014.11.040
Chauhan, J. K. R. P. (2020). Effect of Temperature on Properties of Cadmium Sulfide Nanostructures Synthesized by Solvothermal method. Journal of Materials Science: Materials in Electronics. https://doi.org/10.1007/s10854-019-02807-7
Cheng, H., Wang, J., Zhao, Y., & Han, X. (2014). Effect of Phase Composition, Morphology, and Specific Surface Area on the Photocatalytic Activity of TiO2 Nanomaterials. RSC Advances, 4(87), 47031–47038. https://doi.org/10.1039/C4RA05509H
Chopra, S., & Kumar, D. (2017). Ibuprofen as an Emerging Organic Contaminant in Environment, Distribution and Remediation. https://doi.org/10.1016/j.heliyon.2020.e04087
Dolatabadi, J. E. N. (2011). Molecular Aspects on the Interaction of Quercetin and its Metal Complexes with DNA. International Journal of Biological Macromolecules, 48(2), 227–233. https://doi.org/10.1016/J.IJBIOMAC.2010.11.012
Dsikowitzky, L., & Schwarzbauer, J. (2014). Industrial Organic Contaminants: Identification, Toxicity and Fate in the Environment. Environmental Chemistry Letters, 12(3), 371–386. https://doi.org/10.1007/S10311-014-0467-1/METRICS
Gunawan, Adi Wijaya, R., Suseno, A., Lusiana, R. A., Septina, W., & Harada, T. (2023). Synthesis of CuInS2 thin Film Photocathode with Variation of Sulfurization Sources and Pt-In2S3 Modification for Photoelectrochemical Water Splitting. Journal of Electroanalytical Chemistry, 945. https://doi.org/10.1016/J.JELECHEM.2023.117683
Gunawan, G., Megawati, S. G. L., Prasetya, N. B. A., & Wijaya, R. A. (2022). Synthesis, Characterization of Ag2s from AgCl Waste of Argentometry Titration with Heating Temperature Variations and Its Application as a Temperature Sensor Based on Negative Temperature Coefficient (NTC). Jurnal Kimia Sains Dan Aplikasi, 25(8), 292–299. https://doi.org/10.14710/JKSA.25.8.292-299
Gunawan, G., Prasetya, N. B. A., & Wijaya, R. A. (2023). Degradation of Ciprofloxacin (CIP) Antibiotic Waste using The Advanced Oxidation Process (AOP) Method with Ferrate (VI) from Extreme Base Electrosynthesis. Trends in Sciences, 20(7). https://doi.org/10.48048/TIS.2023.6639
Kelly, K. R., & Brooks, B. W. (2018). Global Aquatic Hazard Assessment of Ciprofloxacin: Exceedances of Antibiotic Resistance Development and Ecotoxicological Thresholds. Progress in Molecular Biology and Translational Science, 159, 59–77. https://doi.org/10.1016/BS.PMBTS.2018.07.004
Kumar, R. N., Sadaf, S., Verma, M., Chakraborty, S., Kumari, S., Polisetti, V., Kallem, P., Iqbal, J., & Banat, F. (2023). Old Landfill Leachate and Municipal Wastewater Co-Treatment by Sequencing Batch Reactor Combined with Coagulation–Flocculation Using Novel Flocculant. Sustainability (Switzerland), 15(10), 8205. https://doi.org/10.3390/SU15108205/S1
Kumar, S., & Sharma, J. K. (2016). Stable Phase CdS Nanoparticles for Optoelectronics: A Study On Surface Morphology, Structural and Optical Characterization. Materials Science- Poland, 34(2), 368–373. https://doi.org/10.1515/MSP-2016-0033
Lang, D., Xiang, Q., Qiu, G., Feng, X., & Liu, F. (2014). Effects of Crystalline Phase and Morphology on the Visible Light Photocatalytic H2-Production Activity of CdS Nanocrystals. Dalton Transactions, 43(19), 7245–7253. https://doi.org/10.1039/C3DT53601G
Majumder, S., Gupta, S., & Raghuvanshi, S. (2014). Removal of Dissolved Metals by Bioremediation. Heavy Metals in Water, 44–56. https://doi.org/10.1039/9781782620174-00044
Mathur, P., Sanyal, D., Callahan, D. L., Conlan, X. A., & Pfeffer, F. M. (2021). Treatment Technologies to Mitigate the Harmful Effects of Recalcitrant Fluoroquinolone Antibiotics on the Environment and Human Health. Environmental Pollution, 291. https://doi.org/10.1016/J.ENVPOL.2021.118233
Munyai, S., Tetana, Z. N., Mathipa, M. M., Ntsendwana, B., & Hintsho-Mbita, N. C. (2021). Green Synthesis of Cadmium Sulphide Nanoparticles for the Photodegradation of Malachite Green Dye, Sulfisoxazole and Removal of Bacteria. Optik, 247. https://doi.org/10.1016/J.IJLEO.2021.167851
Shehu Imam, S., Adnan, R., & Mohd Kaus, N. H. (2018). Photocatalytic Degradation of Ciprofloxacin in Aqueous Media: A Short Review. Toxicological & Environmental Chemistry, 100(5–7), 518–539. https://doi.org/10.1080/02772248.2018.1545128
Shen, L., Liang, S., Wu, W., Liang, R., & Wu, L. (2013). CdS-Decorated UiO–66(NH2) Nanocomposites Fabricated by a Facile Photodeposition Process: An Efficient and Stable Visible-Light-Driven Photocatalyst for Selective Oxidation of Alcohols. Journal of Materials Chemistry A, 1(37), 11473–11482. https://doi.org/10.1039/C3TA12645E
Shivaji, K., Mani, S., Ponmurugan, P., De Castro, C. S., Lloyd Davies, M., Balasubramanian, M. G., & Pitchaimuthu, S. (2018). Green-Synthesis-Derived CdS Quantum Dots Using Tea Leaf Extract: Antimicrobial, Bioimaging, and Therapeutic Applications in Lung Cancer Cells. ACS Applied Nano Materials, 1(4), 1683–1693. https://doi.org/10.1021/acsanm.8b00147
Usman, M. R., Prasasti, A., Fajriyah, S., Marita, A. W., Islamiah, S., Firdaus, A. N., Noviyanti, A. R., & Eddy, D. R. (2021). Degradation of Ciprofloxacin by Titanium Dioxide (TiO2) Nanoparticles: Optimization of Conditions, Toxicity, and Degradation Pathway. Bulletin of Chemical Reaction Engineering & Catalysis, 16(4), 752–762. https://doi.org/10.9767/bcrec.16.4.11355.752-762
Verma, V., & Singh, S. V. (2023). Augmentation of Photocatalytic Degradation of Methylene Blue Dye Using Lanthanum and Iodine Co-Doped TiO2 Nanoparticles, Their Regeneration and Reuse; and Preliminary Phytotoxicity Studies for Potential use of Treated Water. Journal of Environmental Chemical Engineering, 11(6). https://doi.org/10.1016/J.JECE.2023.111339
Xiao, J., Wen, B., Melnik, R., Kawazoe, Y., & Zhang, X. (2014). Phase Transformation of Cadmium Sulfide Under High Temperature and High Pressure Conditions. Physical Chemistry Chemical Physics, 16(28), 14899–14904. https://doi.org/10.1039/C4CP01003E
Zhao, W., Li, Y., Zhao, P., Zhang, L., Dai, B., Xu, J., Huang, H., He, Y., & Leung, D. Y. C. (2021). Novel Z-Scheme Ag-C3N4/SnS2 Plasmonic Heterojunction Photocatalyst for Degradation of Tetracycline and H2 Production. Chemical Engineering Journal, 405, 126555. https://doi.org/10.1016/J.CEJ.2020.126555
Zhao, Y., Li, Y., & Sun, L. (2021). Recent Advances in Photocatalytic Decomposition of Water and Pollutants for Sustainable Application. Chemosphere, 276. https://doi.org/10.1016/J.CHEMOSPHERE.2021.130201
Zhou, G. J., Li, S. H., Zhang, Y. C., & Fu, Y. Z. (2014). Biosynthesis of CdS Nanoparticles in Banana Peel Extract. Journal of Nanoscience and Nanotechnology, 14(6), 4437–4442. https://doi.org/10.1166/JNN.2014.8259
 This work is licensed under a: Creative Commons Attribution 4.0 International License
© Granthaalayah 2014-2024. All Rights Reserved.