A Case Study on Cyclist route choice model
Debabrata Paul 1![]()
![]()
1 Master's in Civil Engineering-Sustainable Mobility in Urban Areas,
Department of Civil Engineering, Alma Mater Studiorum-
University of Bologna, Bologna, Italy
|
|
|
ABSTRACT |
|
|
This research
focuses on improving cycle path design by analyzing the determinants of route
choice for bicycle users. The study uses a large GPS dataset to develop a
route choice model for the inner-city of Amsterdam. The main research question
is to identify the factors that influence route choice decisions, which is
broken down into sub-questions related to the contribution of the GPS dataset
to route choice models, the relevant variables for bicycle users' route
choices, and the effect of these variables on route choice. The study finds
that route attributes, such as distance and cycle path quality, and
contextual variables, such as trip type and time of day, have a significant
effect on bicycle users' route choices. The results provide insights for
designing more desirable bicycle infrastructure in urban areas. |
|||
|
Received 14 January 2024 Accepted 15 February 2024 Published 29 February 2024 Corresponding Author Debabrata
Paul, debabratapaul05@gmail.com DOI 10.29121/granthaalayah.v12.i2.2024.5486 Funding: This research
received no specific grant from any funding agency in the public, commercial,
or not-for-profit sectors. Copyright: © 2024 The
Author(s). This work is licensed under a Creative Commons
Attribution 4.0 International License. With the
license CC-BY, authors retain the copyright, allowing anyone to download,
reuse, re-print, modify, distribute, and/or copy their contribution. The work
must be properly attributed to its author.
|
|||
|
Keywords: Sustainable Transport, Bicycle, Route
Choice Model, GPS Data, Infrastructure, Route Attributes, Path Size Factor,
Trip Types, Light Condition, Time of Day |
|||
1. INTRODUCTION
As a sustainable transport mode, the bicycle plays an important role in daily travels for people in the Netherlands. To improve cycle path design, it is necessary to clarify which characteristics influence the route choice. The objective of this research is to add to the understanding of the desired infrastructure of bicycles by developing a route choice model using GPS data in the inner-city of Amsterdam. The main research question is: What determinants can be identified for route choice decisions of bicycle users? And it can be broken down into the following sub questions:
1) What does a large GPS dataset contribute to the field of route choice models?
2) Which relevant variables can be identified in route choice for bicycle users?
3) What is the effect of the identified variables on route choice for bicycle users?
Route choice models assume that individuals choose a route to travel from the places they are, known as origin, to the places they want to be, their destination. The GPS dataset is used to construct route choice models, dating from 14 Sep., 2015 to 20 Sep., 2015. After data prepossessing, 2819 route choices in the inner-city of Amsterdam were derived. Using the labelling approach, the alternative routes were generated. The route attributes include distance, separate cycle path, intersection and path size factor. In addition, contextual variables include trip types (access/egress/standalone), light condition (dark/daylight) and time of day (morning peak/daytime/evening peak/evening).
2. Methodology
2.1. Basic Consideration
Before model estimation, basic hypotheses on potential factors and their effects should be made. Distance was a widely investigated factor in cyclists’ route choice. Many studies have demonstrated that long distance trips disencourage cyclists’ preference with high significance Hood et al. (2011). Also, a higher number of intersections in the route could have a negative effect on cyclists’ choice. In addition, separate cycle paths can reduce the exposure of risk from other road users, especially risks from the motor vehicle Hull & O’Holleran (2014). Besides, the contextual attributes could have effects by combining with route attributes and act as interactive variables. For trip type, it is possible that the interaction variable involved trip type and distance as the travellers tend to ride less after the train trip because of tiredness. For the light condition, it may be incorporated with the proportion of the bicycle path, as in the dark, people may prefer to ride on separated bike paths to reduce the risk. For the time of day, in the peak hour, for example, cyclists may tend to ride on seperate cycle paths to avoid the heavy vehicle traffic from people’s instinct. However, not all the interactive variables may have a significant impact on the route choice. So the models with different utility functions will be tested.
2.2. Models
In this case, two different kinds of model will be
estimated, multinomial logit (MNL) and path size logit (PSL). In MNL model, the possibility of choosing
alternative ![]() is:
is:
![]()
where ![]() refer to utility of route
refer to utility of route ![]() ,
and the alternative with highest
,
and the alternative with highest ![]() is chosen.
is chosen.
PSL involves the path size factor (PS) which has the overlap among the alternatives considered. And the equation of possibility is:
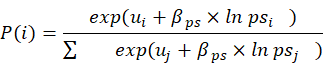
where the ![]() is the parameter of path size factor that
needs to be estimated.
is the parameter of path size factor that
needs to be estimated.
The general form of the utility function in Biogeme is:
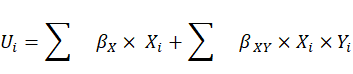
Where ![]() is parameter of the route attributes
is parameter of the route attributes ![]() ;
;
![]() :
parameter of the interactive variable
:
parameter of the interactive variable ![]() ;
;
![]() :
dummy variable of route
:
dummy variable of route ![]() .
.
2.3. Search Strategy
The effects of potential influential factors according to the hypothesis should be estimated and tested in the model. To construct MNL models, variables are added in order and the stepwise backward method is used. Specifically, three variables for route attributes are first added and checked for significance level. And then dummy variables are added in order to interact with route attribute variables. The detailed steps are listed as follows:
1) Route attribute variables are added to the model and only kept variables with p-value< 0.05 (Base Model)
2) To examine the effect of trip type, dummy variables ‘access’ ‘egress’ and ‘standalone’ are added and interact with route attribute variables in order. Interactive variables with p-value less than 0.05 can be kept (Model 2).
3) To examine the effect of light condition, the variable ‘darkness’ is added to the Base Model as an interaction variable. Interactive variables with p-value less than 0.05 can be kept to construct Model 3.
4) To examine the effect of time of day, dummy variables ‘morningpeak’ ‘day’ ‘eveningpeak’ and ‘evening’ are added to the Base Model in order. Interactive variables with p-value less than 0.05 can be kept to construct Model 4
5) All interaction variables tested in step 2, 3, 4 (with p-value less than 0.05) is added to the Base Model with p-value check to construct Model 5
PSL models will be constructed based on Base Model, Model 1, Model 2, Model 3, Model 4 with the path size factor. Adjustment could be made by adding or removing variables in case that the model performance is worse than before, or some variables become insignificant.
3. Result Analysis
3.1. Model Estimation
This section shows the estimated result of 5 MNL models and 5 PSL models to reveal the influential factors and their impacts on route choice. All models use the same dataset consisting of 2819 route choices. Table 1, Table 2, Table 3, Table 4, Table 5 showed MNL models. Model 1 with three route attribute variables. Model 2-Model 4 have route attribute variables and dummy variables as an interaction. Interaction variables based on the hypothesis were put into models while only significant variables were kept in shown models.
Table 1
|
Table 1 The Result of Model 1 |
|||||||
|
Name |
Value |
Std err |
t -test |
p -value |
Robust Std err |
Robust t -test |
p -value |
|
bike path |
-4.67 |
0.182 |
-25.6 |
0.00 |
0.198 |
-23.60 |
0.00 |
|
distance |
-4.39 |
0.182 |
-24.1 |
0.00 |
0.274 |
-16.05 |
0.00 |
|
intersection |
-0.270 |
0.0107 |
-25.1 |
0.00 |
0.0148 |
-18.22 |
0.00 |
Table 2
|
Table 2 The Result of Model 2 |
|||||||
|
Name |
Value |
Std err |
t -test |
p -value |
Robust Std err |
Robust t -test |
p -value |
|
bikepath |
-4.43 |
0.187 |
-23.70 |
0.00 |
0.202 |
-21.88 |
0.00 |
|
bikepath_access |
-3.26 |
1.02 |
-3.19 |
0.00 |
0.779 |
-4.18 |
0.00 |
|
bikepath_egress |
-3.28 |
1.52 |
-2.15 |
0.03 |
1.18 |
-2.78 |
0.01 |
|
distance |
-4.18 |
0.180 |
-23.20 |
0.00 |
0.267 |
-15.67 |
0.00 |
|
distance_egress |
-4.92 |
1.81 |
-2.72 |
0.01 |
1.39 |
-3.54 |
0.00 |
|
intersection |
-0.250 |
0.0107 |
-23.36 |
0.00 |
0.0145 |
-17.27 |
0.00 |
|
intersection_access |
-0.250 |
0.0742 |
-3.37 |
0.00 |
0.0543 |
-4.61 |
0.00 |
|
intersection_egress |
-0.377 |
0.113 |
-3.34 |
0.00 |
0.113 |
-3.32 |
0.00 |
Table 3
|
Table 3 The Result of Model 3 |
|||||||
|
Name |
Value |
Std err |
t -test |
p -value |
Robust Std err |
Robust t -test |
p -value |
|
bikepath |
-4.68 |
0.182 |
-25.67 |
0.00 |
0.198 |
-23.59 |
0.00 |
|
distance |
-4.41 |
0.183 |
-24.13 |
0.00 |
0.276 |
-15.95 |
0.00 |
|
intersection |
-0.263 |
0.0110 |
-24.01 |
0.00 |
0.0150 |
-17.51 |
0.00 |
|
intersection_darkness |
-0.0525 |
0.0239 |
-2.19 |
0.03 |
0.0209 |
-2.51 |
0.01 |
Table 4
|
Table 4 The Result of Model 4 |
|||||||
|
Name |
Value |
Std err |
t -test |
p -value |
Robust Std err |
Robust t -test |
p -value |
|
bikepath |
-4.40 |
0.197 |
-22.39 |
0.00 |
0.207 |
-21.31 |
0.00 |
|
bikepath_morning |
-1.15 |
0.381 |
-3.02 |
0.00 |
0.437 |
-2.63 |
0.01 |
|
distance |
-4.42 |
0.183 |
-24.09 |
0.00 |
0.278 |
-15.86 |
0.00 |
|
intersection |
-0.271 |
0.0108 |
-25.15 |
0.00 |
0.0148 |
-18.34 |
0.00 |
Table 5
|
Table 5 The Result of Model 5 |
|||||||
|
Name |
Value |
Std err |
t -test |
p -value |
Robust Std err |
Robust t -test |
p -value |
|
bikepath |
-4.19 |
0.200 |
-21.00 |
0.00 |
0.208 |
-20.14 |
0.00 |
|
bikepath_access |
-3.26 |
1.05 |
-3.10 |
0.00 |
0.775 |
-4.21 |
0.00 |
|
bikepath_egress |
-3.23 |
1.57 |
-2.06 |
0.04 |
1.24 |
-2.60 |
0.01 |
|
bikepath_morning |
-1.12 |
0.388 |
-2.89 |
0.00 |
0.440 |
-2.55 |
0.01 |
|
distance |
-4.22 |
0.182 |
-23.12 |
0.00 |
0.274 |
-15.40 |
0.00 |
|
distance_egress |
-5.07 |
1.82 |
-2.78 |
0.01 |
1.41 |
-3.60 |
0.00 |
|
intersection |
-0.246 |
0.0110 |
-22.40 |
0.00 |
0.0146 |
-16.85 |
0.00 |
|
intersection_access |
-0.253 |
0.0768 |
-3.30 |
0.00 |
0.0570 |
-4.44 |
0.00 |
|
intersection_darkness |
-0.0463 |
0.0236 |
-1.96 |
0.05 |
0.0201 |
-2.30 |
0.02 |
|
intersection_egress |
-0.377 |
0.114 |
-3.30 |
0.00 |
0.114 |
-3.31 |
0.00 |
PSL models were constructed based on the MNL models with insignificant parameters removed. All parameters were significant after adding path size factor to Model 1 (Table 6) and Model 2 (Table 7). After adding path size factor to Model 3 and Model 4, the interaction variables ‘intersection_darkness’ and ‘bikepath_morning’ became insignificant (p-value> 0.05) and were deleted, making models the same as Model 6 in Table 6. Model 8 was estimated using variables in Model 5 with insignificant parameters deleted.
Table 6
|
Table 6 The Result of Model 6 (PSL Base Model) |
|||||||
|
Name |
Value |
Std err |
t -test |
p -value |
Robust Std err |
Robust t -test |
p -value |
|
bikepath |
-4.03 |
0.224 |
-17.94 |
0.00 |
0.238 |
-16.90 |
0.00 |
|
distance |
-4.71 |
0.232 |
-20.30 |
0.00 |
0.375 |
-12.55 |
0.00 |
|
intersection |
-0.285 |
0.0138 |
-20.71 |
0.00 |
0.0190 |
-14.99 |
0.00 |
|
overlap |
14.0 |
0.812 |
17.25 |
0.00 |
1.06 |
13.17 |
0.00 |
Table 7
|
Table 7 The Result of Model 7 |
|||||||
|
Name |
Value |
Std err |
t-test |
p-value |
Robust Std err |
Robust t-test - |
p-value |
|
bikepath |
-3.80 |
0.250 |
-15.20 |
0.00 |
0.255 |
-14.90 |
0.00 |
|
bikepath_access |
-1.54 |
1.12 |
-1.38 |
0.17 |
0.722 |
-2.13 |
0.03 |
|
bikepath_egress |
-5.45 |
2.72 |
-2.00 |
0.05 |
1.11 |
-4.89 |
0.00 |
|
bikepath_morning |
-0.390 |
0.465 |
-0.84 |
0.40 |
0.431 |
-0.91 |
0.37 |
|
distance |
-4.55 |
0.232 |
-19.59 |
0.00 |
0.374 |
-12.15 |
0.00 |
|
distance_egress |
-8.91 |
3.38 |
-2.64 |
0.01 |
1.42 |
-6.26 |
0.00 |
|
intersection |
-0.275 |
0.0144 |
-19.00 |
0.00 |
0.0197 |
-13.93 |
0.00 |
|
intersection_access |
-0.0523 |
0.0631 |
-0.83 |
0.41 |
0.0245 |
-2.13 |
0.03 |
|
intersection_darkness |
0.00837 |
0.0274 |
0.31 |
0.76 |
0.0219 |
0.38 |
0.70 |
|
intersection_egress |
-0.579 |
0.203 |
-2.85 |
0.00 |
0.0987 |
-5.87 |
0.00 |
|
overlap |
13.9 |
0.814 |
17.03 |
0.00 |
1.05 |
13.18 |
0.00 |
Table 8
|
Table 8 The Result of Model 8 |
|||||||
|
Name |
Value |
Std err |
t-test |
p-value |
Robust Std err |
Robust t-test |
p-value |
|
bikepath |
-3.88 |
0.232 |
-16.74 |
0.00 |
0.246 |
-15.77 |
0.00 |
|
bikepath_access |
-1.53 |
1.11 |
-1.38 |
0.17 |
0.728 |
-2.10 |
0.04 |
|
bikepath_egress |
-5.43 |
2.70 |
-2.01 |
0.04 |
1.10 |
-4.93 |
0.00 |
|
distance |
-4.55 |
0.232 |
-19.61 |
0.00 |
0.374 |
-12.17 |
0.00 |
|
distance_egress |
-8.91 |
3.39 |
-2.63 |
0.01 |
1.44 |
-6.19 |
0.00 |
|
intersection |
-0.273 |
0.0139 |
-19.63 |
0.00 |
0.0191 |
-14.33 |
0.00 |
|
intersection_access |
-0.0507 |
0.0633 |
-0.80 |
0.42 |
0.0245 |
-2.07 |
0.04 |
|
intersection_egress |
-0.582 |
0.203 |
-2.86 |
0.00 |
0.0987 |
-5.90 |
0.00 |
|
overlap |
13.9 |
0.809 |
17.17 |
0.00 |
1.05 |
13.17 |
0.00 |
3.2. Model Comparison and Statistical Tests
Table 1 showed the criteria to compare models. Basically, two models can be compared using chi-square when the parameters in one model can cover the other. If not, AIC and BIC are used as criteria. The lower the AIC and BIC values, the better the model performance. For MNL models, the performance order is Model 5 > Model 2> Model 4> Model 3> Base MNL Model. The best MNL model is Model 5 according to chi-square, as it had more significant variables which cover other MNL models, and indicated better fitting to the sample dataset. Besie, Model 2,3,4,5 outperformed Base MNL Model, indicating the added interaction variables improves the model explanatory power significantly. For PSL models, the performance order is Model 8 > Model 7> Base PSL Model. Chi-square test value for Model 7 and Model 8 is 0.802, failing at both 90% and 95% confidence level. Thus, Model 7 was no better than Model 8.
The best PSL model performs better than the best MNL model according to lower AIC and BIC. This indicates that including the path size factor in the model is beneficial for the interpretation of the results and the prediction of route choice. The PSL structure is considered more suitable for estimating route choice models than the MNL structure. This finding is in line with many researchers Chen et al. (2018), Khatri et al. (2016), Lam & Xie (2002) .
Table 9
|
Table 9 Comparison Among MNL and PSL Models |
||||||||
|
|
MNL |
PSL |
||||||
|
|
Base MNL Model (Model 1) |
Model 2 |
Model 3 |
Model 4 |
Model 5 |
Base PSL Model (Model 6) |
Model 7 |
Model 8 |
|
Log Likelihood |
-880.805 |
-854.828 |
-878.13 |
-876.019 |
-848.15 |
-465.235 |
-453.821 |
-454.222 |
|
Number of Parameters |
3 |
8 |
4 |
4 |
10 |
4 |
11 |
9 |
|
Chi-Square for Base Model Test
Value (whether OK at 95%) |
- |
51.954 (Yes) |
5.35 (Yes) |
9.572 (Yes) |
9.572 (Yes) |
- |
22.828 (Yes) |
22.026 (Yes) |
|
AIC |
1767.611 |
1725.657 |
1764.26 |
1760.039 |
1716.3 |
938.469 |
929.642 |
926.443 |
|
BIC |
1785.443 |
1773.21 |
1788.036 |
1783.815 |
1775.742 |
962.246 |
995.028 |
979.94 |
3.3. Discussion on the Best Model
Based on the model comparison in Table 1, the best MNL model is Model 5, the best PSL model is Model 8, which only contained significant attributes. In the best MNL model (Table 5), ‘distance’ was negatively associated with route choice indicating cyclists tend to choose shorter routes in the inner-city of Amsterdam. Increasing the average distance with one-unit results in 4.22 units decrease of route utility. The variables ‘distance_egress’ had the largest negative effect of all variables in Model 5. Cyclists returning from train stations value shorter distances more. As indicated in the data description, a large proportion of cycle trips were commuting trips. Egress from train stations could happen after daily working, and the exhaustion could make cyclists tend to avoid long distance trips.
Intersection and intersection related interaction variables were negatively associated with route choice, which was in line with the research of Ghanayim & Bekho (2018) that cyclists tend to avoid intersections and crossing streets in route choice. Parameters for variables ‘Intersection_access’,’Intersection_egress’,’Intersection_darkness’ were negative, indicating that cyclists having access/egress trips or cycling with a poor light condition tend to choose streets without intersections. This could be explained by the fact that intersections mean potential delay and potential conflicts with other modes, while cyclists value efficiency and safety in their decision making.
Separated bike paths and related interaction variables were negatively associated with route choice, which was different from our hypothesis and some previous research Hull & O’Holleran (2014). The model showed that cyclists tend to choose routes with less separated bike paths. This could be explained by the fact that many trips used the roads of the city centre, where active modes were mixed and there was no separated cycle path. ‘bike path_acess’, ‘bike path_egress’ and ‘bike path_morning’ were negatively associated with route choice, and the interaction variable ‘bike path_egress’ had larger negative effects than ‘bike path’. This indicates that more access\egress trips and morning-peak trips tend to be through the city centre.
In the PSL model, the path size term is added. This term decreases the impact of overlap among routes on the total utility, and has a coefficient of 13.9 at 95% confidence level. Increasing the log of overlapping by one unit increases the route utility by 13.9. It is worth noting that except for the path size factor, all significant variables in Model 8 (the best PSL model) can be covered by Model 5 (the best MNL model). While ‘intersection_darkness’ and ‘bike path_morning’ became insignificant after adding the path size factor. Besides, the coefficients of ‘distance’ and ‘distance_egree’ were more negative in the PSL model. Thus, overestimated overlapping in the MNL model results in less negative effects of distance. This is likely due to most route overlaps occurring on road segments with short distance and frequently used by egress trips.
4. Conclusion and Recommendation
This paper presented the findings of a cyclists’ route choice model estimated for the inner-city of Amsterdam, aimed at identifying the determinants influencing cycling route choice. Choice models were estimated based on detailed GPS data comprising 2,819 effective trips performed during a nationwide initiative called the ‘Bicycle Counting Week’ (BCW), which took place on 14-20 September 2015. To determine the effect of overlap on the route choice of cyclists, both the MNL and PSL modelling structure are estimated and compared. The best PSL model outperformed the best MNL model. This was because MNL models were based on the assumption that routes are independent, and thus overestimates the route overlapping. The PSL models address this problem by introducing path size factor. This finding suggests that distance and intersections were negatively associated with route choice. Besides, separate cycle paths do not necessarily attract cyclists as the city centre could be more attractive without separated cycle paths. Access trips and egress trips interacted with intersections and separated paths were negatively associated with route choice. This is likely due to efficiency and safety could be important considerations regarding transferring and commuting trips.
Following recommendations on infrastructure are made based on the best MNLand PSL.
· Increase the cycling traffic network connectivity: This will reduce the distance for some routes, also increase the resistance of the cycle path network. Possible methods include reducing dead end roads, increasing connection among the routes, enhancing the connectivity to buildings, and providing flexible routes to reduce detours.
· Ensure the cycling friendly intersection: Cyclists tend to avoid intersections, especially for access/egress trips and cycle with darkness. It is suggested that more streetlights and flexible traffic control should be equipped at intersections to reduce waiting time and protect vulnerable users. More attention should be paid to the intersections around train stations, cyclists are supposed to be prioritised at intersections to promote the cycle mode. The light conditions at intersections are supposed to be improved.
· Shorten the distance or expand width of the cycling path connected to the central station: The variables ‘distance_egress’ had the largest negative effect of all variables in Model 5, which means distance is especially sensitive to cyclists returning from train stations. Tiredness or time may impact their decision. So, the distance should be shortened by reducing unnecessary turning or detour. If it is not possible in some locations, a wider cycle path may make cyclists ride with less tension in large cycle traffic, and the sensitivity on distance may be reduced.
· A cycling friendly city centre: City centre is attractive to cyclists, while there is no separated cycle path and multiple modes are mixed. To provide a cycle friendly environment, the mixed flows in the city centre should be well organised. Direction separation line, signs to prioritise cycling and more bicycle infrastructure are recommended. The pavement in the city centre is supposed to be maintained periodically and attributes such as slope and smoothness should be bicycle friendly.
We recommend also including socio-demographic variables, such as cultural background along with gender, age etc. into future data collection for analysing and identifying their importance. Next to that, we want to explore the sensitivity of the estimation results to the generated choice sets using the empirical approach. Furthermore, we are interested in testing how individual knowledge and familiarity with the network influences route choice when cycling, we expect that this will help understanding the relationship with overlapping routes. Finally, cycling route choice models may be integrated into an activity scheduling and mode choice model, for assessing their inter-relation with other modes in transport demand forecasting.
CONFLICT OF INTERESTS
None.
ACKNOWLEDGMENTS
The author would like to express his gratitude towards the Faculty of Civil Engineering and Geosciences (CEG), TU Delft, for creating an enabling environment for research and study. Special thanks go to Prof. Dorine Duives and other group members for their invaluable assistance in navigating the study process.
REFERENCES
Chen, P., Shen, Q., & Childress, S. (2018). A GPS Data-Based Analysis of Built Environment Influences on Bicyclist Route Preferences. Int. J. Sustain. Transp. 12, 218–231. https://doi.org/10.1080/15568318.2017.1349222.
Ghanayim, M., & Bekho, S. (2018). Modelling Bicycle Route Choice Using Data From a GPS Assisted Household Survey. Eur. J. Transp. Infrastruct. Res. 18, 158–177. https://doi.org/10.18757/ejtir.2018.18.2.3228.
Hood, J., Sall, E., & Charlton, B. (2011). A GPS-Based Bicycle Route Choice Model for San Francisco, California. Transportation Letters, 63-75.
Hull, A., & O’Holleran, C. (2014). Bicycle Infrastructure: Can Good Design Encourage Cycling?. Urban, Planning and Transport Research, 2(1), 369-406. https://doi.org/10.1080/21650020.2014.955210.
Khatri, R., Cherry, C.R., Nambisan, S.S., & Han, L.D. (2016). Modelling Route Choice of Utilitarian Bikeshare Users with GPS Data. Transport. Res. Record: J. Transport. Res. Board 2587, 141–149. https://doi.org/10.3141/2587-17.
Lam, S.-H., & Xie, F. (2002). Transit Path-Choice Models that Use Revealed Preference and Stated Preference Data. Transportation Research Record. Journal of the Transportation Research Board, 58-65. https://doi.org/10.3141/1799-08.
 This work is licensed under a: Creative Commons Attribution 4.0 International License
© Granthaalayah 2014-2024. All Rights Reserved.