Assessment of knowledge regarding early signs of oral cancer among adults in selected rural and urban community, West Bengal
Tanuja Pain 1![]()
![]() ,
Manika Mazumder 2
,
Manika Mazumder 2![]()
![]() ,
Dr. Chandrima Maity 3
,
Dr. Chandrima Maity 3![]()
![]()
1 Senior
Public Health Nurse, Purba Bardhaman,
West Bengal, India
2 Professor,
College of Nursing, Nil Ratan Sirkar Medical College and Hospital, Kolkata,
West Bengal, India
3 Professor,
Govt. College of Nursing, Calcutta National Medical College and Hospital,
Kolkata, West Bengal, India
|
|
|
ABSTRACT |
|
|
Oral cancer is one of the public health problem in today’s world. It is one among the ten commonest cancers within the world. Recognition of early signs helps in early diagnosis of oral cancer and quick, successful, and less aggressive treatment or management. If the cancer is detected at an initial stage, then the 85% people can survive for 5-year. Aim: This study aims to assess the knowledge regarding early signs of oral cancer among adults in selected rural and urban community, West Bengal. Methods: A descriptive survey research was carried out with total 200 male adults aged 18 to 50 years, of selected rural and urban community, West Bengal. Data were collected through non probability purposive sampling technique. Validated structured interview schedule was used to collect data. Data were collected on adults’ demographic characteristics and knowledge regarding early signs of oral cancer. Result: The result revealed that in rural community most of the adults (50%) had average knowledge and in urban community most of the adults (37%) had good knowledge. There is significant difference between the knowledge scores among adults of rural and urban community (p<0.001). Adults of urban community are more knowledgeable than adults of rural community. Chi- square test revealed that there was a significant association of knowledge with age, educational status (p<0.001) and habit and addiction (p<0.01) of rural adults and monthly family income, habit and addiction and information received by the adults of urban community are significantly associated with their knowledge (p<0.001). Conclusion: There is the need to increase awareness in the community through
educational programmes on early signs of oral
cancer which will be helpful in early detection and diagnosis of same, as
well as take timely precautionary measures to prevent oral cancer and thereby
reducing the morbidity, mortality, and global burden of oral cancer. |
|||
|
Received 14 July 2023 Accepted 15 August
2023 Published 31 August 2023 Corresponding Author Dr.
Chandrima Maity, maitychandrima21@gmail.com DOI 10.29121/granthaalayah.v11.i8.2023.5269 Funding: This research
received no specific grant from any funding agency in the public, commercial,
or not-for-profit sectors. Copyright: © 2023 The
Author(s). This work is licensed under a Creative Commons
Attribution 4.0 International License. With the
license CC-BY, authors retain the copyright, allowing anyone to download,
reuse, re-print, modify, distribute, and/or copy their contribution. The work
must be properly attributed to its author.
|
|||
|
Keywords: Oral Cancer, Knowledge |
|||
1. INTRODUCTION
Cancer has existed in all of human history. Hippocrates described several kinds of cancers, referring to them with a Greek word ‘karkinos’ meaning crab or cray fish. Celsus translated ‘karkinos’ into Latin “cancer.” Hajdu (2011) According to W.H.O, cancer is a large group of diseases that can occur almost in any site of the body when cells grow abnormally and uncontrollably, cross their usual boundaries to invade adjoining parts of the body and/or spread to other organs. Benign tumor, in contrast, is also abnormal cell growth but do not spread. WHO (n.d.) ‘Head and neck cancer’ is the term that describes variety of various malignant tumours occur in and around the throat, larynx, nose, sinuses, and mouth. Around 80% of oral cancers, a sub variety of head and neck cancer, has been connected to the utilization of tobacco. Jethwa & Khariwala (2017)
Tobacco use is one of the responsible risk factors for head and neck cancers, as well as oral cavity and oropharyngeal cancer. Moreover, it is seen that people who smoke are higher chance to get cancer than who do not. Few studies have conjointly found that semi-permanent exposure to second hand smoke may increase the chance of cancers; however, a lot of analysis is required to substantiate the findings. Pipe smoking is coupled to an awfully high risk for lip cancer due to bit the pipe stem. American Cancer Society (n.d)
2. Background of the Study
Oral cancer is one of the major public health problem in today’s world. It is one among the ten commonest cancers within the world. In 2018, it was observed by the Global Cancer Observatory, under the International Agency for Research on Cancer (IARC), an Inter-governmental Agency forming part of the WHO of the UN, the highest rate of cancer of the lip and oral cavity among both sexes occurred in people of Papua New Guinea (Age Standardized rate per 100,000 was 20.4) followed by Pakistan and Bangladesh; India stands fourth in the list (Age Standardized rate per 100,000 was 9.1). Sung et al. (2021)
It was estimated that during the year 2020, about 2,64,211 men and 1,13,502 women (total 3,77,713 cases) had oral cancer worldwide. Park (2021)
The prevalence of oral cancer is very high in India. It ranks tops in the list among men and third among women according to incidence in India. In this country 20 per 100,000 populations are affected with oral cancer which accounts for about 30% of all cancers. In India more than 5 people die every hour every day because of cancer. It was estimated that in 2020 oral cancer caused 5.4 deaths per 100,000 population (total 75,290 deaths), 57,380 cases in men and 22,483 cases in women. Coelho (2012)
In India the proportion of tobacco related cancers relative to all or any cancers range from 35% in Bangalore to 50% in Bhopal among males. About 2000 deaths every day in India is tobacco related. Males in Northeast region had the highest risk,1 in 143 for both mouth and tongue cancers. Proportion of TRC in comparison of all cancer ranged from 11–25% for men. Asthana et al. (2016).
A comparative study was conducted to assess the knowledge regarding oral carcinoma among adults in rural community and urban community area using 100 samples. Result revealed that more number of adults (44%) of urban community had sufficient knowledge than adults (4%) of rural community. Selvaraj (2019) Oral cancer includes cancers of the lips, tongue, cheeks, floor of the mouth, hard palate and soft palate, sinuses, and pharynx. Cancers of the Mouth including cancer of the lips and salivary glands, Pharynx, Larynx (MPL) are the seventh most frequent cancer worldwide. Oral cancers most commonly begin in the flat, thin squamous cells that line the lips and inside of the mouth. American Cancer Society (n.d.)
3. Problem Statement
Assessment of knowledge regarding early signs of oral cancer among adults in selected rural and urban community, West Bengal.
4. Objectives of the study
1) To assess the knowledge regarding early signs of oral cancer among adults of rural community.
2) To assess the knowledge regarding early signs of oral cancer among adults of urban community.
3) To compare the knowledge score regarding early signs of oral cancer among adults between rural and urban community.
4) To find out the association between knowledge scores regarding early signs of oral cancer among adults with selected socio- demographic variable.
5. Methodology
A Descriptive survey conducted at the Champasole village, Bankura for rural community and Baburbag, Purba Bardhaman for urban community, West Bengal in 07/03/2022 to 02/04/2022. Non- probability purposive sampling technique was used to select100 respondents (Male adults 18 to 50year age group) each from urban and rural area. The present study was carried out after getting all permission from the concerned authority. Informed consent was taken and anonymity was maintained. Content validity of tools were established by 11 experts in the fields of community medicine, Medical-surgical field, and Nursing domain. Reliability of the Tool II was done by Split-half method. Computed reliability ‘r’ was 0.97. So, tool was seemed to be reliable. For administration all tools were converted into Bengali language and linguistic validation was done by linguistic experts. Both descriptive and inferential statistics were used to analysis the data. Data analysis was planned on the basis of objectives of the study using descriptive (frequency and percentage distribution, mean, median, standard deviation, mean percentage) and inferential statistics ('t’test, chi-square test).Considering the objectives of the study, total two tools were used and data were organized in five sections: Section I-demographic characteristics of the samples; Section II-knowledge regarding early signs of oral cancer among adults of rural community; Section III-knowledge regarding early signs of oral cancer among adults of urban community; Section IV-comparison of the knowledge score regarding early signs of oral cancer among adults between rural and urban community and Section V-association between knowledge scores regarding early signs of oral cancer among adults with selected socio- demographic variables for both rural and urban community.
6. Findings of the study
Socio-demographic profile of the respondents
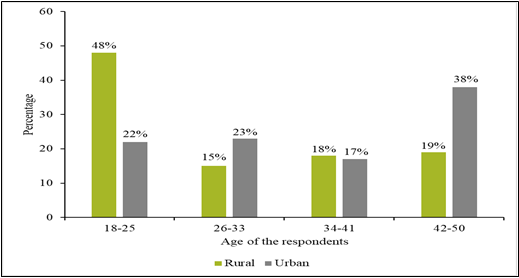
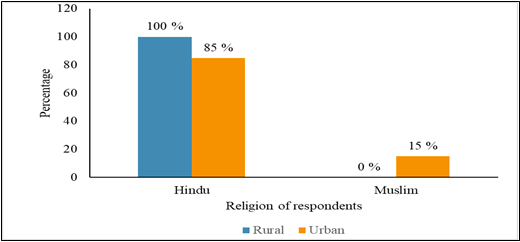
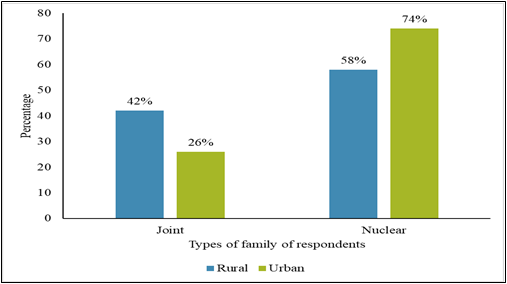
Data depicts (Figure 1) that in rural area, 48% adults belonged to age group of 18-25 years, 15% belonged to 26-33 years, 18% of 34-41 years and 19% of 42-50 years; whereas in urban area, 22% adults were in the age group of 18-25 years, 23% of 26-33 years, 17% of 34- 41 years and 38% were of 42-50 years age group. Data depicts (Figure 2) that in rural area all (100%) adults were Hindu and in urban area 85% adults belonged to Hindu and 15% adults were Muslim. Data presented in Figure 3 reveals that in rural area 42% respondents’ belonged to joint family and 58% in nuclear family; in urban area 26% respondents belonged to joint family and 74% in nuclear family. Data (Figure 4) shows that in rural area 49% had 4-6 family members whereas in urban area 44% had 4-6 family members. Data (Figure 5) shows that in rural area 44% passed higher secondary level, in urban area 31% adults passed higher secondary level. Data (Table 1) depicts that in rural area 41% adults were student, 27% were unemployed, 24% adults were farmer, in urban area 13% adults were student, 25% were unemployed and 13% were service holder. Data (Table 2) depicts that in rural area 73% adults had monthly family income upto Rs. 10,000/- and 3% adults had monthly family income ranging from Rs.30,001/- & above. In urban community 55% adults had monthly family income upto Rs.10000/- and 10% had monthly family income ranging from Rs. 30,001/- and above. It also shows that in rural area 45% participants were married and 55% were unmarried and in urban area 70% participants were married and 30% were unmarried. It further depicts that in rural community, 59% adults had no habit and addiction and 41% had habit and addiction; whereas in urban community 40% adults had no habit and addiction and 60% had habit and addiction. Data (Table 4) depicts that in rural community, 59% adults did not receive any information regarding oral cancer whereas in urban area, 45% adults did not receive any information regarding oral cancer. It also shows that in rural area 99% adults had no family history of cancer in urban area 94% had no family history of cancer.
Findings related to knowledge regarding early signs of
oral cancer both rural community and Urban community
Findings (Table 7) depicts that 33% adults of rural community had poor knowledge, 50% had average and 17% of them had good knowledge regarding early signs of oral cancer with mean knowledge score was 9.49, calculated median of 9, Score ranging from 4-16 and standard deviation was 2.95 (Table 8). Data (Table 9) also shows area the area wise distribution of knowledge area of risk factors ranked 1st, area of prevention and treatment ranked 2nd, concept area ranked 3rd and area of early signs ranked 4th.
Regarding knowledge of adults in urban community, data (Table 10) depicts that 24% had poor knowledge, 34% had average knowledge, 37% had good knowledge and 5% had very good knowledge regarding early signs of oral cancer. Data also shows (Table 11) that the mean knowledge score of adults of urban community was 11.22, with a calculated median of 12, score ranging from 5-18 and standard deviation 3.58. Data in area wise distribution shows that in the prevention and treatment ranked 1st, area of risk factors ranked 2nd, area of early signs ranked 3rd, and concept area ranked 4th (Table 12) on knowledge regarding early signs of oral cancer of adults of urban community.
Comparison of the knowledge scores regarding early
signs of oral cancer among adults between rural and urban community
Findings revealed that (Table 13) the mean knowledge score (9.49) of adults of rural community with standard deviation 2.95 is lower than the mean knowledge score (11.22) of adults of urban community with standard deviation 3.58 and mean difference is 1.73; the obtained mean difference is found to be statistically significant as evident from calculated ‘t’ value of 3.729, which is greater than the table value of t (3.29) with df (198) at 0.001 level of significance. Data also (Table 14) shows that knowledge scores in the area of concept and in the area of risk factors has no statistically significant difference at 0.05 level, but in the area of early signs of oral cancer and in the area of prevention and treatment has statistically significant difference among adults of rural and urban community.
Association between knowledge scores regarding early
signs of oral cancer with selected socio- demographic variables for both rural
and urban community
Chi square findings revealed that there is significant association between knowledge score and demographic variables of adults of rural community like age, educational level, habit, and there is no association between occupation, monthly family income, information received. The demographic variables of urban adults like educational level, monthly family income, habit and addiction, information received are significantly associated with knowledge scores and there is no association between age, occupation, family history of cancer.
7. Discussion
Discussion related to knowledge score of the adults of
selected rural and urban community
The present study result revealed that 33% adults of rural community had poor knowledge, 50% had average knowledge and 17% of them had good knowledge regarding early signs of oral cancer.
Present study supported a comparative study was conducted by Selvaraj K to assess the knowledge on oral cancer among adults in rural and urban area, 50 samples from each area. Out of 50 samples in rural area, 7 (14%) had inadequate knowledge, 41 (82%) had moderate knowledge and 2 (4%) had adequate knowledge. Among 50 samples in urban area, 3 (6%) had inadequate knowledge, 25 (50%) had moderate knowledge and 22 (44%) had adequate knowledge. Selvaraj (2019)
Sunresh NJ et al. conducted a study to assess the existing knowledge regarding oral cancer among factory workers. Semi-structured questionnaire was used to collect data from 40 sample. The result showed that 2.5% people were aware of oral cancer and its early symptoms. Additionally, 22.5% of people were not aware of oral cancer and 75% of people had an average knowledge. Sundresh et al. (2016)
Kadammanavar M et al. conducted a study to assess the level of awareness and risk factors for oral cancer among rural adult population. Out of 400 rural adult population, about 181 (45.2%) participants were well- known of the term oral cancer and 182 (45.5%) knew about one or more risk factors for oral cancer. Majority 264 (66%) participants did not know warning signs of oral cancer. Only 40% of participants believed that oral cancer can be avoided by quitting tobacco use and getting frequent screenings. Kadammanavar et al. (2015)
The present study differs from a study conducted by Redhu A et al. on assessment of awareness and knowledge about oral cancer among dental patients in Bangaluru. The total scores expressed in percentage obtained for awareness regarding risk factors, knowledge regarding symptoms and signs of oral cancer and general beliefs of oral cancer were 74.9%, 58.6% and 92.2% respectively. Redhu et al. (2020)
Discussion related to comparison of the knowledge score
regarding early signs of oral cancer among adults between rural and urban community
The present study result revealed that the mean knowledge score of rural adults is 9.49 with SD 2.950 is lower than the mean knowledge score (11.22) of adults of urban community with SD 3.580 and mean difference is 1.730. The obtained mean difference is found to be statistically significant as evident from calculated ‘t’ value 3.729 is greater than table value of ‘t’ (3.29) with df 198 at 0.001 level of significance. This study result reveals that adults of urban community have more knowledge than the adults of rural community.
Present study result is supported by following study by the comparative study conducted by Selvaraj K to assess the knowledge on oral cancer among adults in rural and urban area, the mean knowledge score of rural area was 9.66 with SD 2.385 and in urban area mean knowledge score was 12.78 with SD 3.971. Unpaired t- test showed significant difference in the level of knowledge on oral cancer between people of rural and urban area as evident from calculated ‘t’ value (4.7627) and P-value (<0.05). This study revealed that more number of adults (44%) in urban area had adequate knowledge than the number of adults (4%) in rural area. Kadammanavar et al. (2015)
Discussion related to Association between knowledge
scores regarding early signs of oral cancer among adults with selected socio-
demographic variables for both rural and urban community
The present study findings revealed that the demographic variables among rural adults such as age, educational level, habit, and addiction are significantly associated with knowledge scores and among urban adults such as education, monthly family income, habit and addiction, information regarding oral cancer are significantly associated with knowledge scores.
Above study result is supported by the comparative study conducted by Selvaraj K to assess the knowledge on oral cancer among adults in rural and urban area, there was a significant association between the age, gender, education, family history of oral cancer, family income, exposure to UV rays and the level of knowledge on oral cancer among adults in rural area and significant association between the education, occupation, habits and the level of knowledge on oral cancer among adults in urban area at p<0.05.12
The study result differ from a study conducted by Villa A et al. on Oral cancer knowledge: a survey administered to patients in dental departments at large Italian hospitals, Where no association was found between level of education, gender, age, and oral cancer knowledge.
8. Conclusion
On the basis of the study findings, it can be concluded that adults of rural community have less knowledge regarding early signs of oral cancer than adults of urban community.
9. Limitation
The limitations of the present study is structured interview schedule was constructed by the investigator was used to collect information regarding early signs of oral cancer, the responses therefore restricted.
10. Annexure
Figure 1
|
Figure 1 Bar Diagram Showing Age of Respondents n1 +n2 = (100+100) = 200 |
Figure 2
|
Figure 2 Bar Diagram Religion of Respondents n1 + n2 = 100+100= 200 |
Figure 3
|
Figure 3 Bar Diagram on Types of Family of Respondents n1 + n2 = 100+100= 200 |
Figure 4
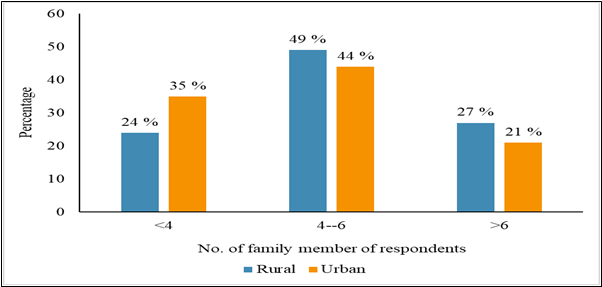
|
Figure 4 Bar Diagram on No. of Family Member of Respondents n1 + n2 = 100+100 = 200 |
Figure 5
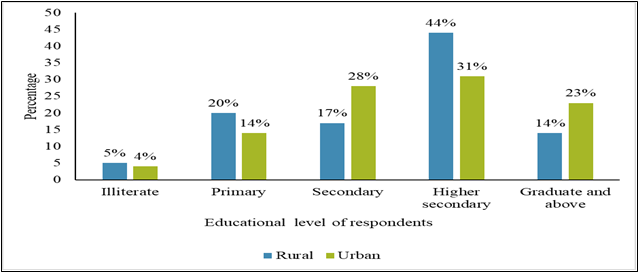
|
Figure 5 Bar Diagram
Showing Percentage Distribution of the Respondents in Terms of Education n1 + n2 = 100+100= 200 |
Table 1
|
Table 1 Frequency and Percentage Distribution of Sample Characteristics in Terms of Occupation n1+n2 = (100+100) = 200 |
|||||
|
|
|
Rural |
|
Urban |
|
|
Demographic
variable |
Frequency |
Percentage |
Frequency |
|
Percentage |
|
Occupation |
|||||
|
Student |
41 |
41 |
13 |
13 |
|
|
Unemployed |
27 |
27 |
25 |
25 |
|
|
Farmer |
24 |
24 |
Nil |
- |
|
|
Labour |
6 |
6 |
30 |
30 |
|
|
Service |
1 |
1 |
13 |
13 |
|
|
Driver |
Nil |
- |
6 |
6 |
|
|
Shop keeper |
Nil |
- |
10 |
10 |
|
|
Business |
1 |
1 |
3 |
3 |
|
Table 2
|
Table 2 Frequency and Percentage Distribution
of Sample Characteristics in Terms of Monthly Family Income, Marital Status
and Habit and Addiction n1 + n2 = (100+100) = 200 |
||||
|
Rural |
Urban |
|||
|
Demographic
variables |
Frequency |
Percentage |
Frequency |
Percentage |
|
Monthly
family income |
||||
|
≤ 10000 |
73 |
73 |
55 |
55 |
|
10001 - 20000 |
19 |
19 |
17 |
17 |
|
20001 - 30000 |
5 |
5 |
18 |
18 |
|
≥ 30001 |
3 |
3 |
10 |
10 |
|
Marital Status |
||||
|
Married |
45 |
45 |
70 |
70 |
|
Unmarried |
55 |
55 |
30 |
30 |
|
Habit and addiction |
||||
|
No |
59 |
59 |
40 |
40 |
|
Yes |
41 |
41 |
60 |
60 |
Table 3
|
Table 3 Frequency and Percentage Distribution of Sample Characteristics in Terms of Types of Habit and Addiction n3 = 41, n4= 60 |
||||
|
|
Rural |
Urban |
||
|
Characteristics |
Frequency |
Percentage |
Frequency |
Percentage |
|
Types of habit and addiction |
||||
|
Smoking
habit |
7 |
17.07 |
26 |
43.33 |
|
Taking of smokeless tobacco |
12 |
29.20 |
13 |
21.60 |
|
Taking of gutkha |
11 |
26.82 |
12 |
20 |
|
Chewing of betel quid, betel nut |
11 |
26.82 |
6 |
10 |
|
Drinking of alcohol |
Nil |
- |
6 |
10 |
|
Multi
response table |
||||
Table 4
|
Table 4 Frequency and Percentage Distribution of Sample Characteristics in Terms of Received Information Regarding Oral Cancer and Family History of Cancer n1 + n2 = (100+100) = 200 |
||||
|
Rural |
Urban |
|||
|
Demographic
variable |
Frequency |
Percentage |
Frequency |
Percentage |
|
Received
information |
||||
|
No |
59 |
59 |
45 |
45 |
|
Yes |
41 |
41 |
55 |
55 |
|
Family history of cancer |
||||
|
No |
99 |
99 |
94 |
94 |
|
Yes |
1 |
1 |
6 |
6 |
Table 5
|
Table 5 Frequency and Percentage Distribution of Sample Characteristics in Terms of Sources of Information Regarding Oral Cancer n3 = 41, n4 = 55 |
||||
|
|
Rural |
Urban |
||
|
Demographic
variable Sources of
information |
Frequency |
Percentage |
Frequency |
Percentage |
|
Mass media |
23 |
56.10 |
43 |
78.18 |
|
Friends and relatives |
3 |
7.32 |
18 |
32.72 |
|
Health professionals |
17 |
41.46 |
8 |
14.54 |
|
Multi response table |
|
|
|
|
Table 6
|
Table 6 Frequency and Percentage Distribution of Sample Characteristics in Terms of Types of Relationship with Family Members who had Cancer n3 = 1, n4 = 6 |
||||
|
Rural |
Urban |
|||
|
Demographic variable Types of relationship |
Frequency |
Percentage |
Frequency |
Percentage |
|
Parent |
Nil |
- |
Nil |
- |
|
Brother |
Nil |
- |
2 |
33.34 |
|
Uncle |
1 |
100 |
2 |
33.34 |
|
Aunty |
Nil |
- |
1 |
16.66 |
|
Cousin |
Nil |
- |
1 |
16.66 |
Table 7
|
Table 7 Frequency and Percentage Distribution of Level of Knowledge Regarding Early Signs of Oral Cancer Among Adults of Rural Community n1 = 100 |
||||
|
Level of knowledge |
Score |
Percentage |
Frequency |
Percentage |
|
Poor |
<8 |
<40 |
33 |
33 |
|
Average |
8-12 |
40-60 |
50 |
50 |
|
Good |
13-16 |
61-80 |
17 |
17 |
|
Very good |
>16 |
>80 |
Nil |
- |
|
Minimum score – 0, Maximum
score - 20 |
||||
Table 8
|
Table 8 Mean, Median and Standard Deviation of Obtained Knowledge Score of Adults of Rural Community n1 = 100 |
||||
|
Variable |
Obtained Range |
Mean |
Median |
Standard Deviation |
|
Knowledge |
4-16 |
9.49 |
9 |
2.95 |
|
Minimum score - 0 |
||||
|
Maximum possible
score – 20 |
||||
Table 9
|
Table 9 Area Wise Mean, Median, SD, Mean % of Knowledge Scores of Adults of Rural Community n1=100 |
||||||
|
Areas of knowledge |
Maximum possible score |
Mean |
Median |
SD |
Mean % |
Rank |
|
Concept |
3 |
1.47 |
1 |
0.69 |
49 |
3 |
|
Risk factors |
2 |
1.17 |
1 |
0.38 |
58.50 |
1 |
|
Early Signs |
11 |
4.69 |
4 |
1.67 |
42.64 |
4 |
|
Prevention and Treatment |
4 |
2.16 |
2 |
1 |
54 |
2 |
Table 10
|
Table 10 Frequency and Percentage Distribution of Level of Knowledge Regarding Early Signs of Oral Cancer Among Adults of Urban Community n2 = 100 |
||||
|
Level of knowledge |
Score |
Percentage |
Frequency |
Percentage |
|
Poor |
<8 |
<40 |
24 |
24 |
|
Average |
8-12 |
40-60 |
34 |
34 |
|
Good |
13-16 |
61-80 |
37 |
37 |
|
Very Good |
>16 |
>80 |
5 |
5 |
|
Minimum score – 0, Maximum score - 20 |
||||
Table 11
|
Table 11 Mean, Median and Standard Deviation of Obtained Knowledge Score of Adults of Urban Community
n2 = 100 |
||||
|
Variable |
Obtained Range |
Mean |
Median |
Standard Deviation |
|
Knowledge |
5-18 |
11.22 |
12 |
3.58 |
|
Minimum score - 0 |
||||
|
Maximum possible
score – 20 |
||||
Table 12
|
Table
12 Area Wise Mean, Median, SD, Mean % of Knowledge Scores of Adults of
Urban Community
n2 = 100 |
||||||
|
Areas of knowledge |
Maximum possible score |
Mean |
Median |
SD |
Mean % |
Rank |
|
Concept |
3 |
1.56 |
1 |
0.82 |
52 |
4 |
|
Risk factors |
2 |
1.26 |
1 |
0.46 |
63 |
2 |
|
Early
Signs |
11 |
5.77 |
6 |
2.11 |
52.45 |
3 |
|
Prevention
and Treatment |
4 |
2.57 |
3 |
1.06 |
64.25 |
1 |
Table 13
|
Table 13 Comparison of the Knowledge Scores Regarding Early Signs of Oral Cancer Among Adults Between Rural and Urban Community n1 + n2 (100+100) = 200 |
||||
|
Knowledge |
Mean |
Mean difference |
SD |
t-value |
|
Rural |
9.49 |
|
2.95 |
|
|
Urban |
11.22 |
1.73 |
3.58 |
3.729*** |
|
t (198) =3.29, p < 0.001*** |
||||
Table 14
|
Table 14 Area Wise Comparison of Knowledge Scores Among Adults of Rural and Urban Community n1 + n2 (100+100) = 200 |
||||||
|
Areas of Knowledge |
Rural |
Urban |
Mean Difference |
T
Value |
||
|
|
Mean |
SD |
Mean |
SD |
|
|
|
Concept |
1.47 |
0.68 |
1.56 |
0.82 |
0.09 |
0.84 |
|
Risk factors |
1.17 |
0.38 |
1.26 |
0.46 |
0.09 |
1.475 |
|
Early
signs |
4.69 |
1.67 |
5.77 |
2.11 |
1.08 |
4.015*** |
|
Prevention
and Treatment |
2.16 |
1 |
2.57 |
1.06 |
0.41 |
2.814** |
|
t
(198) =1.96, p > 0.05, t (198) = 3.29, p < 0.001***, t (198) = 2.58, p
< 0.01** |
||||||
Table 15
|
Table 15 Association Between Knowledge Scores of Adults of Rural Community with Selected Socio- Demographic Variables in Terms of Age, Education, and Occupation n1 = 100 |
|||
|
Demographic
variables |
Knowledge score |
Value of χ2 |
|
|
|
<Median |
≥Median |
|
|
Age (in years) |
|||
|
18 - 33 |
17 |
46 |
|
|
34 – 50 |
26 |
11 |
17.820*** |
|
Education |
|||
|
≤ Secondary |
33 |
9 |
|
|
>Secondary |
10 |
48 |
37.383*** |
|
Occupation |
|||
|
Unemployed |
27 |
41 |
|
|
Employed |
16 |
16 |
0.941 |
|
df (1) = 10.83, p < 0.001***, df (1) = 3.84, p> 0.05 |
|||
Table 16
|
Table 16 Association Between Knowledge Scores of Adults of Rural Community with Selected Socio- Demographic Variables in Terms of Monthly Family Income, Habit, and Addiction and Information Regarding Oral Cancer n1 = 100 |
|||
|
Demographic
variables |
Knowledge score |
Value of χ2 |
|
|
|
<Median |
≥Median |
|
|
Monthly family income (in Rs.) |
|||
|
≤10000 |
35 |
46 |
|
|
>10000 |
8 |
11 |
2.698 |
|
Habit and addiction |
|||
|
No |
18 |
9 |
|
|
Yes |
25 |
48 |
9.161** |
|
Received Information |
|||
|
No |
28 |
41 |
|
|
Yes |
15 |
16 |
1.167 |
|
df (1) = 3.84, p> 0.05, df
(1) = 6.63, p < 0.01** |
|||
Table 17
|
Table 17 Association Between Knowledge Scores of Adults of Urban Community with Selected Socio- Demographic Variables in Terms of Age, Education and Occupation n2 = 100 |
|||
|
Demographic
variables |
Knowledge score |
Value of χ2 |
|
|
|
<Median |
≥Median |
|
|
Age (in years) |
|||
|
18 – 33 |
16 |
29 |
|
|
34 – 50 |
30 |
25 |
3.593 |
|
Education |
|||
|
≤Secondary |
36 |
10 |
|
|
>Secondary |
10 |
44 |
35.692*** |
|
Occupation |
|||
|
Unemployed |
16 |
22 |
|
|
Employed |
30 |
32 |
0.374 |
|
df = 1(3.84), p> 0.05, df
(1) = 10.83, p < 0.001*** |
|||
Table 18
|
Table 18 Association Between Knowledge Scores of Adults of Urban Community with Selected Socio - Demographic Variables in Terms of Monthly Family Income, Habit, and Addiction, Information Regarding Oral Cancer and Family History of Cancer n2 = 100 |
|||
|
Demographic
variables |
Knowledge score |
Value of χ2 |
|
|
|
<Median |
≥Median |
|
|
Monthly family income (in Rs.) |
|||
|
≤10000 |
35 |
20 |
|
|
>10000 |
11 |
34 |
15.304*** |
|
Habit and addiction |
|||
|
No |
8 |
32 |
|
|
Yes |
38 |
22 |
18.143*** |
|
Received Information |
|||
|
No |
31 |
14 |
|
|
Yes |
15 |
40 |
17.256*** |
|
Family
History of Cancer |
|
|
|
|
No |
42 |
52 |
|
|
Yes |
4 |
2 |
0.39 |
|
df (1) = 10.83, p< 0.001***, df
(1) = 3.84, p > 0.05, yate’s correction done |
|||
CONFLICT OF INTERESTS
None.
ACKNOWLEDGMENTS
None.
REFERENCES
American Cancer Society (n.d). About Oral Cavity and Oropharyngeal Cancer.
American Cancer Society (n.d.). Risk Factors for Oral Cavity and Oropharyngeal Cancers.
Asthana, S., Patil, R.S., & Labani, S. (2016). Tobacco-Related Cancers in India : A Review of Incidence Reported from Population- Based Cancer Registries. Indian J Med Pediatric Oncol, 37(3), 152-157. https://doi.org/10.4103/0971-5851.190357.
Coelho, K. R. (2012). Challenges of the Oral Cancer Burden in India. J Cancer Epidemiol.
Hajdu, S. I. (2011). A Note From History : Landmarks in History of Cancer, part 1. Cancer, 117(5), 1097–1102. https://doi.org/10.1002/cncr.25553.
Jethwa, A.R., & Khariwala, S.S. (2017). Tobacco-Related Carcinogenesis in Head and Neck Cancer. Cancer Metastasis Rev., 6(3), 411-423.
Kadammanavar, M., Angolkar, M., Hirachand, A.D., Sah, J.K., & Karikati, S. (2015). Awareness about Oral Cancer and Its Risk Factors among Rural Adult Population of Belagavi City, India. Int J Health Sci Res,5(7), 295-300.
Park. K. (2021). Park’s Textbook of Preventive and Social Medicine, (26th ed.) 6, Non Communicable Diseases, 433-434.
Redhu, A., Suman, B., Venugopal, M., & Iyengar, S. (2020). Assessment of Awareness and Knowledge About Oral Cancer Among Dental Patients in Bengaluru. Onco Expert, 6(1), 01-08.
Selvaraj, K. (2019). A Comparative Study to Assess the Level of Knowledge on Oral Cancer Among Adults in Rural and Urban Area. Paripex Ind J Res, 8(8), 1-3.
Sundresh, N.J., Aswathy, G., John, J., & Gupta, S. (2016). Assessment of the Effectiveness of Planned Teaching Programme on Awareness and Knowledge of Oral Cancer Among Factory Workers in Pune. Int J Sci Stud, 4(8), 215-218.
Sung, H., Ferlay, J., Siegel, R. L., Laversanne, M., Soerjomataram, I., Jemal, A., & Bray, F. (2021). Global Cancer Statistics 2020 : GLOBOCAN Estimates of Incidence and Mortality Worldwide for 36 Cancers in 185 Countries. CA : a cancer Journal For Clinicians, 71(3), 209–249.
 This work is licensed under a: Creative Commons Attribution 4.0 International License
© Granthaalayah 2014-2023. All Rights Reserved.