
PSO BASED HARMOIC MITIGATION IN SINGLE PHASE SINE WAVE VOLTAGE SOURCE INVERTER
Spencer Prathap Singh N.M 1![]() , T. Ajitha 2
, T. Ajitha 2
1 Professor,
Department of EEE, C.S.I. Institute of Technology, Thovalai,
Kanyakumari, Tamilnadu, India
2 Assistant
Professor, Department of ECE, St. Xavier’s Catholic College of Engineering, Chunkankadai, Kanyakumari, Tamilnadu,
India
|
|
|
ABSTRACT |
|
|
This paper
explains the pruning of power harmonics in a single-phase voltage source
inverter using PI controller by calculating the optimized values of PI
constants by Particle Swarm Optimization (PSO) Algorithm. The mapping state
space model of the sine wave inverter was formulated by considering the
operating sequence of full bridge sine wave inverter. The controller acts
effectively thereby reducing the voltage and current THDs in an inverter. The
PSO technique is implemented which estimates the optimized parameters of
constant for PI controller thereby tuning the controller for reducing the
total harmonics of a full bridge inverter. The MATLAB / SIMULINK tool and
experimental verifications are done for harmonic reduction, and it is found
that its harmonics were reduced well than IEEE standards with improved
transient response. |
|||
|
Received 16 July 2023 Accepted 17 August 2023 Published 31 August 2023 Corresponding Author Spencer
Prathap Singh N.M, spencerps@rediffmail.com DOI 10.29121/granthaalayah.v11.i8.2023.5229 Funding: This research
received no specific grant from any funding agency in the public, commercial,
or not-for-profit sectors. Copyright: © 2023 The
Author(s). This work is licensed under a Creative Commons
Attribution 4.0 International License. With the
license CC-BY, authors retain the copyright, allowing anyone to download,
reuse, re-print, modify, distribute, and/or copy their contribution. The work
must be properly attributed to its author.
|
|||
|
Keywords: Voltage Source Inverter, Particle Swam
Optimization Algorithm, Total Harmonic Distortion, PI Controller |
|||
1. INTRODUCTION
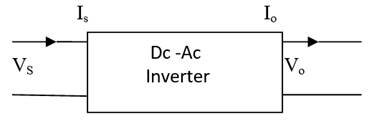
The dc-ac converter is conventionally called the inverters. The main role of an inverter is to obtain a pure sinusoidal output signal of typical magnitude and frequency for a varying dc voltage. Inverters used for low powers are of usually single-phase type. The voltage source inverters are independently controlled ac output is a voltage wave pattern. The output voltage waveform of an inverter must remain constant and unaffected by the load variation. Due to the inherent property of an inverter such as constant output voltage, reduced cost effectiveness with simpler design, the VSI have been widely used in variable speed drives (VSD), induction heating, standby power supplies, uninterruptible power supplies (UPS), traction, HVDC, FACTS, Grid connection of Renewable energy sources Hsich et al. (2009), Azim & Rahman (2013), Singh & Nair (2013), Azab (2009).
Figure 1
|
Figure 1 Block Diagram of Inverter System |
Inverters derived from Voltage Source Inverters (VSI) are ideally suited for supplying power to a resistive and inductive load to the applications that require constant torque operations of ac motors. The low-pass filter at the output terminal is employed to reduce high frequency components of the non-sinusoidal signal. A series inductor is a current smoother and a parallel capacitor is a voltage smoother. The objective of harmonic profiling is to bolster the magnitude of the fundamental component of the output voltage and the elimination or reduction of high order harmonics. Conventionally the techniques such as notching, stepping, multiple pulses per cycle, PWM techniques, etc. are adopted to achieve desired wave-shaping of the output waveform Onah (2012), Wells et al. (2007), Ghosh & Narayanan (2007), Gusseme et al. (2007), Figueres et al. (2007), Lo et al. (2007), Zhang et al. (2006), Ye & Jovanovic (2005). The Total Harmonic Distortion (THD) of a signal is a measurement of the harmonic distortions present and is defined as the ratio of the sum of all powers of harmonic components to the power of the fundamental frequency. THD is used to characterize the linearity of audio systems as well as the power quality of electric power systems Jovanovic & Jang (2005).
2. ANALYSIS OF SINGLE PHASE SINE WAVE INVERTER
Full bridge sine wave inverter uses four power switches with two switches in each arm with antiparallel freewheeling diodes for discharging the reverse current. In case of R-L load, the reverse load current flow through these diodes. These diodes provide an alternate path for discharging the stored inductive current whenever the main power device in OFF condition.
Figure 2

|
Figure 2 Power MOSFET Based Sine Wave Inverter |
Table1
|
Table 1 ON- OFF Sequence for Full Bridge Converter |
||||||
|
T1 |
T2 |
T3 |
T4 |
VA |
VB |
VC |
|
ON |
OFF |
OFF |
ON |
|
|
VS |
|
OFF |
ON |
ON |
OFF |
|
|
-VS |
|
ON |
OFF |
ON |
OFF |
|
|
0 |
|
OFF |
ON |
OFF |
ON |
|
|
0 |
Two diagonal switches are operated alternatively among the four switches in the circuitry. A small dead time is provided during the sequence of switching in order to avoid short circuit during operation. The bridge devices are operated such that the output voltage is shifted with change in polarity. If the shift angle is zero, the output voltage is also zero and the maximal when shift angle is π.
If a periodic voltage waveform is expressed in terms of its Fourier series in the form:
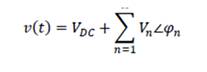 Equation 1
Eqn. (1) depicts the votage magnitude interms of fundamental and harmonic component frequencies. The rms value of voltage can be written as,
 Equation 2
The ‘n’order rms value of the harmonic is represented as follows:
 Equation 3
Rearranging and considering the fundamental frequency voltage component, Eqs. (2) can be written as follows:
 Equation 4
The magnitude of the voltage distortion can be expressed as follows:
 Equation 5
Total voltage Harmonic Distortion (THD) is the ratio of the voltage magnitude of the distortion components to the voltage magnitude of the fundamental frequency component and is expressed as follows:
 Equation 6
In terms of the rms value of the voltage waveform, THD can be specified as follows:
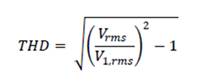 Equation 7
3. MATHEMATICAL MODELLING OF SINE WAVE VSI
In this section the mathematical modelling of a voltage fed single phase sine wave inverter using sinusoidal pulse width modulation is considered with the assumption of chosen ideal components. The control variable u=1, is considered for the below circuitry when power devices SA and SD are operated whereas u=0, is considered for SB and SC.
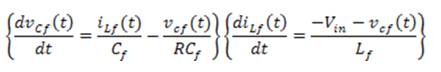
Mode 1: When Control variable u= 1, positive half wave is generated by turning ON the switches SA and SD. Figure 3 depicts the current flow direction, and the state space representation is given in (8).
 Equation 8
Figure 3
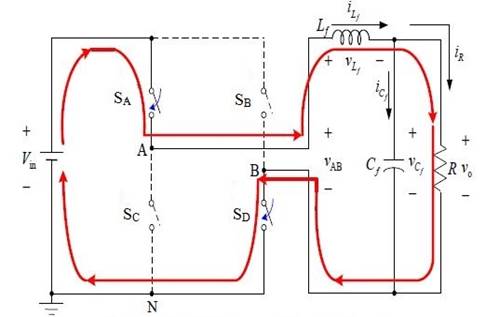
|
Figure 3 Mode 1 Operation When Turning ON SA and SD |
Mode 2: When Control variable u= 0, negative half wave is generated by turning ON the switches SB and SC. Figure 4 depicts the current flow direction and the state space representation is given in (9).
 Equation
9
Equation
9
Figure 4

|
Figure 4 Mode 2 Operation When Turning ON SB and SC |
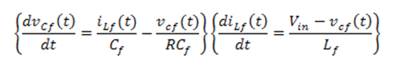
Combining Equations (8) and (9) with controlled variable u∈ {0, 1}, the following state space equation (10) can be formulated.
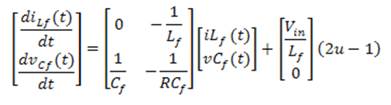 Equation 10
Table 2
|
Table 2 Specifications of Voltage Source Inverter (VSI) |
|
|
List of
items |
Specifications |
|
DC
Voltage, Vin |
15V |
|
Output Resistance,Ro |
50 ohm |
|
Filter
Inductance, Lf |
2 mh |
|
Filter
Capacitance, Cf |
500 µf |
|
Reference
Signal, Vref |
5V ,50 Hz |
|
Load
waveform |
Sine wave |
|
Switching
Frequency, f |
7.69KHZ |
|
PI
Controller constants |
K p=19,
K i=7.1 |
|
PI
Controller constants with PSO (Particle Swarm Optimization) Technique |
K p=20,
K i=5.0 |
|
Overload
Capacity |
110% Continues |
|
Inverter
Efficiency |
˃90% |
4. PARTICLE SWARM OPTIMIZATION (PSO) TECHNIQUE
Kennedy and Eberhart1 developed Particle Swarm Optimization (PSO) in the middle of the 1990s while attempting to simulate the graceful, choreographed motion of flocks of birds as part of a sociocognitive study looking into the idea of "collective intelligence" in biological populations. PSO uses a significant quantity of information about the design space that is assimilated and shared by all members of the swarm to spread a collection of randomly generated solutions (the initial swarm) in the design space in the direction of the best solution over a number of iterations (moves). The "information sharing" strategy used by herds of animals, flocks of birds, and schools of fish to adapt to their environment, find abundant food supplies, and escape predators has served as the inspiration for PSO. A full history of the PSO algorithm's development shows how it evolved from a simple motion simulator to a heuristic optimization strategy. Initially being inspired by flocks of birds. In a way similar to genetic algorithms, particle swarm optimization (PSO) is an example of an evolutionary computation that is stochastic in nature. We have a fixed number of particles that travel through the problem's hyperspace as opposed to a constantly perishing and evolving GA population. Both a particle remembering its own previous best location and the collective group's (or flock's, or swarm's) best overall position are necessary to find a minimization (or maximization) of the issue topology. A benefit of this technique has been demonstrated without a significant computing cost. The PSO algorithm is based on the idea that complicated behavior may be predicted using just a few basic rules.
In dimensional search space, each particle is specified by two vectors: the position vector Xi = [Xi1, Xi2....... XiD] and the velocity vector Vi = [Vi1, Vi2,...,ViDl. Through its current velocity, past experience, and the experience of nearby particles, each particle in the swarm narrows its search. The best particle position that I have so far discovered is known as the personal best and is denoted by Pi = [Pi1, Pi2,..., PiD], while the best position in the entire swarm is known as the global best and is marked by Pg = [Pg1, Pg2,..., PgD]. The position of that particle is modified after updating its velocity on the dth dimension.
![]() Equation 11
Equation 11
![]() Equation 12
Equation 12
where the cogitative and social factors, respectively, are Φ1 and Φ2. In these equations, r1 and r2 are uniformly distributed random variables between [0, 1]. The velocity of the ith particle at iteration't', Vi(t), must fall between the following range:
![]() Equation 13
Equation 13
The region between the current position and the target position will be searched with a resolution, or fitness, that is determined by the parameter Vdmax. Particles might fly past effective solutions if Vd max is set too high. Particles may not sufficiently explore beyond local solutions if Vdmax is set too low. Each particle is drawn toward the pbest and gbest places by the constants C1 and C2. Particles can travel far from the target regions with low values before being pulled back. High numbers, on the other hand, cause sudden movement towards or past target zones. Therefore, based on prior experiences, the acceleration constants C1 and C2 are frequently adjusted to 2.0. Finding a sufficiently optimal solution typically requires less iterations when the inertia weight is chosen appropriately. This is because it strikes an appropriate balance between global and local explorations. In its original form, frequently drops linearly throughout the course of a run, from roughly 0.9 to 0.4. Typically, the following equation is used to get the inertia weight.
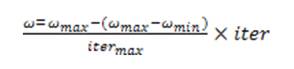 Equation 14
where ω- the weight of inertia, ω max-maximum weighting factor value, ωmin- minimum weighting factor value, itermax- Iterations maximum, iter - current value of iteration, The following equation describes how each person moves from their present location to their next one using a modified velocity.
![]() Equation 15
Equation 15
4.1. Steps for PSO Algorithm
1) Initialize the PSO parameters.
2) Compute the objective function at the initial position.
3) Evaluate the position.
4) Repeating this algorithm with fixed number of iteration.
5) Obtain the Gbest value.
6) Apply the Gbest value in the output.
7) Repeat this until harmonics are eliminated.
A population-based evolutionary method known as PSO has various benefits, including a derivative-free algorithm and a reduced sensitivity to the characteristics of the objective function. These methods, which are based on swarm intelligence, change and steer clear of local minima by changing a small number of parameters. With simple logical and mathematical procedures, the PSO approach is simple to implement. It is also capable of handling stochastic objective functions and does not need a solid initial solution to begin its iterative process In the particle swarm optimization method, only one population advances toward the global optimal point throughout each iteration. This is in contrast to the standard evolutionary programming method, which must deal with two populations at each iteration: the parents and the children. As a result, PSO method computation speed is increased. Aje & Josephat (2020)
Figure 5

|
Figure 5 Flowchart of PSO Method |
Figure 6

|
Figure 6 Closed Loop Simulation of a VSI Using PI Controller for PSO Algorithm |
The VSI with PI Controller Simulink block diagram is displayed in Figure 6. Response time is accelerated and steady state error is eliminated by combining proportional and integral terms. The controller's output to a full bridge power inverter with optimal Kp and Ki values of 18.2 and 7.8, respectively. The Simulink blocks are used to estimate the Voltage and Current Harmonics Percentage THD Values. Plotted are the response curves for the single-phase inverter's voltage and current harmonics.
5. SIMULATION RESULTS
The simulink output voltage waveforms corresponding to PSO algorithm is shown in Figure 7. The output current waveforms using PSO algorithm shown in Figure 8.
Figure 7

|
Figure 7 Voltage Harmonics Using PSO Algorithm |
Figure 8

|
Figure 8 Current Harmonics Using PSO Algorithm |
For PSO technology, the output voltage magnitude remains constant without overshoots. PSO algorithms result in overshooting of the output current waveform. The controller works well, reduces overshoots, and stabilizes the waveform with less distortion in the case of PSO algorithm.
6. CONCLUSION
An optimization algorithm of PSO is proposed to reduce both harmonics of the voltage and current in the single-phase inverter Load. An automatically tuned PI controller-based Particle swarm optimization is used to achieve reduced Total harmonics comparatively lesser than the guidance given in the IEEE standard 519-1992. The harmonics are minimized more effectively utilizing the PSO Algorithm when applying the aforementioned optimization strategies. According to the simulation findings shown above, the converter functions effectively in both steady-state and dynamic inverter circumstances with changing Line and Load conditions.
CONFLICT OF INTERESTS
None.
ACKNOWLEDGMENTS
None.
REFERENCES
Aje, O. F., & Josephat, A. A. (2020). The Particle Swarm Optimization (PSO) Algorithm Application-A Review. Global Journal of Engineering and Technology Advances, 3(3), 001–006. https://doi.org/10.30574/gjeta.2020.3.3.0033.
Azab, M. (2009). Global Maximum Power Point Tracking for Partially Shaded PV Arrays Using Particle Swarm Optimization. International Journal of Renewable Energy Technology, 1(2), 211–235. https://doi.org/10.1504/IJRET.2009.027991.
Azim, I., & Rahman, H. (2013). Harmonics Reduction of a Single Phase Half Bridge Inverter. Global Journal of Researches in Engineering Electrical and Electronics Engineering, 13(4), 8–12.
Figueres, E., Benavent, J. M., Garcera, G., & Pascual, M. (2007). A Control Circuit with Load-Current Injection for Single-Phase Power-Factor-Correction Inverters. Industrial Electronics IEEE (Trans.), 54(3), 1272–1281. https://doi.org/10.1109/TIE.2007.891987.
Ghosh, R., & Narayanan, G. (2007). Generalized Feed Forward Control of Single Phase PWM Inverters Using Disturbance Observers. IEEE Transactions on Industrial Electronics, 54(2), 984–993. https://doi.org/10.1109/TIE.2007.892103.
Gusseme, K. D., Van de Sype, D. M., Van den Bossche, A. P. M., & Melkebeek, J. A. (2007). Input-Current Distortion of CCM Boost PFC Converter Separated in DCM. IEEE Transactions on Industrial Electronics, 54(2), 858–865. https://doi.org/10.1109/PESC.2003.1217710.
Hsich, F.-H. Po- LUN Chang, Ying- Shiuchen, hen- Kung Wang,Yonq, Jonq- Chin Hwang. (2009). Fast- Scale Instability Phenomena and Chaotic Control of Voltage Control Single-Phase Full –bridge Inverter via Varying Load resistance, ICIEA, 3422–3427. https://doi.org/10.1109/ICIEA.2009.5138837.
Jovanovic, M. M., & Jang, Y. (2005). State of-the-Art, Single-Phase, Active Power Factor-Correction Techniques for High Power Applications—An Overview. IEEE Transactions on Industrial Electronics, 52(3), 701–708. https://doi.org/10.1109/TIE.2005.843964.
Lo, Y. K., Lin, J. Y., & Ou, S. Y. (2007). Switching-Frequency Control for Regulated Discontinuous-Conduction Mode Boost Inverters. IEEE Transactions on Industrial Electronics, 54(2), 760–768. https://doi.org/10.1109/TIE.2007.892104.
Onah, A. J. (2012). Harmonics Generation and Suppression in AC System Networks. Nigerian Journal of Technology, 31(3), 293–299. https://doi.org/10.4314/njt.313.556.
Singh, S. P., & Nair, K. (2013). Intelligent Controller for Reduction of Total Harmonics in Single Phase Inverters. American Journal of Applied Sciences, 10(11), 1378–1385. https://doi.org/10.3844/ajassp.2013.1378.1385.
Wells, J. R., Geng, X., Chapman, P. L., Krein, P. T., & Nee, B. M. (2007). Modulation–Based Harmonic Elimination. IEEE Transactions on Power Electronics, 22(1), 336–340. https://doi.org/10.1109/TPEL.2006.888910.
Ye, Z.Z., & Jovanovic, M. M. (2005). Implementation and Performance Evaluation of DSP-Based Control for Constant-Frequency Discontinuous Conduction-Mode Boost PFC front end. IEEE Transactions on Industrial Electronics, 52(1), 98–107. https://doi.org/10.1109/TIE.2004.841131.
Zhang, W., Feng, G., Liu, Y. F., & Wu, B. (2006). New Digital Control Method for Power Factor Correction. IEEE Transactions on Industrial Electronics, 53(3), 987–990. https://doi.org/10.1109/TIE.2006.874255.
 This work is licensed under a: Creative Commons Attribution 4.0 International License
© Granthaalayah 2014-2023. All Rights Reserved.

