THE IMPACT OF ENVIRONMENTAL, SOCIAL, AND GOVERNANCE (ESG) ON THE ECONOMIC GROWTH OF ASEAN-5 COUNTRIES
Nur Syazwina
Ghazali 1![]() , Siti Nurazira Mohd Daud 2
, Siti Nurazira Mohd Daud 2![]() , Nur Hafizah Ismail 3
, Nur Hafizah Ismail 3![]()
1, 2, 3 School of Economics, Finance and
Banking, Universiti Utara Malaysia, 06010 UUM Sintok, Kedah, Malaysia
|
|
|
ABSTRACT |
|
|
ESG program
has become crucial for long-term value and business resiliency through
efficient use of natural resources and effective policies on social and
economic aspects. A country which has a good ESG performance would achieve
higher economic growth. This study examines the ESG country-level performance
across the ASEAN-5 by assessing the impact of ESG on economic growth. The
study utilized annual data from 1990 to 2020 for five countries - Indonesia,
Malaysia, the Philippines, Singapore, and Thailand. This study constructs the
ESG index at the country level by employing frequency statistics of text
mining and factor analysis for each country over time. Establishing an ESG
country index would better reflect the ASEAN-5 nation's progress in ESG
practices. Besides that, the ARDL method was employed to establish the
relationship between ESG and economic growth. The results revealed mixed
impacts of ESG on economic growth, which can be attributed to the variations
in ESG practices and policies across the countries. Some results showed a
significant positive impact of ESG practices on economic growth, while others
showed no significant or negative impact. This study emphasizes the
importance of a suitable ecosystem that supports the effectiveness of ESG
adoption. This study recommends several precautionary policies, such as
low-interest loans, grants, and tax relief, to support a firm's resilience
during pandemics. |
|||
|
Received 13 May 2023 Accepted 14 June 2023 Published 30 June 2023 Corresponding Author Nur Syazwina Ghazali, syazwinaghazali@gmail.com DOI 10.29121/granthaalayah.v11.i6.2023.5194 Funding: This research
received no specific grant from any funding agency in the public, commercial,
or not-for-profit sectors. Copyright: © 2023 The
Author(s). This work is licensed under a Creative Commons
Attribution 4.0 International License. With the
license CC-BY, authors retain the copyright, allowing anyone to download,
reuse, re-print, modify, distribute, and/or copy their contribution. The work
must be properly attributed to its author.
|
|||
|
Keywords: ESG, ASEAN-5 countries, Principal
Component Analysis, Economic Growth JEL Classifications: Q01, O40, E02, C22 |
|||
1. INTRODUCTION
Encouraging sustainable development appeals to individuals worldwide who aim to safeguard the environment and guarantee their well-being. The significance of sustainable development lies in its ability to foster economic growth while ensuring that environmental harm is minimized, and future generations' needs are not compromised by current development efforts NEF. (2015). The Sustainable Development Goals (SDGs) are a crucial component of the United Nations (UN) 2030 Agenda, which seeks sustainable development. These objectives require the active participation of various stakeholders, such as individuals, corporations, governments, and nations globally. In an effort to align their operations with the SDG objectives, profit-maximizing enterprises have incorporated the environmental, social, and governance (ESG) agenda into their business practices. The SDGs and the ESG frameworks aim to promote sustainability by addressing environmental and social issues. However, while the SDGs apply to all stakeholders, including countries and the general public, ESG primarily focuses on the business community and individual firms. Therefore, while corporations are essential stakeholders in achieving sustainable development, it is vital to ensure that ESG practices are inclusive and involve collaboration between all relevant stakeholders, including governments, non-governmental organizations (NGOs), and civil society.
ESG
investing has become a crucial component of global investment strategies and
has garnered the attention of policymakers, investors, and the public for
promoting sustainable business practices Boffo and Patalano (2020). Every country in the United
Nations has agreed to implement the 2030 Agenda for Sustainable Development.
ESG integration is a key strategy for sustainable investing in the US, Canada, Australia,
New Zealand, and Asia (apart from Japan). In contrast, in Japan, corporate
involvement and shareholder action are the main investment components.
ESG-integrated investment techniques are still in their early phases in Asia
yet have great potential for development
GSIA. (2016). According to the 37th ASEAN
Summit's Implementation Plan for the ASEAN Comprehensive Recovery Framework,
significant areas of attention for a sustainable and resilient future in ASEAN
include circular economy, sustainable energy, green infrastructure, sustainable
investment, and sustainable financing ASEAN. (2020).
Further,
in term of the relation between ESG and country’s economic growth can be viewed
in many ways. Firstly, ESG may serve as a safeguard, lowering risk and ensuring
market efficiency. A strong non-financial performance on ESG problems may
contribute to developing trust between investors and organizations Margaretic and Pouget (2018). Secondly, the active integration
of ESG policies into corporate decision-making will increase GDP growth,
demonstrating to stakeholders, investors, investors, and policymakers that ESG
policy implementation across sectors will result in macroeconomic benefits Zhou et al. (2020).
The implementing
ESG policies can facilitate a smoother transition to a more sustainable and
low-carbon economy by encouraging companies to prioritize sustainable business
practices and promote long-term value creation over short-term profits. For example,
investing in renewable energy infrastructure and sustainable transportation
systems can create jobs and stimulate economic growth while reducing carbon
emissions. However, different countries may have unique circumstances and
regulations that affect their approach to ESG and their ability to integrate
ESG practices into their business operations. These unique characteristics
could be related to a country's regulatory framework, policies, or other
factors that influence how businesses operate and are regulated.
Further, ASEAN-5 countries are concerned about more
accurate data, dispersed standards and disclosure laws, and insufficient
regulatory monitoring to prevent greenwashing. The
exchange rate performance and government involvement in ESG investment policies
of the ASEAN-5 nations vary significantly. Unfortunately, several obstacles
hinder these regulations' effectiveness and dependability. For instance, Windolph (2011) listed six issues: inconsistency, unreliable information, bias,
trade-offs, lack of openness, and independence. In addition, Billio et al. (2021) argued that the low overlap of ESG indexes, which results from
differences in ratings provided by rating agencies, weakens the impact of ESG
investors' preferences on asset prices, thereby nullifying any influence on
financial performance, even for the ESG agreement portfolio. Since the
information used to determine an ESG rating and indexes varies from one rating
agency to another, there is room for disagreement about the current ESG rating
and indexes.
Nevertheless, among the obstacles
to ESG implementation, firms in the Philippines and other countries have
diverse ESG risk exposure, goals, and possibilities. An existing obstacle is
the absence of a universal rating, reporting, and benchmarking system for ESG
performance. This is consistent with the ESG, UN SDGs, and Climate Change
Strategy in Indonesia (2022), which stated that the limitations of ESG
ratings and the absence of a defined system for measuring ESG effect further
reduce the value of external, third-party evaluations. According to the ASEAN. (2022) report, the pandemic has had far-reaching
effects on businesses. The pandemic has expedited specific pre-existing trends
in ASEAN, which must be reconsidered if the region wants to develop a more
conducive working climate post-pandemic. One such trend is the diversification
of supply chains from China to ASEAN, which has greatly helped businesses,
including producing electric vehicles in Thailand and developing sustainable solar
energy in Malaysia. To reduce the effects of automation and digital technology,
it is essential to focus on labor retraining and career routes is essential.
Existing studies on ESG
performance and economic growth among ASEAN-5 countries are scarce. In fact, to
the best of our knowledge, previous studies on ESG practices for economic
growth in the ASEAN-5 context have not been done yet. Many studies only focus
on ESG practices for economic growth in the United Kingdom and other Europe
countries Avetisyan and Hockerts (2017), Eccles and Viviers (2011), Luo (2022), Zhang et al. (2022), Bannier et al. (2019), De Lucia et al. (2020), and Sassen et al. (2016). In fact, according to Mahi et al. (2020), ASEAN-5 countries have the fastest-growing emerging markets compared
to other countries. Therefore, studying ESG performance and economic growth
among ASEAN-5 countries is pertinent. Besides that, ESG is a relatively new
development concept that previous scholars and researchers have addressed as a
broad term for sustainable development; this study contributes to the
literature by constructing a new ESG country index and determining their
effects on economic growth in ASEAN-5 countries.
Billio et al. (2021) explored the disagreement between ESG rating agencies and its
consequences on identifying ESG index constituents. This issue is pertinent
given the absence of data and the limited availability of reliable information
on the present ESG index. Thus, this study uses a text-mining approach to
construct an ESG country index score and assess the impact of ESG on economic
growth in the ASEAN-5 countries. This study will employ data mining techniques,
specifically the text mining word frequency statistic, to analyze news articles
related to ESG. This will help to gauge the level of attention given to ESG
issues.
This study provides three approaches. First, the study
constructs an ESG country index score that better reflects the evolution of ESG
throughout the ASEAN-5 countries. By using Google Trend analytics (which
provides access to a large sample of search requests), it is possible to
observe the evolution of ESG on economic growth in the ASEAN-5 countries.
Second, the ARDL method was employed to establish the relationship between ESG
and economic growth. Third, the study reviews the changes in the economic cycle
or shock, particularly the pandemic crisis.
The remainder of this study is organized as follows.
Section 2 explained the literature review, and Section 3 includes the model
construction, explaining the development of the main constructs and detailing
how data were collected and synthesized. Section 4 analyses the empirical
results and conducts a robust check and Section 5 summarizes the conclusions,
main contributions, limitations and provides practical implications for
policymakers.
2. Literature review
Romer's (1990) endogenous growth theory posits that
internal forces inside the economic system, as opposed to external pressures,
are responsible for sustained economic growth. This theory challenges the
neoclassical perspective by proposing that economic considerations influence
the rate of technological innovation and, consequently, the rate of long-term
economic growth. This theory begins with the observation that technological
growth results from innovation, which primarily manifests as new products,
processes, and markets as a result of economic activity. According to the
endogenous growth theory, economic incentives to attract or retain corporate
operations positively influence long-term growth. One of the first things that
come to mind when focusing on this concept is that it requires investments in
knowledge, human capital, research, and development (R&D), innovation, and
direct investments in physical assets and basic labor. Therefore, increasing
investment would increase production capacity and stimulate economic expansion.
Investing in skills and education, for example, will increase labor
productivity. Additionally, increasing new technology and capital will boost
the economy's productivity and production capacity.
ESG Ratings and Indexes
According to Avramov et al. (2022), Brandon et al. (2021), Landi et al. (2022) and Shaikh (2022), investors face uncertainty when making
sustainable investments due to the difficulty in accurately assessing a firm's
actual ESG profile. Avramov et al. (2022) conducted a study using ESG rating data from six
different sources, namely Asset4 (Refinitiv), MSCI KLD, MSCI IVA, Bloomberg,
Sustainalytics, and RobecoSAM, all of which are market leaders in ESG ratings
and widely used by practitioners and researchers. The study found that rating
ambiguity leads investors to perceive the market as riskier, which drives up
market premiums and reduces investor demand. Next, Brandon et al. (2021) analyzed the same
database and determined that screening and ESG integration are the two most
widely used approaches in responsible investing. However, ESG data tends to be
limited to larger companies and more recent years. In another study, Landi et al. (2022) utilized double risk
measurement and panel data analysis to examine the influence of firm social
performance on corporate financial risk, as measured by an ESG evaluation.
Increasing investor uncertainty regarding corporate sustainability performance
is likely due to conflicting objectives between investors and investees.
Furthermore, Shaikh's (2021) study investigates
the relationship between the ESG-based sustainability index and economic policy
uncertainty (EPU) utilizing multiple indices, including the EPU index, equity
market policy uncertainty index, and economic and political developments. The
research demonstrates a significant negative correlation between the Dow Jones
Sustainability Index (DJSI) and policy unpredictability. In addition, the
results indicate that socially responsible investment (SRI) is more resilient
than conventional equity investing because it is not affected by political and
economic volatility. The empirical evidence supports the conclusion that SRI
investing is not susceptible to political and economic environmental
fluctuations. Next, Escrig-Olmedo et al. (2019) investigated the evolution of criteria used by ESG rating agencies in
the past decade. The study analyzed data from leading ESG rating and
information providers in the financial sector between 2008 and 2018, comparing
the changes in their assessment models. Despite updates to include new criteria
to reflect emerging opportunities and threats, the research found that ESG
rating agencies still need to fully integrate sustainability principles into
their evaluation process of corporations' sustainability.
ESG and Country Economic Growth
To the best of our knowledge only a few research that measure the development of ESG at the country level. The literature regarding ESG, and country economic growth implies that countries with good ESG performance should have higher long-term economic growth, while the short-term effect is less clear. A study by Kocmanová and Dočekalová (2012) examined the method for assessing a company's economic performance in the Czech Republic concerning ESG indicators. It advocated that economic performance indicators enable businesses to assess their economic performance and contribute value toward sustainability. This means that companies should be able to monitor their economic performance and add value to achieve long-term sustainability using the specified economic performance indicators. Ferktaji (2019) utilized the Granger causality test to investigate the link between ESG performance and economic growth in 118 countries from 1999 to 2015. The research showed that the relationship between environmental and social performance and economic growth is bidirectional, while the link between governance and growth is unidirectional for all nations. However, the findings for different socioeconomic categories of countries are inconclusive, in contrast to the clear overall pattern observed in the entire sample.
Furthermore, Yawika and Handayani
(2019), in their studies within Indonesia, found
that the effectiveness of corporate governance has a beneficial impact on financial reporting
but a negative impact on the stock market. Using multiple regression analysis to study the
relationship between ESG performance and economic performance, neither
corporations nor investors
take environmental and social performance into account. Regarding
stakeholder management, there need to be
more information and sustainability measures
that are irrelevant. Also, on the negative
impact, a previous study discovered uncertainty regarding ESG practices and claimed that ESG
performance might inhibit growth
(Meher et al., 2020). According to the study, ESG
goals and regulations necessitate a high consumption and production process, which will limit economic growth.
As goods and services
already require energy
to be produced, reducing
energy consumption, or switching to more expensive kinds of energy will inevitably diminish
the economic output.
Within the ASEAN-5 context, a lesser focus is placed
on economic growth. A study done by (Tarmuji et al., 2016) compared ESG with economic growth in two countries which
are Singapore and Malaysia, by using panel data analysis and data extracted
from ASSET4® database of Data- Stream, by Thomson Reuters Incorporation. Using
economic growth as the dependent variable and ESG practices as the independent
variables, the researchers discovered that social and governance practices
significantly impacted economic growth. Compared to the United States and
Europe, Malaysian and Singaporean companies' ESG indices are still in their
early stages of development.
The Impact of the Pandemic Crisis on
Economic Growth
The empirical research on the influence of the
pandemic crisis on economic growth has been growing in recent years as
researchers seek to understand the extraordinary shocks that the pandemic has
created, taking into account the cross-country spillovers of the virus. Also,
from both the national and international levels, some research papers on the
impact of the pandemic crisis on macroeconomics have been published. A study by Goel et al. (2021) examines the global supply chain logistics performance and the
subsequent effects of pandemic crises on economic growth using OLS estimation
for 136 countries from 2007 to 2017. The authors claimed that amid the present
pandemic crisis, when supply networks are affected or undermined in various
ways, countries are likely to face a heightened level of difficulty. In a
worldwide economy, the bottlenecks in the supply chain may have downstream
impacts that ripple across borders. These results also argue against blanket
growth-promoting measures applied to countries with varying growth rates. Furthermore,
Inegbedion (2021) indicated that the lockdown imposed by the pandemic crisis
had had a severe impact on the country's economic operations and circular flow
of money.
According to Coccia (2021), Ikram (2021), and Apergis
(2021), the pandemic crisis had a detrimental influence on the GDP in recent
studies. As a result of these studies, it has been found that nations with more
significant healthcare investments (as a percentage of GDP) have reduced the
fatality rate of the pandemic while also applying a shorter lockdown period,
which has lessened the negative consequences on economic growth. Coccia (2021)
indicates that exports of goods and services, logistics performance, ISO 9001
and ISO14001 certifications, notably in six heavily affected nations (India,
Iran, Philippines, Bangladesh, and Pakistan) during an outbreak of a pandemic
virus are all negatively affected by the pandemic crisis.
The Role of the Pandemic Crisis on
the Effect of ESG on Economic Growth
Many past studies have
investigated the influence of the pandemic crisis on ESG scores and
performance. Financial markets were exceedingly turbulent during the first
quarter of 2020 as the pandemic crisis spread over the world. During the
pandemic crisis timeframe, it is critical that researchers look at the role
that ESG ratings play in explaining economic growth. Díaz (2021) examined the influence
of ESG in US markets by examining the three Fama-French factors that
characterize stock returns (market return; size factor, which measures small
enterprises' outperformance relative to large organizations; and value factor).
This study found that ESG factors explain a sizable portion of industry
returns. The E and S aspects are the primary determinants of the ESG impact
across industries. It was noted that a similar technique used by the study of
Broadstock et al. (2021) to evaluate the relationship between ESG issues and
financial performance in China claimed that during the pandemic crisis, ESG
performance was favorably correlated with the short-term cumulative returns of
CSI300 equities.
Next, Engelhardt et al. (2021) investigated whether companies with higher ESG ratings outperformed
those with lower ratings during the pandemic crisis. Their study used a sample
of 1,452 companies from 16 European countries and analyzed whether firms with
high CSR ratings based on Refinitiv's ESG ratings from Thomson Reuters Eikon
outperformed those with deficient CSR ratings. The authors divided the dataset
based on the median scores of the country characteristics and performed baseline
regression models on the subsamples to investigate the relationship between the
components. The study suggests that participation in ESG initiatives in
countries with low levels of trust could decrease market uncertainty during the
pandemic crisis. Other than that, a study by Palma-Ruiz et al. (2020) researched the potential
profitability of business strategies during global catastrophes such as
pandemics. Based on a survey administered to 575 residents of Spain, this study
was able to conclude that the current economic crisis will cause consumers to
reevaluate their support for businesses that have been socially irresponsible
or unsupportive. Furthermore, people's perceptions of businesses will change
after normalcy has been restored during the pandemic.
In conclusion, existing studies have discussed the
information used to determine an ESG rating and indexes, which varies from one
rating to another, and the disagreement about the current ESG ratings and
indexes used in measuring the performance of ESG. However, these studies did
not focus on the impact of ESG practices on the economic aspect. Besides that,
a limited number of studies analyze the ESG performance and economic growth of
the ASEAN-5 economy because most studies only investigate the influence of
environmental, social, and governance factors on economic development. Our
study differs by focusing on the impact of ESG on economic growth. This study
fills the gap in the literature by analyzing the possible impact of ESG
practices and policies on economic growth in the ASEAN-5 countries, which is an
area where there may be a need for more research.
3. Data
This
study utilizes yearly data from 1990 to 2020 for all variables. In this study,
we measure each country's economic growth using GDP per capita, where the data
was obtained mainly from World Bank Open Data. Next, to study the impact of ESG
on ASEAN-5 countries, ESG data was obtained using ESG index score, where the
score was created using a data mining technique. Data on the pandemic was
obtained from the World Pandemic Uncertainty Index.
4. Methodology
4.1. Constructing the country's ESG index
This study aims to investigate the impact of ESG on economic
growth in ASEAN-5 countries. To achieve the objective, an ESG index is
constructed. Following Borms et al. (2021), the index was created
by utilizing data mining techniques and technology, particularly word frequency
statistics from text mining, which show that attention would be brought to ESG
if a news article about it were to be published. To the best of our knowledge,
there is no universal definition of ESG. Therefore, this study uses seed terms
from Borms et al. (2021) to define the
environmental, social, and governance elements. Using the Google search engine,
the initial search comprised ESG keywords and the names of the ASEAN-5
countries to focus on the implementation of ESG. By doing so, the original
keywords for these three categories (namely environmental, social, and
governance) will be established, and we will be able to effectively categorize
the ESG types and cover all of the key terms associated with ESG in the ASEAN-5
nations. The final keywords used to represent the Environmental are mobility,
biodiversity, and ecology. Meanwhile, for Social are, human rights,
discrimination, donation, governance, bribery, corruption, and animal testing.
Table 1
|
Table 1 List
of Category and Keywords |
||
|
Environmental |
Social |
Governance |
|
Environment, energy, mobility, nuclear, climate, biodiversity, carbon,
pollution, waste, ecology, sustainability, emission, renewable, oil, oil leak |
Society, health, human rights, social, discrimination, inclusion,
donation, strike, slavery, stakeholder, employee, employer, mass fire, labor,
trade union, depression, diversity |
Court, budget, justice, governance, management, bribery, corruption,
ethics, audit, patent infringement, gender neutral, money laundering, animal
testing, lobbyism, top wage |
|
Source Adapted from Borms et al. (2021) |
||
Based on the discussion in the literature reviews
section, the suggested expected signs of economic growth, ESG and other macroeconomic
drivers are shown in Table 2.
Table 2
|
Table 2 Description of the Data |
||||
|
Variable |
Abbreviation |
Measurement Unit |
Expected Sign |
Source |
|
Economic growth |
GDP |
GDP per capita
(percentage, %) |
|
World
Development Indicators |
|
Environmental,
social, governance |
ESG |
ESG index
score |
+ |
Author’s
calculation |
|
Fixed
capital formation |
FCF |
At
the constant price (the base year 2010) in log form. |
+ |
World Development Indicators |
|
Labor force |
LF |
Total |
+ |
World
Development Indicators |
|
Population growth |
PGR |
Population growth (annual %) |
+/- |
World
Development Indicators |
|
Trade openness |
OP |
[(Export
plus import)/GDP] |
+ |
World
Development Indicators |
|
Pandemic uncertainty index |
WPUI |
% of “uncertain” |
− |
World
Pandemic Uncertainty Index |
|
Source World Bank Open Data and World Pandemic
Uncertainty Index |
||||
Table 3 shows the results of
the sampling adequacy of the ESG index. The Kaiser-Meyer-Olkin (KMO) test,
Bartlett test, and Cronbach Alpha results denote greater adequacy of the factor
analysis, confirming that the variables are correlated and that the items used in
constructing the ESG Index have relatively high internal consistency. Thus, it
is concluded that these keywords are appropriate for factor analysis. The
procedure continues with extracting common factors where the eigenvalue value
is more significant than one, implying that the extracted factors can reflect
the information in the keywords. Finally, the first component was used to
derive a score for ESG. The scores obtained are normalized to 0 and 100, where
the higher value indicates more activity on ESG or a high level of ESG. The ESG
Index has been constructed for each country to determine their ESG levels over
time.
Table 3
|
Table
3
Results of Sampling Adequacy of the ESG Index |
|||
|
Variable |
Kaiser-Meyer-Olkin |
Bartlett
Test (chi-square) *** |
Cronbach
Alpha |
|
Environmental |
0.773 |
868.885 |
0.8766 |
|
Social |
0.786 |
968.898 |
0.9655 |
|
Governance |
0.793 |
903.776 |
0.8039 |
|
Overall ESG |
0.795 |
1026.243 |
0.9886 |
4.2. Estimation model
This study
adapts the standard growth model in the literature to investigate the relationship between ESG, pandemic crisis,
and economic growth, and is expressed as in Equation 1:
![]() (1)
(1)
Where ESG
includes the overall score of ESG and its component score, 𝑋t is the control variable of the growth model at time t, which include
fixed capital formation, labor force, government expenditure, domestic credit,
trade, and population growth, while 𝑌𝑡
is country GDP, and ɛ is the error term.
To
capture capital investment by a corporation that results in an increase in
productivity, which could result in long-term growth if strong economies are
formed through investment, gross fixed capital formation is included, which is
a major component of domestic investment and is viewed as an important process
that could accelerate economic growth. The estimation model is presented in Equation
2.
𝑌𝑡
= 𝛽0 + 𝛽1𝐸𝑆𝐺𝑡
+ 𝛽2𝑋1 + 𝛽3𝑋2
+ 𝜀𝑡 (2)
𝑌𝑡
= 𝛽0 + 𝛽1𝐸𝑆𝐺𝑡
+ 𝛽2𝑋1 *𝐸𝑆𝐺𝑡
+ 𝛽3WPUI𝑡 + 𝛽4𝑋2
+ 𝜀𝑡 (3)
𝑌𝑡
= 𝛽0 + 𝛽1𝐸𝑆𝐺𝑡
+ 𝛽2𝑋1 + 𝛽3WPUI
∗ 𝐸𝑆𝐺𝑡 + 𝛽4𝑋2
+ 𝜀𝑡 (4)
Where
ESG includes the overall score of ESG and its component score, 𝑋1 is
fixed capital formation, 𝑋2 is the control variable of the growth
model, WPUI is pandemic uncertainty index, while 𝑌𝑡 is country
GDP, and ɛ is the error term (see Widarni & Bawono, 2021; Busu, 2020; Opeoluwa
& Akingba, 2017).
4.3. Method
To achieve the
objective of the study, a preliminary unit root test is conducted to determine
whether trending data should be regressed on a deterministic function of time
and to verify that none of the study's variables are I(2). Non-stationary time
series are known to exhibit long-run equilibrium relationships, and if the
variables are I(1), cointegration techniques can be employed to represent these
relationships Nkoro and Uko (2016). The
Phillips-Perron (PP) test is used as the unit root test in this study, which is
a modified version of the widely used Dickey-Fuller (DF) test. The PP test is
similar to the DF test, but it allows for a more general class of errors and
accounts for the possibility of serial correlation. The PP test is particularly
useful when the time series under study has a drift or trend. This is because
the PP test allows for a deterministic trend in the model, which makes it more
flexible than the DF test. The PP test also automatically selects the optimal
lag length, which reduces the potential for bias in the estimation Phillips and Perron (1988).
In exploring the long
run relationship among dependent variable (GDP) and independent variables (ESG,
pandemic, fixed capital formation, labor force, population growth, and trade
openness), ARDL cointegration is used in this study. Following Pesaran et al. (2001), ARDL can assess the long-term
cointegration connection between variables and to construct an error correction
model (ECM) model from the ARDL model without surrendering any long-term
information. This model is based on the optimization approach of ordinary least
squares and is a mixed-order integration model. This method can be applied to
stationary or nonstationary time series, depending on the situation. This model
is employed because the ARDL approach technique allows for the examination of
the effects of the dependent and independent variables through time and the effects
of the past. ARDL approach technique is a key advantage of this approach to be
able to identify cointegrating vectors in the presence of numerous
cointegrating vectors, which is particularly useful when there are several
cointegrating vectors present Menegaki (2019); Nkoro and Uko (2016).
5. Empirical results and discussions
The
descriptive statistics for the ESG country index score of ASEAN-5 countries are
shown in Table 3. From 1990 to 2020, the mean ESG
score for the ASEAN-5 countries is still low, with the highest score being
0.64. The mean environmental score for the ASEAN-5 countries between 1990 and
2020 was 0.311, which indicates that companies in the region performed poorly
on environmental metrics. Similarly, the mean social score for the ASEAN-5
countries was 0.512, indicating that regional companies also performed poorly
on social metrics. The standard error for the social score was 0.117, which is
relatively high and further emphasizes the uncertainty of the mean estimate. The
mean governance score for the ASEAN-5 countries was 1.213, indicating better
performance than the environmental and social scores. However, the score is
still relatively low, considering the maximum score for governance was only
2.15.
Based on Table 4, the standard deviation values
range from 0.395 to 0.970, with the highest standard deviation value belonging
to the overall ESG score. This suggests a wide range of overall ESG performance
scores among the companies in this dataset, with some companies achieving
significantly higher scores than others while some were lagging. However, when
looking at the year 2001 until 2020, the mean ESG score for ASEAN-5 countries
was 16.059 for environmental, 16.541 for social, 16.140 for governance, and
18.407 for overall ESG. These scores indicate that ASEAN-5 countries have made
significant progress in incorporating ESG criteria into their business
practices, with an overall ESG score higher than the individual scores for
environmental, social, and governance. This shows that companies in ASEAN-5
countries are taking a holistic approach to ESG and are paying attention to all
three areas.
Table 4
|
Table 4 Results of Descriptive Statistics for the ESG Index Score of ASEAN-5 Countries from 1990 to 2020. |
||||||||
|
1990-2000 |
2001-2020 |
|||||||
|
Environmental |
Social |
Governance |
Overall ESG |
Environmental |
Social |
Governance |
Overall ESG |
|
|
Mean |
0.311 |
0.512 |
1.213 |
0.640 |
16.059 |
16..541 |
16.140 |
18..407 |
|
Std. Dev |
0.395 |
0.870 |
0.633 |
0.970 |
24.751 |
24.132 |
27.410 |
26.316 |
|
Minimum |
0 |
0 |
0 |
0 |
0 |
0 |
0 |
0 |
|
Maximum |
1.530 |
3.719 |
2.150 |
4.023 |
100 |
I00 |
100 |
100 |
|
1990-2020 |
||||||||
|
Environmental |
Social |
Governance |
Overall SG |
|||||
|
Mean |
10.471 |
10.853 |
10.843 |
12.103 |
||||
|
Std. Dev |
21.237 |
20.829 |
23.119 |
22.765 |
||||
|
Minimum |
0 |
0 |
0 |
0 |
||||
|
Maximum |
I00 |
I0O |
100 |
I00 |
||||
Overall,
the result shows that ESG scores for ASEAN-5 countries have progressed over the
past two decades. This is evidenced by the mean ESG score of 18.407, higher
than the individual scores for environmental, social, and governance. It is
also supported by the minimum score for all four criteria is 0, indicating that
companies are gradually adopting sustainable and ethical practices. The ESG
scores for ASEAN-5 countries from 2001 to 2020 indicate that there has been
progress in incorporating ESG criteria into business practices. It is important
to encourage companies who have not been involved with ESG practices to adopt
sustainable and ethical practices. For example, offering tax incentives or
grants for ESG initiatives could be a powerful way to motivate companies to
invest in sustainability. Besides that, the scores also show that the
government must continue supporting companies implementing ESG practices by
providing additional incentives such as public recognition or preferential
treatment in government contracts.
Table 5
|
Table
5 Summary of Unit Root Test Results |
|||||
|
Variable |
Malaysia |
Indonesia |
Thailand |
Philippines |
Singapore |
|
ln (GDP per capita) |
I(1) |
I(1) |
I(1) |
I(1) |
I(1) |
|
ln (Labor) |
I(1) |
I(1) |
I(0) |
I(1) |
I(1) |
|
ln (Gross capital formation) |
I(1) |
I(1) |
I(1) |
I(1) |
I(1) |
|
ln (Trade openness) |
I(1) |
I(1) |
I(1) |
I(1) |
I(1) |
|
Population growth |
I(0) |
I(0) |
I(0) |
I(0) |
I(0) |
|
ESG |
I(1) |
I(1) |
I(0) |
I(1) |
I(1) |
|
Environmental |
I(1) |
I(1) |
I(0) |
I(1) |
I(1) |
|
Social |
I(1) |
I(1) |
I(0) |
I(1) |
I(1) |
|
Governance |
I(1) |
I(1) |
I(0) |
I(1) |
I(1) |
|
WPUI |
I(0) |
I(0) |
I(0) |
I(0) |
I(0) |
|
Notes: Detail
on the results are available upon request. |
|||||
Table 5 shows that the
variables are either stationary in terms of levels or stationery in terms of
first differences based on the test results. Based on the result, none of the
variables have an integration order of two. In the table above, the results of
applying the one break PP unit root test with break test to each series over
the sample period for each country are displayed. Where there are series that
are integrated at level, implying I(0) variables, and at first difference,
there are contradictory outcomes. However, I(2) variables are not found in the
sample across countries.
Table 6 reports the results
of ARDL bound test. The value of F-statistics 7.112, 12.243, 10.791, 13.115,
and 7.310 for estimated model for Malaysia, Indonesia, Thailand, Philippines,
and Singapore respectively is greater than upper bound value at 5 percent
significance level. This indicates that the null hypothesis of no cointegration
among the variables of the study can be rejected, implies that there is
evidence of long-run ARDL cointegration model for Malaysia, Indonesia,
Thailand, Philippines, and Singapore.
Table 6
|
Table
6 Cointegration Bound Test
Analysis |
|||||
|
|
F-statistics |
||||
|
Critical value |
Malaysia |
Indonesia |
Thailand |
Philippines |
Singapore |
|
(Narayan, 2005) |
7.112** |
12.243** |
10.791* |
13.115*** |
7.310** |
|
I(0): 90% -1.5213, 95%- 1.876 |
|
|
|
|
|
|
I(1): 90% -3.757, 95%- 4.437 |
|
|
|
|
|
|
Notes: *,
** and *** represents significance at 10%, 5%, and 1% significance levels.
All models do not include intercept and trend in the estimation except for
Singapore with constant. |
|||||
The results on the estimated long-run ARDL cointegration model are shown in Table 5. By applying the Schwarz criterion (SC), the ESG coefficient is positive and statistically significant for Malaysia and the Philippines' economic growth at the 5% level. In contrast, the ESG is found to be statistically significant at 10% for Singapore. This positive relationship between ESG and the country's economic growth indicates that positioning the country towards achieving ESG would benefit the country's long-term growth. Directing the country's efforts toward the achievement of ESG would be beneficial to Malaysia's growth in the long run. Intuitively, a high-quality environment would safeguard natural resources such as increased biodiversity and habitat conservation and reductions in greenhouse gases (GHG), which are fundamental to a land protection and preservation plan. In addition, it reduces the expenses associated with externalities and has a favourable influence on the health of human capital, resulting in greater productivity and efficiency. This is consistent with the findings of Ayuso et al. (2020), who found that integrating social values improves economic, financial, and social values.
The Error Correction Terms are all negative and
significant, showing that convergence to the long run is feasible in the
models. In addition, from the
results of the Breusch-Godfrey serial correlation F- test and the Breusch-Pagan-
Godfrey heteroscedasticity F-test, we fail to reject the null-hypotheses of no
serial correlation and no heteroscedasticity of the residuals. Therefore, the results from
the model are void of spurious regression. To check the stability of the
estimated parameters, this paper also performs a Cumulative Sum of Recursive
Residual (CUSUM) test, as depicted in Figure 1. The line in the CUSUM plot in Figure 1 does
not exceed the 5% significance level, indicating that there is no evidence of a
structural change in the time series data. In other words, the estimated
coefficients are consistent over time, and the model is stable.
Table 7
|
Table 7 Results of Long-Run
Coefficient of Baseline Model |
|||||
|
ln (GDP per
capita) |
Malaysia |
Indonesia |
Thailand |
Philippines |
Singapore |
|
ln (Labor) |
2.1684** (0.9030) |
0.5576*** (0.1116) |
0.4705* (0.1593) |
0.4625*** (0.0225) |
0.7759** (0.2154) |
|
ln (Gross capital formation) |
0.6833** (0.2389) |
0.4526* (0.2346) |
0.2241 (0.1757) |
0.2922*** (0.0774) |
-0.2346 (0.2540) |
|
ln (Trade openness) |
2.7066*** (0.6223) |
-0.7335* (0.4143) |
0.0022 (0.4676) |
-0.2006* (0.0567) |
0.0586 (0.4909) |
|
Population growth |
-8.9949*** (1.8619) |
-0.7342 (0.2266) |
-0.5037* (0.1632) |
-0.2402 (0.1007) |
-0.0842 (0.0951) |
|
ESG |
0.0177** (0.0047) |
-0.0033 (0.0026) |
0.6113 (0.4464) |
0.0594** (0.0189) |
0.0424* (0.0033) |
|
Error
correction term |
-0.5494*** |
-0.2872*** |
-0.1700*** |
-0.3359*** |
-0.1757*** |
|
Serial correlation |
3.3573 |
7.5176 |
0.9998 |
1.2241 |
2.4744 |
|
Heteroscedasticity |
0.8673 |
0.1211 |
0.0027 |
0.7494 |
0.8446 |
|
Adjusted-R2 |
0.3938 |
0.9022 |
0.1559 |
0.3278 |
0.6624 |
|
Notes: *, **, and *** denote
significant at 10, 5, and 1 per cent significance levels. Numbers in brackets
represent the robust standard error. |
|||||
Figure 1
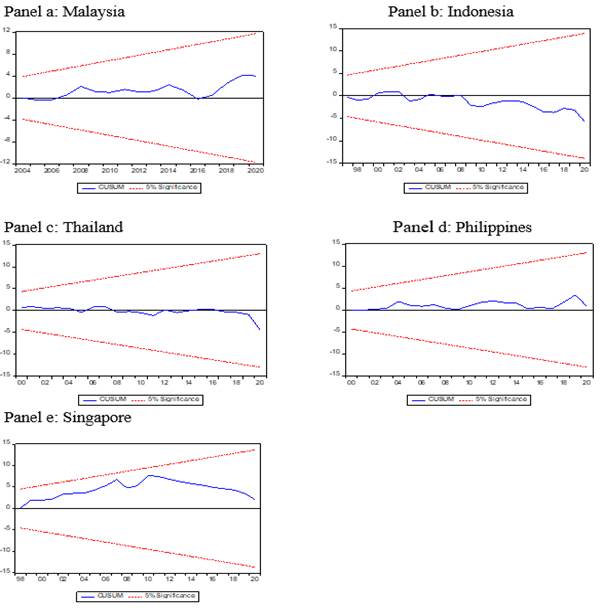
|
Figure 1 CUSUM Stability Test |
This study also includes an important element of
the pandemic since there has been economic turmoil resulted from it. Table 8 determines the
impact of pandemic uncertainty on the country's economic growth. The
F-statistics of the estimated models for Malaysia, Indonesia, Thailand,
Philippines, and Singapore are greater than the upper bound value at a
significance level of 5%, indicating the existence of a long-term ARDL
cointegration model.
Table 8
|
Table
8 Cointegration Bound Test Analysis |
|||||
|
|
F-statistics |
||||
|
Critical value |
Malaysia |
Indonesia |
Thailand |
Philippines |
Singapore |
|
(Narayan, 2005) |
8.536* |
8.513** |
9.767* |
17.899** |
8.965* |
|
I(0): 90% -1.748, 95%- 2.111 |
|
|
|
|
|
|
I(1): 90% -3.664, 95%- 4.317 |
|
|
|
|
|
|
Notes: * and ** denote significant at 10 and 5 percent
significance levels. All models do not include intercept and trend in the
estimation except for Singapore with constant. |
|||||
Table 9 reports the impact
of pandemic uncertainty on the economic growth in ASEAN-5. According to the
results, the pandemic has had a negative and significant impact on the economic
growth of Singapore and Thailand. This means that the pandemic has caused a
decrease in the economic growth of these two countries. On the other hand, the
impact of pandemic uncertainty on the economic growth of Malaysia, Indonesia,
and the Philippines was found to be insignificant. This suggests that the
pandemic did not significantly affect these countries' economic growth or that favorable
global commodity prices, or strong domestic demand may have mitigated the
negative impact of the pandemic on their economies. The diagnostics test
indicates no evidence of higher-order autocorrelation and heteroscedasticity in
the model. The CUSUM test shown in Figure 2 indicates that the
models are structurally stable.
Table 9
|
Table
9 Results of Long-Run Coefficient: The Role of Pandemic Uncertainty on
Country Economic Growth. |
|||||
|
ln (GDP per
capita) |
Malaysia |
Indonesia |
Thailand |
Philippines |
Singapore |
|
ln (Labor) |
2.8804** (1.3533) |
1.1479 (0.3268) |
0.4580** (0.1296) |
0.4628*** (0.0371) |
0.7660*** (0.0911) |
|
ln (Gross capital formation) |
1.3310*** (0.2466) |
0.1884 (0.1971) |
0.2000 (0.1594) |
0.2964* (0.1143) |
-0.2541 (0.1188) |
|
ln (Trade openness) |
1.3873** (0.3324) |
-0.4281 (0.1753) |
0.0646 (0.3681) |
-0.0191 (0.0923) |
0.0653 (0.2057) |
|
Population growth |
-1.3474** (0.3332) |
-0.0262 (0.3609) |
-0.5263** (0.1463) |
-0.5545*** (0.0565) |
-0.1069* (0.0491) |
|
WPUI |
-0.0294 (0.0369) |
-0.0155 (0.0053) |
-0.0034* (0.0018) |
-0.0236 (0.0172) |
-0.0495* (0.0108) |
|
Error
correction term |
-0.1749*** |
-0.4179*** |
-0.1915*** |
-0.2676*** |
-0.3158*** |
|
Serial
correlation |
0.6480 |
0.7589 |
1.4771 |
1.4396 |
0.9323 |
|
Heteroscedasticity |
0.8161 |
0.0928 |
0.0860 |
0.6188 |
0.2156 |
|
Adjusted-R2 |
0.8287 |
0.8226 |
0.1538 |
0.7745 |
0.6141 |
|
Notes: *, **, and *** denote
significant at 10, 5, and 1 percent significance levels. Numbers in brackets
represent the robust standard error. |
|||||
Figure 2
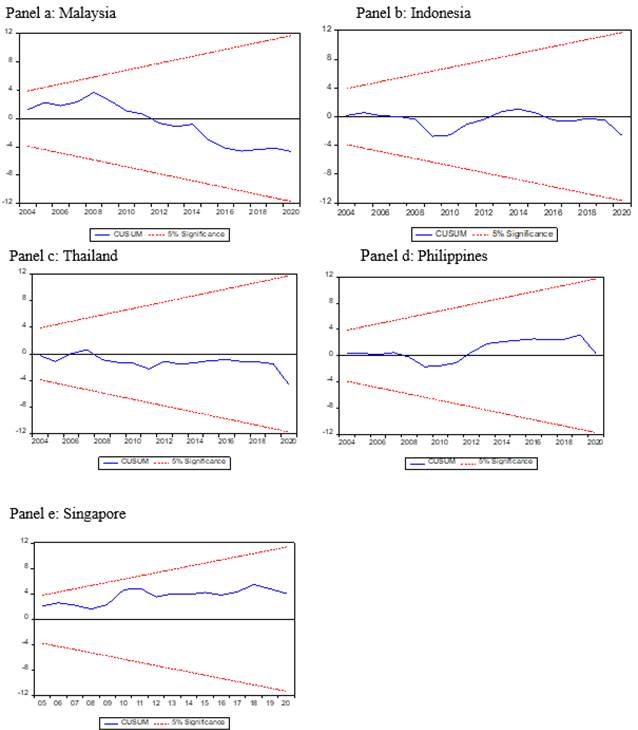
|
Figure 2 CUSUM Stability Test |
The results of the ARDL bounds tests for the model
that includes the interaction term between the pandemic crisis and ESG in the
estimated growth model are presented in Table 8. The F-statistic
exceeds the upper bound critical values at the 5% and 10% significance levels
for Indonesia, Thailand, Philippines, Singapore, and Malaysia, respectively.
This further clarifies the long-term relationship between the interaction
variable of ESG and pandemic crisis, other explanatory variables, and economic
growth.
Table 10
|
Table
10 Cointegration Bound Test
Analysis |
|||||
|
|
F-statistics |
||||
|
Critical value |
Malaysia |
Indonesia |
Thailand |
Philippines |
Singapore |
|
(Narayan, 2005) |
8.536* |
13.721** |
8.985* |
14.676** |
8.247* |
|
I(0): 90% -1.740, 95%- 2.114 |
|
|
|
|
|
|
I(1): 90% -3.685, 95%- 4.379 |
|
|
|
|
|
|
Notes: *
and ** denote significant at 10 and 5 percent significance levels. All models
do not include intercept and trend in the estimation except for Singapore
with constant. |
|||||
Table 10 provides an in-depth result to
capture the complement effect that possible play by the pandemic uncertainty on
the effect of ESG on economic growth. It is shown that the implementation of
ESG during pandemic uncertainty has a negative and insignificant impact on
economic growth for Indonesia, the Philippines, Singapore, and Thailand. This
means that during times of pandemic uncertainty, the implementation of ESG
activities only significantly impacts economic growth in these countries. To meet ESG goals and regulations, consumption and output must be high,
which will slow economic growth, especially during a pandemic. These findings are
similar to the previous studies, which indicate that the costs associated with
participating in ESG activities during the COVID-19 epidemic outweighed any
potential benefits Aydoğmuş et al. (2022); Tampakoudis et al. (2021).
Table 11
|
Table 11 Results of Long-Run
Coefficient on the Role of Innovation in ESG-Growth |
|||||
|
GDP per capita |
Malaysia |
Indonesia |
Thailand |
Philippines |
Singapore |
|
ln (Labor) |
0.5409 (0.4553) |
0.6244*** (0.1348) |
0.4092* (0.1627) |
0.4623*** (0.0478) |
0.7640*** (0.0663) |
|
ln (Gross capital formation) |
-0.1310 (0.7993) |
0.1252 (0.3533) |
0.3301 (0.2029) |
0.3026 (0.2696) |
-0.2616* (0.0984) |
|
ln (Trade openness) |
0.3579 (1.3674) |
-0.8440 (0.4364) |
0.1545 (0.4761) |
-0.0171 (0.1359) |
0.0655 (0.1554) |
|
Population growth |
-0.5935 (0.6423) |
-0.5090 (0.3639) |
-0.4769* (0.1724) |
-0.5625* (0.2726) |
-0.0934* (0.0466) |
|
ESG |
0.0003 (0.0075) |
-0.0033 (0.0027) |
-0.0795 (0.5657) |
-0.0001 (0.0039) |
-0.0010 (0.0016) |
|
WPUI |
-0.0838 (0.0845) |
-0.0245 (0.0104) |
-0.0085* (0.0035) |
-0.0239 (0.0211) |
-0.0253* (0.0110) |
|
ESG*WPUI |
0.0064 (0.0054) |
-0.0004 (0.0021) |
-0.0004 (0.0034) |
-0.0273 (0.0427) |
-0.0057 (0.0068) |
|
Error
correction term |
-0.1749*** |
-0.1749*** |
-0.1697*** |
-0.2626*** |
-0.3692*** |
|
Serial
correlation |
0.6480 |
0.6480 |
0.9726 |
1.3768 |
0.9367 |
|
Heteroscedasticity |
0.8161 |
0.8161 |
0.0014 |
0.6145 |
0.0529 |
|
Adjusted-R2 |
0.8287 |
0.8287 |
1.3815 |
0.9719 |
0.9196 |
|
Notes: * and ** denote significance
at 5 and 10 percent significance levels. Numbers in brackets represent the
robust standard error. The critical values are provided by Pesaran et al. (2001), unrestricted intercept, and no
trend. All models include intercept in the estimation. |
|||||
The
results have shown that economic growth in Malaysia slowed when pandemics
struck, particularly during the coronavirus (COVID-19) crisis; however, we
discovered that implementing ESG activities indirectly helps solve
environmental and social problems by changing the way private funds are used.
This implies that although the direct impact of ESG on economic growth during
pandemics is not significant in Malaysia, other positive externalities are
associated with ESG activities that can contribute to society's overall
well-being. For example, companies that prioritize ESG practices may invest in
measures that lead to improved public health, such as reducing air pollution or
promoting sustainable agriculture practices, which can have long-term benefits
for the health and well-being of the population. In addition, the Breusch-Godfrey
and serial correlation F- test and the Breusch-Pagan-
Godfrey heteroscedasticity F-test could not reject the null of non-normality,
no serial correlation, and no heteroscedasticity problem, respectively implies
the estimation is efficient and unbiased.
In addition,
the graphs in Figure 3 reveal that none of the lines
surpass the 5% significance level, indicating that the null hypothesis of
stability is not rejected. The estimated equation is, therefore, stable over
time.
Figure 3

|
Figure 3 CUSUM Stability Test |
6. Conclusion
This study contributes to new knowledge regarding the
impact of ESG on economic growth in ASEAN-5 countries. First, the empirical
results have shown that ESG has mixed results on the impact on the economic
growth in ASEAN-5 countries influenced by the level
of government support for ESG practices or the level of awareness and
understanding of ESG practices among businesses and investors. Some results
showed a significant positive impact of ESG practices on economic growth, while
others showed no significant or negative impact. The mixed results can be
attributed to factors such as country practices, regulations, and ecosystems to
support ESG. Some ASEAN countries may have more advanced ESG frameworks and
policies, while others may still need to. As a result, the impact of ESG on
economic growth may vary depending on the country's level of implementation. This
is in line with the previous studies done by Madison and Schiehll (2021); Minkkinen et al. (2022).
Second, the results indicate that other variables
such as labor, capital formation, trade openness, and population may have a
greater impact on economic growth than ESG. For example, factors such as
technological progress, infrastructure development, and political stability may
have a more significant influence on economic growth in certain countries or
contexts. Therefore, the impact of ESG on economic growth needs to be evaluated
in conjunction with other economic factors to get a more comprehensive
understanding of the relationship between ESG and economic growth in the
ASEAN-5 region.
Third, the results show that the pandemic has had a
negative and significant impact on the economic growth of Singapore and
Thailand. On the other hand, surprisingly, the impact of pandemic uncertainty
on the economic growth of Malaysia, Indonesia, and the Philippines was found to
be insignificant. The possible explanation is that the fight against pandemics
slows production recovery in many industries and raises preventative expenses,
as well as the circular flow of money. Besides that, longer mobility
restrictions will result in economic scarring, making it more difficult for the
economy to recover. Lastly, the overall demand fell due to lower consumer
spending, mobility constraints, and weaker demand from outside countries.
Therefore, policymakers, institutional investors,
and regulators should play vital roles in assisting the Government in
supporting ESG practices among business companies by creating a sustainable
ecosystem. Over the past decade, the Government has adopted various
sustainability programs and incentives, such as tax incentives for companies
that prioritize ESG factors, introducing regulations requiring companies to
report on their ESG practices, and investing in research and development to
promote innovation in sustainable practices. A precautionary policy should be
made to support firms in shock. The proposed policies should include the
financial assistance to companies, such as low-interest loans, grants, and tax
relief. In addition, the policies should also focus on improving the resilience
of firms by promoting the adoption of ESG practices.
CONFLICT OF INTERESTS
None.
ACKNOWLEDGMENTS
This research was supported by Ministry of Higher Education (MoHE) of Malaysia through Fundamental Research Grant Scheme (FRGS/1/2020/SS0/UUM/02/25).
REFERENCES
ASEAN. (2020). ASEAN Comprehensive Recovery Framework. ASEAN : A Community of Opportunities for All, 7, 1, 37–72.
ASEAN. (2022). Investing in ASEAN 2021–2022.
Avetisyan, E., & Hockerts, K. (2017). The Consolidation of the Esg Rating Industry as an Enactment of Institutional Retrogression. Business Strategy and the Environment, 26(3), 316–330. https://doi.org/10.1002/bse.1919.
Avramov, D., Cheng, S., Lioui, A., & Tarelli, A. (2022).
Sustainable Investing with ESG Rating Uncertainty. Journal of Financial
Economics, 145(2), 642–664. https://doi.org/10.1016/j.jfineco.2021.09.009.
Aydoğmuş, M., Gülay, G., & Ergun, K. (2022).
Impact of ESG Performance on Firm Value and Profitability. Borsa Istanbul
Review, 22, S119–S127. https://doi.org/10.1016/j.bir.2022.11.006.
Ayuso, S., Sánchez, P., Retolaza, J. L., & Figueras-Maz, M. (2020). Social Value Analysis: The Case of Pompeu Fabra University. Sustainability Accounting, Management and Policy Journal, 11(1), 233–252. https://doi.org/10.1108/SAMPJ-11-2018-0307.
Bannier, C. E., Bofinger, Y., & Rock, B. (2019). Doing Safe by Doing Good: ESG Investing and Corporate Social Responsibility in the U.S. and Europe. CFS Working Paper Series, 621.
Billio, M., Costola, M., Hristova, I., Latino, C.,
& Pelizzon, L. (2021). Inside the ESG Ratings: (Dis) Agreement and
Performance. Corporate Social Responsibility and Environmental Management,
28(5), 1426–1445. https://doi.org/10.1002/csr.2177.
Boffo, R., & Patalano, B. (2020). ESG Investing : Practices, Progress and Challenges, OECD.
Borms, S., Boudt, K., Van Holle, F.,
& J. (2021). Semi-Supervised Text Mining for
Monitoring the News About the ESG Performance of Companies. In Data Science for
Economics and Finance. https://doi.org/10.1007/978-3-030-66891-4.
Brandon, R. G., Schmidt, P. S., & Brandon, R. G. (2021). ESG Rating Disagreement and Stock Returns, June.
De
Lucia, C., Pazienza, P., & Bartlett, M. (2020). Does Good ESG Lead
to Better Financial Performances by Firms? Machine learning and Logistic
Regression Models of Public Enterprises in Europe. Sustainability, 12(13),
1–26. https://doi.org/10.3390/su12135317.
Eccles, N. S., & Viviers, S. (2011). The Origins and Meanings of Names Describing Investment Practices that Integrate a Consideration of ESG Issues in the Academic Literature. Journal of Business Ethics, 104(3), 389–402. https://doi.org/10.1007/s10551-011-0917-7.
Engelhardt,
N., Ekkenga, J., & Posch, P. (2021). Esg Ratings and Stock
Performance During the Covid-19 Crisis. Sustainability, 13(13), 1–15.
https://doi.org/10.3390/su13137133.
Escrig-Olmedo,
E., Fernández-Izquierdo, M., Ferrero-Ferrero, I., Rivera-Lirio, J., &
Muñoz-Torres, M. (2019). Rating the Raters: Evaluating How ESG Rating
Agencies Integrate Sustainability Principles. Sustainability, 11(3).
https://doi.org/10.3390/su11030915.
Ferktaji, E. L. (2019). Munich Personal RePEc Archive the Dynamic Causality Between ESG and Economic Growth : Evidence from Panel Causality Analysis Ho, Sy-Hoa and OUEGHLISSI, Rim and el FERKTAJI, 95390.
Goel, R. K., Saunoris, J. W., & Goel, S. S. (2021). Supply Chain
Performance and Economic Growth: The Impact of COVID-19 Disruptions. Journal of
Policy Modeling, 43(2), 298–316. https://doi.org/10.1016/j.jpolmod.2021.01.003.
GSIA. (2016). Global Sustainable Investment Review. 2016. Indonesia. (2022). ID, March.
Landi,
G. C., Iandolo, F., Renzi, A., & Rey, A. (2022). Embedding Sustainability
in Risk Management: The Impact of Environmental, Social, and Governance Ratings
on Corporate Financial Risk. Corporate Social Responsibility and Environmental
Management, January(4), 1096–1107. https://doi.org/10.1002/csr.2256.
Luo, D. (2022). ESG, Liquidity, and Stock Returns. Journal of
International Financial Markets, Institutions and Money, 78, 101526. https://doi.org/10.1016/j.intfin.2022.101526.
Madison,
N., & Schiehll, E. (2021). ESG Ratings and Scores with a High
Financial Materiality Index May Provide Investment Opportunities as They Allow
Identification of Firms with a High Score on Business-Critical ESG Issues.
Sustainability (Switzerland), 13(7). https://doi.org/10.3390/su13073652.
Mahi,
M., Phoong, S. W., Ismail, I., & Isa, C. R. (2020). Energy-Finance-Growth
Nexus in ASEAN-5 Countries: An ARDL Bounds Test Approach. Sustainability,
12(1), 1–16. https://doi.org/10.3390/SU12010005.
Margaretic, P., & Pouget, S. (2018). Sovereign Bond
Spreads and Extra-Financial Performance: An Empirical Analysis of Emerging
Markets. International Review of Economics and Finance, 58(April), 340–355. https://doi.org/10.1016/j.iref.2018.04.005.
Menegaki, A. N. (2019). The ARDL Method in
the Energy-Growth Nexus Field ; Best Implementation Strategies. Economies,
7(4), 1–16. https://doi.org/10.3390/economies7040105.
Minkkinen, M., Niukkanen, A., & Mäntymäki, M. (2022).
What About Investors? ESG Analyses as Tools for Ethics-Based AI Auditing. AI
and SOCIETY. https://doi.org/10.1007/s00146-022-01415-0.
NEF. (2015). Reducing Economic Inequality as a Sustainable Development Goal. 1–61.
Nkoro, E., & Uko, A. K. (2016). Autoregressive Distributed Lag (ARDL) Cointegration Technique : Application and Interpretation. Journal of Statistical and Econometric Methods, 5(3), 63–91.
Palma-Ruiz, J. M., Castillo-Apraiz, J., & Gómez-Martínez, R. (2020). Socially Responsible Investing as a Competitive Strategy for Trading Companies in Times of Upheaval Amid Covid-19: Evidence from Spain. International Journal of Financial Studies, 8(3), 1–13. https://doi.org/10.3390/ijfs8030041.
Phillips, P., & Perron, P.
(1988). Testing for a Unit Root in Time Series
Regression Author (s) : Peter C. B. Phillips and Pierre Perron Published by :
Oxford University Press on behalf of Biometrika Trust Stable, 75(2), 335–346.
https://doi.org/10.1093/biomet/75.2.335.
Sassen, R., Hinze, A. K., & Hardeck, I. (2016). Impact of
ESG Factors on Firm Risk in Europe. Journal of Business Economics, 86(8),
867–904. https://doi.org/10.1007/s11573-016-0819-3.
Shaikh, I. (2022). On the Relationship
Between Policy Uncertainty and Sustainable Investing. Journal of Modelling in
Management, 17(4), 1504–1523. https://doi.org/10.1108/JM2-12-2020-0320.
Tampakoudis,
I., Noulas, A., Kiosses, N., & Drogalas, G. (2021). The Effect of
ESG on Value Creation from Mergers and Acquisitions. What Changed During the
COVID-19 Pandemic? Corporate Governance, 21(6), 1117–1141. https://doi.org/10.1108/CG-10-2020-0448.
Tarmuji, I., Maelah, R., & Tarmuji, N. H. (2016). The Impact
of Environmental, Social and Governance Practices (ESG) on Economic Performance:
Evidence from ESG Score. International Journal of Trade, Economics and Finance,
7(3), 67–74. https://doi.org/10.18178/ijtef.2016.7.3.501.
Windolph, S. E. (2011). Assessing
Corporate Sustainability Through Ratings : Challenges and their Causes. Journal
of Environmental Sustainability, 1(1), 1–22.
https://doi.org/10.14448/jes.01.0005.
Zhang, D., Zhao, Z., & Lau, C. K. M. (2022).
Sovereign ESG and Corporate Investment : New Insights from the United Kingdom.
Technological Forecasting and Social Change, 183(July).
https://doi.org/10.1016/j.techfore.2022.121899.
Zhou,
X., Caldecott, B., Harnett, E., & Schumacher, K. (2020). The Effect of
Firm-Level ESG Practices on Macroeconomic Performance. SSRN Electronic Journal,
4214(20), 0–49. https://doi.org/10.2139/ssrn.3618748.
 This work is licensed under a: Creative Commons Attribution 4.0 International License
© Granthaalayah 2014-2023. All Rights Reserved.