A STUDY ON DIGITAL PAYMENT USAGE AMONG THE STUDENT COMMUNITY IN TIRUCHIRAPPALLI CITY OF TAMIL NADU
Dr. R. Senthamizh Veena 1![]()
![]() ,
D. Epsheeba 2
,
D. Epsheeba 2![]()
1 Assistant
Professor of Economics, Holy Cross College, Tiruchirappalli, Tamil Nadu, India
2 Student,
B.A. Economics, Holy Cross College, Tiruchirappalli, Tamil Nadu, India
|
|
|
ABSTRACT |
|
|
Digital payment, also called as electronic payment, is the transfer of money from one payment account to another using a digital device such as a mobile phone or a computer. In an increasingly cashless society, digital payments are the new norm, and they take place every single day all around the world. There are multiple benefits that digital payments bring to the table. Transactions performed through digital payment systems are faster, easier, and more convenient than carrying cash in hand or performing the banking transactions by visiting the branch physically. This means that more and more people feel comfortable transferring funds via electronic mediums, buying products online and investing digitally. Digital payment plays better role not only among the working-class people but also among younger generation. The method of digital transaction is used majorly by the younger generation, specifically the student community as they have better knowledge and access to digital devices. Therefore, this study attempted to examine the usage pattern of digital payment methods among the student community in Tiruchirappalli city of Tamil Nadu. The study focused on the socio-economic conditions of the respondents in relation to their awareness, frequency, and purpose of using digital payment methods for transactions. For this purpose, the researchers have collected primary data and has used statistical tools like percentage, growth rate and crosstabulation to analyze the data. The study found that male respondents used digital transactions more frequently than female respondents and also those in higher income group used the digital transaction method more frequently than those in lower income group. |
|||
|
Received 30 April 2023 Accepted 31 May 2023 Published 13 June 2023 Corresponding Author Dr. R. Senthamizh
Veena, veena.senthamizh@gmail.com DOI 10.29121/granthaalayah.v11.i5.2023.5191 Funding: This research
received no specific grant from any funding agency in the public, commercial,
or not-for-profit sectors. Copyright: © 2023 The
Author(s). This work is licensed under a Creative Commons
Attribution 4.0 International License. With the
license CC-BY, authors retain the copyright, allowing anyone to download,
reuse, re-print, modify, distribute, and/or copy their contribution. The work
must be properly attributed to its author.
|
|||
|
Keywords: Digital Payments, Cashless Transaction,
Student Community, UPI, Mobile Wallets, Internet Banking |
|||
1. INTRODUCTION
A digital payment, also called as electronic payment, is the transfer of money from one payment account to another using a digital device such as a mobile phone, POS (Point of Sales) or computer, a digital channel communication such as mobile wireless data or SWIFT (Society for the Worldwide Interbank Financial Telecommunication) Brajesh (2021). In an increasingly cashless society, digital payments are the new norm, and they take place every single day all around the world. There are multiple benefits that digital payments bring to the table. While handling and dealing in cash are a cumbersome and tedious task which involves the risk of losing money, digital payment provides a seamless experience to the people. With digital payments, one can keep their funds secured in online format effortlessly. It reduced the hassle of carrying cash everywhere and made faster and easier payments which are convenient for the individuals. The significance of digital payment system was well realized during the COVID 19 pandemic which facilitated contactless payments, social distancing and thereby helped for the continuity of businesses and economic activities. Digital payment systems play better role not only among the working-class people but also in younger generation. In recent years, the method of digital transactions has gained popularity among the younger generation, specifically the student community. Therefore, this study proposes to examine the usage pattern of digital transactions among the student community in Tiruchirappalli city of Tamil Nadu state. The study focuses on the socio-economic conditions of the respondents in relation to their awareness, frequency, and purpose of using digital payment methods for transactions. The study also attempts to identify the issues faced by the student community while making digital transactions.
2. GROWTH OF DIGITAL TRANSACTIONS IN INDIA
Government of India is committed to expand digital transactions in the Indian economy, to enhance the financial inclusiveness and thereby improve the ease of living for citizens. Accordingly, the government of India has been undertaking several measures to promote and encourage digital payments in our country. As part of the ‘Digital India’ campaign, the government aims to create a ‘digitally empowered’ economy that is ‘Faceless, Paperless, Cashless’ Bhatia (2021). In April 2016, UPI was launched under Digital India Programme, which is an instant real-time payment system developed by National Payments Corporation of India. Digital payment transactions have significantly increased because of coordinated efforts of the Government as a whole, along with all stake holders concerned. In this context, the total number of digital payment transactions undertaken and their total value in rupees during the recent years are given in the Table 1.
Table 1
|
Table 1 Growth of Digital Transactions in India |
||||
|
Financial Year |
Total number of
digital transactions (in crore) # |
Annual Growth Rate (%) |
Total value of digital
transactions (in Rs. lakh crore) # |
Annual2 Growth Rate
(%) |
|
2017-18 |
2,071 |
|
1,962 |
|
|
2018-19 |
3,134 |
51.32 |
2,482 |
26.5 |
|
2019-20 |
4,572 |
45.88 |
2,953 |
18.97 |
|
2020-21 |
5,554 |
21.47 |
3,000 |
1.59 |
|
2021-22 |
8,840 |
59.16 |
3,021 |
0.7 |
|
2022-23 |
12,008 |
35.83 |
2,050* |
- |
|
Source RBI
and National Payments Corporation of India (NPCI) *
Data till 31st December2022 #
Includes Digital payment modes like BHIM-UPI, IMPS, NACH, AePS,
NETC, Debit cards, credit
cards, NEFT, RTGS, PPI and others. |
||||
From the Table 1, it can be seen that there has been an enormous growth in the number and value of digital transactions in India in recent years. In the year 2017-18, the number of digital transactions were 2,071 crore and it increased 10 times to 12,008 crores in 2022-23. It is also evident that there has been a spur in the growth of digital transactions after the COVID 19 pandemic in 2020-21. At the same time, it is important to note that there has not been corresponding growth in the value of digital transactions in the country. This means that there has been large number of transactions involving less money which could be inferred that people of low- and middle-income group undertook digital transactions leading to financial inclusion in the country.
3. REVIEW OF LITERATURE
Jain & Rai (2020) undertaken a study on the status of digital payment behavior of Jaipur residents during COVID 19 lockdown. They examined about the preferred method, benefits, and challenges of using digital payment during the lockdown. The major disadvantages of using digital payment were found to be card data security, fake messages, hacking, and bank details leakage. At the same time, lower risk of catching an infection, time saving, and convenience were found to be the major advantages of using digital payments during lockdown. Pandey (2022) attempted to analyze how various forms of digital payment were used in the past and how COVID-19 impacted the digital payment systems in India. The study concluded that digital payment in India recorded a robust growth of 26.2 per cent of volumes during 2020-2021 compared to previous years and it will witness exponential growth in coming years. Himani (2018) in the paper titled, “A study of consumer perception regarding digital payment system in India” provides a glimpse of the user’s behavior towards digital payment, their satisfaction level and impact of age on their use, factors that can affect a consumer’s decision to adopt digital payment. Primary data was collected from 100 respondents and the researcher used quantitative method like ANOVA for analysis. Shree et al. (2021) used a novel online survey-based dataset to understand the factors such as ‘perception’ and ‘trust’ in digital payments and experience with online frauds that affect the payment behavior of consumers. The demographic factors like age, gender and income were found to be relevant factors which determined their choice. They found that the degree of past experience with online fraud deters the usage of digital payments. Singh et al. (2013) undertaken a study titled “Issues and Challenges of electronic payment system”. In this study, they aimed to identify the issues and challenges of electronic payment system and they offered some solutions to improve the quality of e-payment system.
4. RESEARCH GAP
Digital payment is a relatively new concept which became more common only
after the emergence of COVID 19 pandemic in the year 2020. Therefore, the
number of studies related to digital payments were found to be less. While
reviewing the literature related to digital payment it was found that only few
studies were conducted in India and specifically in the state of Tamil Nadu.
The available studies were found to be fragmented and not comprehensive. Also,
to the best of the researcher’s knowledge none of the studies focused on the
higher education students who are the major user of the digital payments.
Therefore, the researcher felt it necessary to conduct a comprehensive study on
the various aspects of digital payment with special focus on higher education students
in Tiruchirappalli city of Tamil Nadu state.
5. OBJECTIVES
· To analyze the digital payment usage among the student community in Tiruchirappalli city of Tamil Nadu
· To examine the reasons and purpose of digital payment usage among the respondents
· To find out the relation between the socio-economic factors and digital payment usage among the respondents.
6. METHODOLOGY
A suitable methodology is required for the reliable analysis and finding results. Thereby the researchers has adopted the following methodology to carry out the study.
6.1. SELECTION OF STUDY AREA
Tiruchirappalli
has been recognized in India as an important educational center
since the time of British rule which has many century-old institutions. The
city has a host of educational institutions which ranges from arts and science
colleges, polytechnic and engineering colleges, agricultural colleges, law
college to medical colleges as well. It has been considered as an educational
hub in Tamil Nadu and therefore the researchers carried out the study involving
student community in Tiruchirappalli city.
6.2. DATA COLLECTION
The study is entirely based on primary data collected from 60 respondents from different higher educational institutions in Tiruchirappalli city. The researcher has adopted convenience sampling method for the collection of data. A well-structured electronic questionnaire using google form was administered by the researcher to collect data.
6.3. TOOLS OF ANALYSIS
The researcher has used tabulation and simple statistical tools like frequency, percentage and average to analyze the data. The researchers have included graphical illustration of pie chart and bar chart wherever necessary for easy understanding and better presentation of results. The researchers have used cross tabulation method to find the relation between the socio-economic factors and digital transaction usage among the respondents.
6.4. LIMITATIONS OF THE STUDY
This study is entirely based on primary data. Therefore, the information given by the respondents may not be exact as there may be recall lapses. Due to time and resource constraint, this study was confined to only Tiruchirappalli city and the sample was collected from 60 respondents only. Therefore, the findings of the study cannot be generalized for all the area and sections of the people.
7. DATA
ANALYSIS AND INTERPRETATION
7.1. DIGITAL PAYMENT USAGE AMONG STUDENT COMMUNITY IN TIRUCHIRAPPALLI CITY
The current section deals with the analysis and inference about the digital payment usage among the student community in Tiruchirappalli city based on the primary data collected from the samples. The Table 2 shows the overview of the socio-economic profile of the respondents through selected variables from the collected data.
Table 2
|
Table 2 Socio-Economic Profile of the Respondents |
|||
|
Variable |
Categories |
No. of Respondents |
Percentage to Total
(%) |
|
Age |
18 – 20 years |
30 |
50 |
|
|
21 - 23 years |
24 |
40 |
|
|
Above 23 years |
6 |
10 |
|
|
Total |
60 |
100 |
|
Sex |
Female |
32 |
53.3 |
|
|
Male |
28 |
46.6 |
|
|
Total |
60 |
100 |
|
Place of housing residency |
Rural |
20 |
33.3 |
|
|
Urban |
40 |
66.6 |
|
|
Total |
60 |
100 |
|
Stay for education |
Day’s scholar |
48 |
80 |
|
|
Hostel |
12 |
20 |
|
|
Total |
60 |
100 |
|
Monthly family income |
Less than Rs 10,000 |
19 |
31.6 |
|
|
Rs 10,001 to Rs
25,000 |
23 |
38.3 |
|
|
Rs 25001 to Rs 50,000 |
12 |
20 |
|
|
Above Rs 50,000 |
6 |
10 |
|
|
Total |
60 |
100 |
|
Part time working |
Yes |
11 |
18.3 |
|
|
No |
49 |
81.6 |
|
|
Total |
60 |
100 |
|
Smart phone with internet
connection |
Yes |
60 |
100 |
|
|
No |
0 |
0 |
|
|
Total |
60 |
100 |
|
Laptop or desktop computer |
Yes |
44 |
73.3 |
|
|
No |
16 |
26.6 |
|
|
Total |
60 |
100 |
|
Source
Compiled from primary data |
|||
It can be seen from the Table 2 that, since the respondents are the students from higher education institutions the age of the respondents ranged from 18 to early 20 years old. Out of the total respondents 32 respondents (53.3 per cent) were female and the remaining 28 (46.6 per cent) were male. Then 20 respondents were from rural areas and 40 were from urban areas. To know about their economic conditions, the monthly family income data of the respondents were collected. Out of the total respondents, 19 respondents had family income less than Rs.10,000 only and 23 respondents had family income between Rs.10,001 and Rs.25,000. Then 12 respondents’ family income was between Rs.25,001 and Rs.50,000 and the remaining 6 respondents’ monthly family income was above Rs.50,000. Among the respondents, 11 of them were working in a part time job along with their studies and the remaining 49 respondents did not do any part time job. It was also found that among the respondents, everyone was having a smartphone with internet connection and out of them 44 respondents (73.3 per cent) had a laptop or a desktop computer in their home and only 16 respondents did not have a laptop or desktop computer. This may be because of the provision of free laptops to the students by the Tamil Nadu state government.
7.2. AWARENESS AND USAGE OF DIGITAL PAYMENT METHODS
Due to technological advancement, there are several different cashless, digital payment methods available for transactions. All of them work with the basic principle of automatically transferring money from one bank account to another. The researchers have attempted to find out the respondent’s awareness about some of the major types of digital payment methods available.
Table 3
|
Table 3 Awareness and Usage of Digital Payment Method |
|||||||
|
Digital Payment
Methods |
Yes |
No |
Total |
Most Preferred Method |
|||
|
|
No. of Respondents |
Percentage to Total
(%) |
No. of Respondents |
Percentage to Total
(%) |
No. of Respondents |
Percentage to Total
(%) |
(No. of Respondents) |
|
Internet Banking |
30 |
50 |
30 |
50 |
60 |
100 |
11 |
|
Mobile Banking |
38 |
63.3 |
22 |
36.6 |
60 |
100 |
4 |
|
UPI/ Mobile wallet |
54 |
90 |
6 |
10 |
60 |
100 |
30 |
|
Credit cards/ Debit
cards |
49 |
81.6 |
11 |
18.3 |
60 |
100 |
15 |
|
Source
Compiled from primary data |
|||||||
Figure 1
|
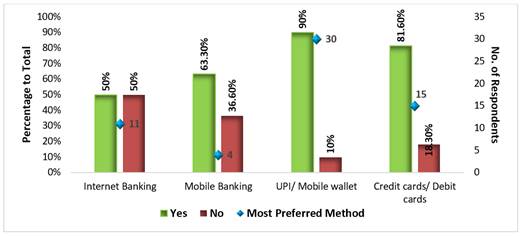
Figure 1 Awareness and Usage of Digital Payment Methods |
The Table 3 and Figure 2 shows the awareness about the various digital payment methods among the respondents. Out of the total respondents 30 of them i.e., 50 per cent were aware of how to use internet banking and the remaining 50 per cent i.e., 30 respondents were not aware of internet banking. Then 38 of them i.e., 63 per cent were aware of mobile banking methods (using mobile apps of the banks) and 22 of them i.e., 36.6 per cent were not aware of the mobile banking methods. Regarding the UPI or mobile wallet method, 54 respondents i.e., 90 per cent were aware of it whereas only 6 respondents were not aware of it. Similarly, with respect to credit cards and debit cards, 49 respondents i.e., 81.6 per cent were of it and the remaining 11 respondents i.e., 18.3 per cent were not aware of how to use it.
This shows that among the different digital transaction methods, majority of the respondents i.e., 90 per cent of the respondents were aware of the UPI/ mobile wallet method. Also, it is evident that all the respondents were aware of using at least any one of the digital payment methods and many respondents were aware of more than one method of digital transactions.
Further, the
researchers also attempted to know about the most preferred method of digital
payment by the respondents and almost half of them, i.e., 30 respondents
preferred UPI/mobile wallet method for digital payment. It was followed by
credit cards/debit cards which was preferred by 15 respondents and 11
respondents preferred internet banking while only 4 respondents preferred
mobile banking method which involves using the dedicated mobile application of
the concerned banks.
7.3. MOST PREFERRED DIGITAL PAYMENT APPLICATION BY THE RESPONDENTS
In digital payment methods, mobile applications hold a significant place. As can be seen from the Table 3, majority of the respondents were aware of and preferred using mobile application for digital payments. Thereby the researchers attempted to find out the most preferred digital payment application by the respondents.
Table 4
|
Table 4 Most preferred Digital Payment Application by the Respondents |
||
|
Digital Payment Apps |
No. of Respondents |
Percentage to Total (%) |
|
G-pay |
26 |
43.3 |
|
Phonepe |
11 |
18.3 |
|
Paytm |
9 |
15 |
|
Yono (SBI) |
3 |
5 |
|
BHIM Axis pay |
2 |
3.3 |
|
Ot+++her app |
3 |
5 |
|
Does not use app |
6 |
10 |
|
Total |
60 |
100.0 |
|
Source Compiled from primary data |
||
Figure 2
|
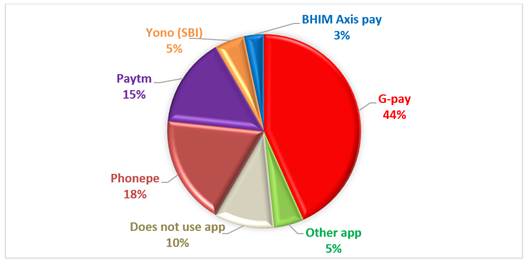
Figure 2 Most Preferred Digital Payment Application |
From the Table 4 and Figure 2, it can be clearly seen that out of total respondents, majority of them i.e., 26 respondents frequently used G-pay app, 11 of the respondents used Phonepe app and 9 of them used Paytm app often. Then 3 of the respondents used Yono (SBI) app and 2 used BHIM Axis pay app. While 3 respondents said they use other application like Amazonpay, 6 respondents said they does not use mobile application for transaction.
7.4. FREQUENCY OF USING DIGITAL PAYMENT METHODS
The researchers wanted to find out how often the respondents use digital payment methods and have analyzed the data as follows
Table 5
|
Table 5 Respondents Usage Frequency of Digital Payment Methods |
|||
|
Variables |
Categories |
No. of Respondents |
Percentage to Total (%) |
|
Usage Frequency |
Everyday |
8 |
13.3 |
|
|
Few times in a week |
22 |
36.6 |
|
|
Few times in a month |
18 |
30 |
|
|
Rarely |
12 |
20 |
|
Total |
|
60 |
100 |
|
Source Compiled from primary data |
|||
The Table 5 shows the
frequency of digital payment usage by the respondents. Out of total
respondents, majority of them i.e., 22 respondents replied they use digital
payment methods few times in a week and 18 respondents said they use few times
in a month. While 12 respondents said they rarely use digital payment method,
only 8 respondents said they use digital payment method every day. This shows
that even though respondents were aware and have the habit of using digital
payment methods, they have not fully switched to it, and they still majorly use
physical cash for their transactions.
7.5. PURPOSE OF USING DIGITAL PAYMENT METHOD
The researchers have attempted to find the major purpose of using digital payment method by the respondents as shown in Table 6
Table 6
|
Table 6 Purpose of Using Digital Payment Method by the Respondents |
||||
|
Variables |
Categories |
No. of Respondents |
Percentage to Total
(%) |
|
|
Online shopping
(Amazon, Flipkart, Swiggy, Zomato etc.) |
36 |
60 |
||
|
Usage purpose |
Money transfer |
10 |
16.6 |
|
|
Payment in shops |
5 |
8.3 |
||
|
Payment of utility
bills (electricity, mobile recharge) |
9 |
15 |
||
|
Total |
60 |
100 |
||
|
Source
Compiled from primary data |
||||
Figure 3
|
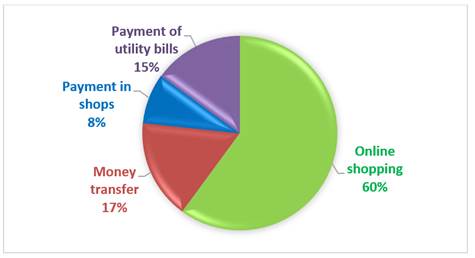
Figure 3 Purpose of Using Digital Payment Methods |
The Table 6 and Figure 3 shows that, around 60 per cent of the respondents i.e., 36 respondents use digital payment method for online shopping like payment to e-commerce websites like Amazon, Flipkart, Swiggy, Zomato etc. Then around 16 per cent of the respondents used digital payment mainly for money transfer purpose and 5 respondents used it for payment in shops (either through cards or scanning the QR code), and the remaining 9 respondents mainly used digital methods for payment of utility bills like electricity bills, mobile recharge etc.
7.6. REASONS FOR USING DIGITAL PAYMENT METHOD
The researchers attempted to find out the major reasons for using digital payment method by the respondents, which reveals the advantages or benefits of digital payment methods.
Table 7
|
Table 7 Reasons for Using Digital Payment Method |
|||
|
Variable |
Categories |
No. of Respondents |
Percentage to Total (%) |
|
Usage reasons |
Time saving |
16 |
26.6 |
|
|
Easy to use |
34 |
56.6 |
|
|
Privacy |
2 |
3.3 |
|
|
Money safety |
8 |
13.3 |
|
Total |
|
60 |
100 |
|
Source Compiled from Primary Data |
|||
Figure 4
|
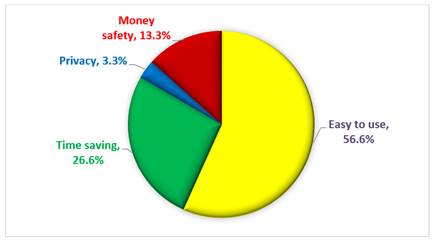
Figure 4 Reasons for Using Digital Payment Methods |
It can be seen from the Table 7 and Figure 4 that more than half of the respondents i.e., around 56 per cent of the respondents used digital payment method because it was easy to use. Then 16 respondents used digital payment because it was time saving and 8 respondents felt that their money is safe while using digital payment method and the remaining 2 respondents felt they had privacy in using digital payment method. This shows that the major reason for using digital payment method is it is easy to use and time saving which is convenient for the respondents.
7.7. RELATION BETWEEN SOCIO-ECONOMIC FACTORS AND DIGITAL PAYMENT USAGE
The researchers attempted to find out if there is any relation between the socio-economic factors and digital payment usage pattern among the respondents. For this purpose, the researchers have built crosstabulation between frequency of digital payment usage and gender and then with the monthly family income of the respondents.
Table 8
|
Table 8 Relation between Gender and Digital Payment Usage of the Respondents |
||||
|
Frequency of Digital Payment Usage * Gender of
the Respondents Crosstabulation |
|
Gender |
Total |
|
|
|
|
Female |
Male |
|
|
Frequency of Digital Payment Usage |
Everyday |
3 (37.5%) |
5 (62.5%) |
8 (100.0%) |
|
|
Few times in a week |
8 (36.4%) |
14 (63.6%) |
22 (100.0%) |
|
|
Few times in a month |
12 (66.7%) |
6 (33.3%) |
18 (100.0%) |
|
|
Rarely |
9 (75.0%) |
3 (25.0%) |
12 (100.0%) |
|
Total |
|
32 (53.3%) |
28 (46.7%) |
60 (100.0%) |
|
Source Compiled
from primary data Note Figures
in parentheses denotes percentage of female and male for each category of
frequency of digital payment usage |
||||
Figure 5
|
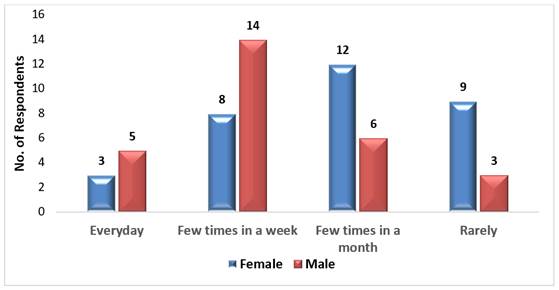
Figure 5 Gender Wise Frequency of Digital Payment Usage by the Respondents |
The Table 8 and Figure 5 shows that among the respondents who used
the digital payment every day, 3 were female and 5 were male. Those who used
few times a week, 8 were female and 14 were male. And those who used few times
a month, 12 were female and 6 were male and at last among those who rarely used
digital payment methods, 9 were female and only 3 were male. This show that
while male respondents were more in the categories of everyday usage and few
times in the week, female respondents were more in the categories of few times
in a month and rare usage. This shows that male respondents used digital
payment methods more frequently than female respondents.
Table 9
|
Table 9 Relation between Income and Digital Payment Usage of the Respondents |
||||||
|
Frequency
of Digital Payment Usage * Monthly Family Income of the Respondents
Crosstabulation |
Monthly
Family Income of the Respondents |
Total |
||||
|
Less
than Rs.10,000 |
Rs.10,001
to Rs.25,000 |
Rs.25,001
to Rs.50,000 |
Above
Rs.50,000 |
|||
|
Frequency
of Digital Payment Usage |
Everyday |
0(0) |
0(0) |
5(62.5) |
3(37.5) |
8 (100) |
|
Few
times in a week |
6(27.2) |
9(40.9) |
4(18.1) |
3 (13.6) |
22(100) |
|
|
Few
times in a month |
8(44.4) |
9(50) |
1(5.5) |
0(0) |
18(100) |
|
|
Rarely |
5(41.6) |
5(41.6) |
2(16.6) |
0(0) |
12(100) |
|
|
Total |
19 |
23 |
12 |
6 |
60 |
|
|
Source Compiled from primary data Note Figures in parentheses denotes percentage of each
income category to each category of frequency of digital payment usage |
||||||
Figure 6
|
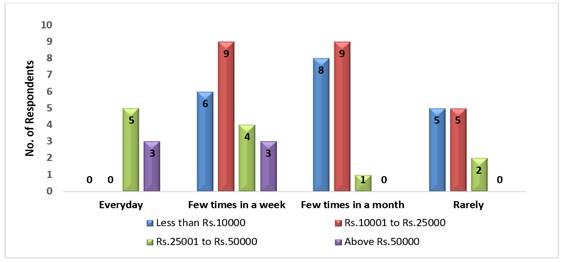
Figure 6 Income-wise frequency of Digital Payment Usage by the Respondents |
The Table 9 and Figure 6 shows that among the total 8 respondents who said they used digital payment method every day, 5 were from the Rs.25,001 to Rs.50,000 income category and 3 respondents belonged to above Rs.50,000 income category and no respondents from the income category of less than Rs.10,000 and Rs. 10,001 to Rs.25,000 replied of using digital transaction every day. Among the 22 respondents who used few times a week, 6 (27.2 per cent) were from less than Rs.10,000 category, 9 (40.9 per cent) from Rs.10,001 to Rs.25,000 category, 4 (18.1 per cent) were from Rs.25,001 to Rs.50,000 category and 3 (13.6 per cent) were from above Rs.50,000 income category. Then from the 18 respondents who said they used digital payment methods only few times a month, 8 respondents (44.4 per cent) were from less than Rs.10,000 income category, 9 (50 per cent) from Rs.10,001 to Rs.25,000 category, and 1 was from Rs.25,001 to Rs.50,000 category and there were no respondents from above Rs.50,000 income category who used few times a month. Among the 12 respondents who rarely used digital payment methods, 5 (41.6 per cent) were from less than Rs.10,000 income category and another 5 respondents (41.6 per cent) from Rs. 10,001 to Rs.25,000 income category, 2 (16.6 per cent) from Rs.25,001 to Rs.50,000 income category and no one from above Rs.50,000 income category. This clearly shows that respondents who belonged to higher income category used digital payment more frequently comparatively to those with less income.
7.8. ISSUES IN DIGITAL PAYMENT METHODS
The researchers
also sought to know about the issues faced by the respondents in digital
payment methods. Some of the issues stated by the respondents were lack of
technical knowledge to solve the problem when there was any network issue or
technical problem in the device. This has led to loss of money sometimes or
debarred from processing the transaction which has caused inconvenience to the
respondents. They also stated about the security risk of their personal and
banking information and raised concern about ID thefts, phishing attacks,
and database exploits. Few respondents
have said they have received spam calls and messages asking for their banking
information which have made them anxious about the digital transaction methods.
Some method of payment incurred fee for doing digital transactions and
in some cases, there were restrictions in the amount of digital transaction.
Further, some respondents also
expressed difficulty in frequently changing the login and transaction password
for internet banking which they must remember correctly to process the transaction.
These are the some of the issues shared by the respondents regarding digital
payment methods.
8. Summary and Conclusion
In a country like India, at the time where digital payments are gaining popularity among all sections of the society, this study was carried out. From the analysis of digital payment usage among the student community of Tiruchirappalli city, it was found that all the respondents used one or the other digital payment method for transaction purpose. While only a few respondents said they use digital transaction every day, many came under the category of few times a month or rare usage. This shows that, though the people have the knowledge and facility to use digital payment method, they have not completely switched over to cashless transaction and they use it only when it was absolutely required. Further some respondents also shared that they faced some issues while using digital payment method and some have undergone scams like phishing and network attack. This calls for proper precautions and awareness among the people about the digital payment system which is considered to be the future in upcoming era.
CONFLICT OF INTERESTS
None.
ACKNOWLEDGMENTS
None.
REFERENCES
Bhatia, S. (2021, September 17). Digital Payments in India : Definition, Methods and Importance. Razorpay Learn.
Brajesh (2021, September 16). What is Digital Payment Transaction System ? Adda247School.
Himani (2018). A Study of Consumer Perception Regarding Digital Payment System in India. International Journal in Management and Social Science, 6(08), 13-23.
Jain, A. & Rai, M. (2020). An Empirical Study on Digital Payment Behavior During Lockdown. Shodh Sarita, 7(28), 12-17.
PIB (2023, February 08). Digital Transactions in India. Ministry of Electronics & IT, Government of India.
Pandey, S. K. (2022). A Study on Digital Payments System & Consumer Perception : An Empirical Survey. Journal of Positive School Psychology, 6(3), 10121-10131.
RBI (2022, May). Pictorial Representation of Trends in Payment Systems. Reserve Bank of India.
RBI Bulletin (2021). Retail payment habits in India. Department of Statistics and Information Management (DSIM), Reserve Bank of India,
Shree, S., Pratap, B., Saroy, R., & Dhal, S. (2021). Digital Payments and Consumer Experience in India : A Survey Based Empirical Study. Journal of Banking and Financial Technology, 5, 1-20. https://doi.org/10.1007/s42786-020-00024-z.
Singh, Priyanka., Supriya, N., & Joshna, M. S. (2013). Issues and Challenges of Electronic Payment Systems. International Journal for Research in Management and Pharmacy, 2(9), 25-30.
 This work is licensed under a: Creative Commons Attribution 4.0 International License
© Granthaalayah 2014-2023. All Rights Reserved.