SIMILAR PROPERTIES AND GENETIC PARAMETERS OF LOCAL VARIETIES OF GOGO RICE
Sakka Samudin 1![]()
![]()
1 Agrotechnology
Study Program, Faculty of Agriculture, University of Tadulako,
Indonesia
|
|
|
ABSTRACT |
|
|
The genetic
resources of food plants are an indispensable asset for the formation or
improvement of the characteristics of superior varieties. These genetic
resources continue to experience erosion due to modern agricultural
practices, so they must be preserved through exploration, characterization,
and estimation of genetic parameters. This study aims to determine the
similarity of traits and genetic parameters of local upland rice varieties.
The experiment was conducted at the Sidondo
experimental garden, Sidondo Village, Tambubulava District, Sigi Regency, from April to August
2019. The study used a Randomized Block Design with 24 local varieties as the
treatment, which was repeated three times so that there were 72 experimental
plots. The cluster analysis results showed 3 clusters of grouping varieties,
namely one variety for cluster 1, 6 types for cluster 2, and 17 combinations
for cluster 3. 10 traits had high coefficients of genetic diversity. The
number of seeds per panicle, leaf area, plant height, number of tillers, leaf
length, flowering age, and stem diameter are traits with high heritability
and genetic progress. The number of productive tillers is a trait with a
simple correlation value and a heightened direct effect on yield, so indirect
selection can be made to increase upland rice yield. |
|||
|
Received 29 March 2023 Accepted 30 April
2023 Published 15 May 2023 Corresponding Author Sakka Samudin, sakka01@yahoo.com DOI 10.29121/granthaalayah.v11.i4.2023.5145 Funding: Researchers
would like to thank Sarwanto, SP, who assisted in
field research. In addition, we also thank Tadulako
University for funding this research. Copyright: © 2023 The
Author(s). This work is licensed under a Creative Commons
Attribution 4.0 International License. With the
license CC-BY, authors retain the copyright, allowing anyone to download,
reuse, re-print, modify, distribute, and/or copy their contribution. The work
must be properly attributed to its author.
|
|||
|
Keywords: Genetic Diversity, Heritability, Genetic
Progress, The Correlation Between Traits, Local Varieties of Upland Rice |
|||
1. INTRODUCTION
Central Sulawesi is one of the provinces with a variety of local rice that needs to be preserved and utilized for sustainable development to improve the welfare of all the people. Local rice is potential germplasm as a source of genes that control important traits in rice plants. High genetic diversity in local rice can be utilized in rice breeding programs. It is necessary to continue to identify the important characteristics found in local rice to identify their potential in breeding programs Kartahadimaja et al. (2021).
The genetic resources of food plants are a very important asset because they contain the traits needed for the formation or improvement of the desired superior variety of attributes. However, genetic resources continuously deteriorate due to low attention to and utilization of genetic resources and changes in traditional agricultural practices. Introducing early maturing superior varieties to rice production centers in various regions can cause genetic erosion of local types in certain areas Shahbaz & Ashraf (2013). Genetic erosion due to modern agricultural practices has made collecting and conserving germplasm increasingly important Rabbani et al. (2008). To anticipate the erosion of plant genes, it is necessary to preserve plant genetic material through exploration, characterization, and estimation of genetic parameters Sadimantara et al. (2018), Maftuchah et al. (2021).
Exploration is the initial stage in plant breeding programs to search for genetic resources and increase genetic variability. Characterization is an activity to identify important traits that have economic value or are the characteristics of the variety in question. These activities are indispensable in plant breeding programs Anyaoha (2018). Genetic resource characterization will enrich the "gene pool" with new diversity from these local varieties for assembling new varieties Sadimantara et al. (2018). These genetic resources are useful for supporting sustainable food security Bakhtiar et al. (2011).
Characterization of qualitative and quantitative traits can be used to determine the similarity of traits between local varieties that have been explored. In addition, the estimation of genetic parameters is very important to develop high-yielding varieties. Developing high-yielding varieties through genetic improvement is one of the strategic ways to be done. Developing these varieties requires knowledge of genetic diversity, heritability, and correlation between traits. Knowledge of the genetic diversity of the traits that contribute to yield, the relationships between these traits, and their relationship to yield is indispensable for the success of a plant breeding program Choudhary et al. (2013). Genotypic and phenotypic diversity coefficients are useful in predicting the presence of diversity in germplasm Idris et al. (2012) . Genetic progress in selection depends primarily on the amount of genetic diversity Selvaraj & Nagarajan (2011).
Coefficients of genetic diversity, together with estimators of heritability, will give the best picture of the amount of progress expected from selection Selvaraj & Nagarajan (2011). Thus, knowledge about heritability and genetic progress is very important to determine the traits that can be passed on to further generations. The research results by Paikhomba et al. (2014) showed that heritability in a broad sense was high for plant height, 50% flowering age, panicle length, number of filled seeds per panicle, and seed yield.
The selection of expected genotypes in plant breeding programs is based on several criteria: yield and qualitative characteristics are very important final goals Kozak (2008). The relationship between yield and the traits contributing to yield also plays an important role in plant breeding Kiani & Nematzadeh (2012). The magnitude of the genetic diversity, heritability, and correlation between traits in the exploratory material needs to be known. This study aims to determine a). The similarity in nature, b). Genetic diversity coefficient, c). Heritability and d) correlation between characteristics of local varieties of upland rice.
2. MATERIALS AND METHODS
The research was carried out at the Sidondo Experimental Garden, Sidondo Village, Tambulava District, Sigi Regency, from April to August 2019, at an altitude of 150 meters above sea level. The materials used consist of leaf area meters, 24 local varieties from exploration results in Tojo Una-Una Regency, which is located between Coordinates 121° 46' 03.2 to 121° 50' 11.4" East
Longitude and 01° 16' 01, 6" to 01° 18' 58.4" South Latitude, Sigi Regency which is located at coordinates 1020'18" -1043'22" South Latitude and 119o4'04" -120007'53 East Longitude, Buol Toli-Toli Regency which is located at coordinates 0.30o-1.2o North Latitude and 120o-122.09o East Buju and Banggai Regency at coordinates 0030' - 2020' South Latitude and 122023' - 124020' East Longitude. The experiment used a randomized block design with 24 local varieties as a treatment consisting of three groups based on soil fertility, so there were 72 experimental plots. Each plot has an area of 1 meter x 2 meters; the distance between plots is 50 cm, while between groups is 1 meter. Spacing 20 cm x 25 cm, each experimental plot consisted of 40 plants. The land is cleared of grass and then plowed with the Mercator twice. They then made beds with a length of 2 meters, a width of 1 meter, and a height of 25 cm. Ten days before planting, manure is spread over the beds evenly at a dose of 20 tons/ha or the equivalent of 4 kg. plot-1. Furthermore, TSP and KCl fertilizers at a dose of 75 kg.ha-1 and 50 kg.ha-1 respectively was applied to each bed the day before planting using a scattering method. Planted by drilling method, 3 seeds per hole with a depth of 2 cm and thinned to one seed per hole at the age of 21 days. Urea fertilizer was given twice, doses of 100 kg.ha-1 in an array at 25 days after planting and 100 kg.ha-1 at 55 days after planting. Pest control uses the active ingredient Buprofezin (Apllaud 400 EC) at a dose of 2 ppm and Dharmabas 500 EC (active ingredient Fenobukarb) at 4 ppm. Harvesting is done with the criteria > 90% of the grain is yellow, and there is still a little green grain at the bottom of the panicle. The observed variables for cluster analysis were leaf surface, leaf angle, flag leaf angle, leaf collar color, leaf ear color, leaf node color, leaf blade color, leaf sheath color, leaf tongue color, stem angle, leaf tongue shape, segment color stem, panicle length, panicle type, lemma, and palea color, presence of hairs on lemma and palea, grain tip color, grain tip hair color, hair length, seed length, seed width, 1000 grain weight, seed thickness, grain calcification, rice length broke, broken rice shape, epidermis color, aroma, and amylose content. Cluster analysis based on morphological characters used Syst 8.0.3 software. Variables observed for genetic parameters included: plant height at harvest, stem diameter, number of tillers, number of productive tillers, flowering age, harvest age, leaf length, leaf width, leaf area, panicle length, seed length, seed width, seed thickness, number of seeds per panicle, the weight of 1000 grains, and yield. Analysis of genotypic and phenotypic diversity used formula of Hossain et al. (2015). Heritability using the formulation of Johnson et al. (1955) . The correlation coefficient of genotypic and phenotypic trait pairs was calculated according to the formulation of Al-Jibouri et al. (1958). The direct and indirect effects were calculated using the formulation of Dewey and Lu (1959) .
3. RESULTS AND DISCUSSION
3.1. Similarity of properties
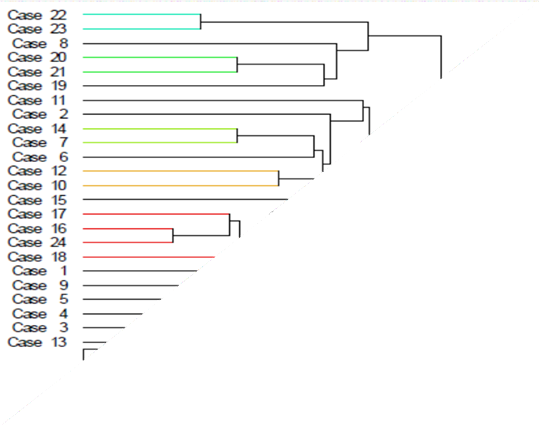
The results of the cluster analysis showed that there were 3 clusters of grouping varieties, namely cluster 1 consisting of variety number 13, cluster 2 composed of 6 varieties number 8, 19, 20, 21,
22, and 23, while cluster 3 consisted of 17 varieties number 1, 2, 3, 4, 5, 6, 7, 9, 10, 11, 12, 14, 15, 16, 17, 18 and 24 (Figure 1). Each variety is grouped based on similar characteristics. At a distance of 0.00 Euclid, all local types have different properties. At a distance of 6.1, two local varieties have the same features, namely varieties 24 and 16. At a length of 10.6, four varieties have the same characteristics, namely numbers 16, 17, 18, and 24. At a distance of 19.06, 7 types have the
same features: varieties 1, 2, 8, 11, 15, 19, and 22. According to Sokal (1963), the more similarities in morphological characters that are owned indicates that the closer the kinship is, the fewer the similarities in morphological characters—the more distant the kinship. Grouping based on observed properties shows that each cluster comes from a different ancestor or place. Anyaoha et al. (2018) reported grouping 77 rice genotypes based on their origin. Asante et al. (2019) observed 100 rice accessions and obtained 3 clusters, cluster 1 consisted of 77 genotypes, cluster 2 consisted of 12 genotypes, and Cluster 3 had 11 genotypes. The differences in these clusters are due to the origin of the accessions and their different genetic backgrounds. Sohrabi et al. (2012) evaluated 50 upland rice accessions and obtained 6 groups. The first cluster has 6 acquisitions, the second cluster has 10 accessions, cluster 3 has 27 accessions, cluster 4 has 2 accessions, cluster 5 has 4 accessions, and the group has only one acquisition.
Figure 1
|
Figure 1 |
3.2. Coefficient of Genetic Diversity
The values of the coefficient of variation, standard deviation, coefficient of genetic diversity, and coefficient of phenotypic diversity are presented in Table 1. The importance of the coefficient of gene diversity ranged from 1.00 to 20.20. This means that the data obtained is normally distributed. In addition, the data's standard deviation (standard deviation) ranges from 0.02 to 51.89. This normal deviation value is smaller than the average value, meaning that the data distribution meets the requirements for analysis. The coefficient of phenotypic variation was greater than the coefficient of genotypic variation for all observed traits. This shows that environmental factors are more dominant than genetic factors in the appearance of characteristics. This study's results align with the results obtained by Akter et al. (2010) on rice plants. The large coefficients of genotypic and phenotypic diversity indicate that improving these traits promises to be achieved through selection Abreu et al. (2016).
Plant height, stem diameter, leaf length, leaf width, leaf area, number of tillers, number of seeds per panicle, number of productive tillers, and yield and seed width are traits that have high coefficients of genetic diversity (Table 1). This study's results align with those found by previous researchers such as Nandeshwar et al. (2010) and Sanghera and Sanghera & Kashyap (2012).
Table 1
|
Table 1 Values of the Coefficient of Diversity, Standard Deviation, Coefficient of Genetic Diversity, Coefficient of Phenotypic Diversity of Some Traits of Local Varieties of Upland Rice |
||||
|
Traits observed |
Coefficient of diversity |
Standard deviation |
Coefficient of genetic diversity |
Coefficient of phenotypic variation |
|
Plant height |
4.76 |
133.82±20.92 |
14.62 |
15.37 |
|
Stem diameter |
9.81 |
0.29±0.08 |
27.29 |
29.00 |
|
Panicle Length |
5.80 |
29.09±4.09 |
13.05 |
14.28 |
|
Leaf length |
7.09 |
63.96±13.01 |
19.37 |
20.62 |
|
Leaf width |
8.70 |
1.48±0.32 |
20.34 |
22.15 |
|
Leaf area |
8.59 |
72.88±24.73 |
33.29 |
34.38 |
|
Flowering age |
1.00 |
83.58±10.81 |
13.06 |
13.10 |
|
Harvest age |
1.34 |
124.10±7.12 |
5.65 |
5.81 |
|
Number of puppies |
9.47 |
24.93±18.08 |
72.79 |
73.40 |
|
Weight 1000 seeds |
2.81 |
23.90±3.32 |
13.66 |
13.94 |
|
Number of seeds per panicle |
16.14 |
160.71±51.89 |
27.84 |
32.18 |
|
Seed length |
13.87 |
0.98±0.23 |
18.88 |
23.43 |
|
Seed width |
6.33 |
0.31±0.05 |
15.77 |
17.00 |
|
Seed thickness |
6.39 |
0.22±0.02 |
8.02 |
10.26 |
|
Number of productive tillers |
20.20 |
16.40±10.00 |
58.50 |
61.89 |
|
yield |
18.29 |
3.47±1.84 |
47.61 |
51.01 |
3.3. Heritability and Genetic Progression
Heritability is a genetic parameter used to measure the degree of inheritance of a character in a plant population or an estimate that measures the extent to which the role of genetic factors causes the variability of a character's appearance in a population. If a character has a high heritability value, that character's appearance is more controlled by genetic factors so that the character can be called a character that is easily inherited. Genetic factors are more important in maintaining a trait than environmental factors.
Heritability estimated values ranged from 0.61 to 0.99. This means that the heritability value in the broad sense observed is high (Table 2). This study's results align with the results found by Akhtar et al. (2011) for the number of seeds per panicle, plant height, flowering age, weight of 100 grains, and yield. Anyaoha et al. (2018) showed that high heritability for 1000 seed weight, flowering age up to 50%, harvest age, and the number of panicles (63.89%) indicated that these traits could be easily phenotypically selected in the field during the program. Breeding The research results by Nandeshwar et al. (2010) found that heritability values were high for plant height, panicle length, number of seeds per panicle, seed length, seed width, 1000 grain weight, and yield. The results of Babu et al. (2012) showed that the heritability values obtained were high for 50% flowering age, plant height, panicle length, seed length, seed width, 1000 seed weight, and yield. Asfaliza et al. (2012) also found a high heritability predictive value for seed length and weight.
Table 2
|
Table 2 Value of Genetic Variety, Environment, Phenotype, Heritability, and Genetic Progress of Some Traits of Local Varieties of Upland Rice |
|||||
|
Traits
observed |
Genetic
Variation |
Environmental
Variation |
Phenotype
Variety |
Heritability |
Genetic
progress |
|
Plant
height |
406.88 |
43.22 |
450.11 |
0.9 |
33.09 |
|
Stem
diameter |
0.00711 |
0.000919 |
0.008029 |
0.89 |
15.50 |
|
Panicle
Length |
14.35 |
2.83 |
17.18 |
0.84 |
5.98 |
|
Leaf
length |
150.96 |
20.22 |
171.18 |
0.88 |
20.07 |
|
Leaf
width |
0.09 |
0.02 |
0.11 |
0.84 |
0.48 |
|
Leaf
area |
588.69 |
39.23 |
627.91 |
0.94 |
40.57 |
|
Flowering
age |
119.56 |
0.71 |
120.27 |
0.99 |
18.81 |
|
Harvest
age |
49.28 |
2.76 |
52.03 |
0.95 |
11.79 |
|
Number
of puppies |
330.91 |
5.61 |
336.51 |
0.98 |
31.12 |
|
Weight
1000 seeds |
10.83 |
0.46 |
11.29 |
0.96 |
5.58 |
|
Number
of seeds per panicle |
2047.47 |
688.06 |
2735.53 |
0.75 |
67.97 |
|
Seed
length |
0.03 |
0.02 |
0.05 |
0.65 |
0.26 |
|
Seed
width |
0.0024 |
0.0004 |
0.0028 |
0.86 |
0.08 |
|
Seed
thickness |
0.0003 |
0.0002 |
0.0005 |
0.61 |
0.02 |
|
Number
of |
91.99 |
10.97 |
102.96 |
0.87 |
15.64 |
|
productive
tillers |
|||||
|
yield |
2.98 |
0.48 |
3.46 |
0.89 |
2.81 |
|
Description: Genetic progress with a selection intensity of
10% (t=1.75) |
|||||
Heritability value alone cannot predict breeding value Aditya & Bhartiya (2017). The heritability associated with the average genetic progress is very effective and can be accounted for in predicting the results of effective selection Chuchert et al. (2018). Genetic progress is the increase in certain traits of the new population compared to the base population in genotypic values under selection at a certain selection intensity Wolie et al. (2013).
High heritability does not necessarily indicate high genetic progress. For example, the yield trait has a heritability in a broad sense of 0.89 with a genetic improvement of only 2.81. Likewise, leaf width with a heritability of 0.84 (height) but genetic progress of only 0.48 (Table 2). Therefore, a high heritability value followed by a high genetic progress value can be used to make an earlier selection because the additive gene content is more dominant.
The number of seeds per panicle is a trait that has high heritability value and genetic progress, followed by the characteristics of leaf area, plant height, number of tillers, leaf length, flowering age, and stem diameter. If crossed, these traits are easily passed on to their offspring, and selection can be made in the early generations. Several other characteristics with high heritability values but low genetic progress indicate that these traits are difficult to pass on to further generations (offspring), and selection must be made at more advanced ages
The study by Singh (2011) showed that heritability and genetic progress had high expectations for plant height, panicle length, seed length, yield, flowering age, and harvest age. Asante et al. (2019), high heritability (> 60%) coupled with moderately advanced genetics as a percent of the mean was observed for the ratio of kernel length to width, kernel length, flowering days, plant height, kernel length, and indications the grain length/width ratio that additive gene effects control these properties. High heritability accompanied by the moderate genetic gain (%) for flowering life and panicle length was reported by Hossain et al. (2015). Consequently, these traits can be enhanced through simple selection methods that focus on the performance of individuals in the population.
3.4. Correlation Between Traits
Seed yield is a complex polygenic trait controlled by many genes that interact with the environment and is the product of many factors called yield components. Correlation coefficients can also help identify traits with little or less importance in the selection program. The existence of a correlation can provides information about the influence of linked genes or the influence of pleiotropy genes or physiology, and the influence of developmental relationships or environmental influences or in all combinations Chouhan et al. (2014).
The results showed that the relationship between several traits with positive and negative results ranged from 0.13 to 0.82. Plant height positively correlated with yield, but it was insignificant.
Table 3
|
Table 3 The Genotypic (Above the Diagonal) and Phenotypic
(Below the Diagonal) Correlations
of Some Traits on the Yield of Upland Rice Local Varieties |
||||||||||||||||
|
Traits |
PH |
SD |
PL |
LL |
LW |
LA |
FA |
HA |
NP |
1000
S |
NSP |
SL |
SW |
ST |
NPT |
Y |
|
PH |
- |
-0.53* |
0.14 |
0.23 |
-0.43* |
-0.16 |
0.19 |
0.36* |
-0.09 |
-0.49* |
0.33* |
0.16 |
-0.16 |
-0.38* |
-0.08 |
0.13 |
|
SD |
-0.49* |
- |
0.27 |
-0.2 |
0.56* |
0.40* |
-0.49* |
-0.23 |
-0.05 |
0.35* |
-0.23 |
-0.06 |
0.52* |
0.43* |
-0.04 |
-0.13 |
|
PL |
0.14 |
0.21 |
- |
0.13 |
0.16 |
0.27 |
0.11 |
0.14 |
0.02 |
-0.29 |
0.46* |
0.38* |
0.35* |
0.3 |
0.07 |
0.43* |
|
LL |
0.27 |
-0.17 |
0.12 |
- |
0.31* |
0.49* |
-0.22 |
0.50* |
0.43* |
-0.04 |
0.53* |
0.30 |
-0.3 |
-0.16 |
0.55* |
0.56* |
|
LW |
-0.39* |
0.50* |
0.24 |
0.29 |
- |
0.81** |
-0.35* |
0.42* |
0.53* |
-0.02 |
0.04 |
0.27 |
0.24 |
0.14 |
0.62* |
0.38* |
|
LA |
-0.12 |
0.37* |
0.11 |
0.48* |
0.75** |
- |
-0.27 |
0.40* |
0.41* |
-0.21 |
0.18 |
0.39* |
0.05 |
-0.13 |
0.57* |
0.47* |
|
FA |
0.18 |
-0.46* |
0.14 |
-0.21 |
-0.32* |
-0.27 |
- |
0.3 |
-0.11 |
-0.52* |
0.17 |
-0.16 |
-0.11 |
-0.16 |
-0.09 |
0.04 |
|
HA |
0.33* |
-0.21 |
0.01 |
0.46* |
0.36* |
0.37* |
0.29 |
- |
0.3 |
-0.48* |
0.38* |
0.21 |
-0.03 |
-0.03 |
0.40* |
0.37* |
|
NP |
-0.09 |
-0.04 |
-0.25 |
0.41* |
0.49* |
0.38* |
-0.11 |
0.29 |
- |
-0.1 |
0.41* |
0.14 |
-0.37* |
-0.39* |
0.95** |
0.74** |
|
1000S |
-0.46* |
0.33* |
0.48* |
-0.03 |
-0.03 |
-0.2 |
-0.51* |
-0.44* |
-0.09 |
- |
-0.25 |
-0.36* |
0.01 |
0.46* |
-0.25 |
-0.25 |
|
NSP |
0.26 |
-0.21 |
0.24 |
0.42 |
0.04 |
0.13 |
0.16 |
0.31* |
0.33* |
-0.23 |
- |
0.16 |
-0.09 |
0.01 |
0.48* |
0.82** |
|
SL |
0.08 |
-0.05 |
0.27 |
0.22 |
0.12 |
0.25 |
-0.13 |
0.18 |
0.1 |
-0.27 |
0.1 |
- |
0.23 |
-0.08 |
0.3 |
0.35* |
|
SW |
-0.11 |
0.45* |
0.27 |
-0.26 |
0.22 |
0.03 |
-0.1 |
-0.02 |
-0.32 |
0.01 |
-0.08 |
0.11 |
- |
0.77 |
-0.31 |
-0.18 |
|
ST |
-0.33* |
0.35* |
0.22 |
-0.12 |
0.05 |
-0.8 |
-0.11 |
-0.01 |
-0.29 |
0.38* |
-0.01 |
-0.08 |
0.51* |
- |
-0.41* |
-0.17 |
|
NPT |
-0.08 |
-0.03 |
0.07 |
0.49* |
0.54* |
0.5 |
-0.08 |
0.37* |
0.91** |
-0.23 |
0.36* |
0.19 |
-0.26 |
-0.29 |
- |
0.82** |
|
Y |
0.09 |
-0.11 |
0.44 |
0.52* |
0.34* |
0.40* |
0.05 |
0.33* |
0.71** |
-0.24 |
0.78** |
0.2 |
-0.13 |
-0.08 |
0.73** |
- |
|
Description: plant height (PH), stem diameter (SD),
panicle length (PL), leaf length (LL), leaf width (LW), leaf area (LA),
flowering age (FA), harvest age (HA), number puppies (NP), weight 1000 seeds
(1000 S), Number of seeds per panicle (NSP), Seed length (SL), Seed width
(SW), Seed thickness (ST), Number of productive tillers (NPT) and yield (Y) |
||||||||||||||||
Stem diameter negatively correlated with yield. Panicle length, leaf length, leaf width, and leaf area were significantly positively correlated with rice yields. Age at harvest and number of tillers had a significant positive correlation with yield. Except for the flowering age, there is no significant positive correlation with yield. The number of seeds per panicle, seed length, and productive tillers significantly correlated with yield. Meanwhile, the weight of 1000 seeds and the width and thickness of the seeds had no significant negative correlation with the yield of rice plants (Table 3). Panicle length, leaf length, leaf width, leaf area, harvest age, number of tillers, number of seeds per panicle, length of seeds, and number of productive tillers can be used as indicators of indirect selection to increase rice yields.
This study's results align with the results obtained by Rahman et al. (2014) that there is a genotypic correlation between plant height and yield, but it is not significant. Panicle length and weight of 100 seeds were positively correlated with yield. Idris et al. (2012) observed a positive genotypic and phenotypic relationship between yield and number of filled seeds per panicle, panicle length, and number of seeds per panicle. Sadeghi (2011) observed a significant positive relationship between seed yield and seeds per panicle, harvest age, number of productive tillers, and flowering time. Ullah et al. (2011) detected a positive and significant relationship between seed yield, panicle length, and seeds per panicle.
3.5. Path Analysis
The relationship between the outcome components and the results using a simple correlation is less meaningful because the correlation needs to consider the influence of other traits contributing to the results. Therefore, it is necessary to show how much direct and indirect impact there is between an attribute and the intended main characteristic. A trait's direct and indirect effects on rice yields are presented in Table 4. The table shows that the explicit effect values range from -0.04 to 1.92. The number of seeds per panicle has a significant and high genetic correlation to yield, but the direct effect is small and negative.
The number of productive tillers has a high direct effect (1.72) through plant height (5.72), stem diameter (-1.24), panicle length (-7.21), leaf length (-5.66), width leaf (-2.64), leaf area (12.92), age of flowering (3.94), age of harvest (-4.37), number of tillers (-5.51, the weight of 1000 seeds (4.14), number of sources per panicle (3.41), seed length (1.27), leaf width (0.28) and leaf thickness (4.51). The high direct effect of the number of productive tillers on yield is due to the high and positive indirect effect through plant height, leaf area, flowering age, 1000 grain weight, number of seeds per panicle, seed width and seed thickness, and high correlation to yield Traits that have a real positive genetic correlation and a heightened direct effect on yield can be used as criteria natural selection to increase profits.
The results of Htwe et al. (2019) showed that the number of productive tillers, filled grains, and per malai grains had a direct effect and a high correlation with rice yields. Kampe (2018) showed that flowering age, panicle length, and the number of fertile tillers per plant had a direct effect and a high genotypic correlation on rice yields. The results of research by Tejaswini et al. (2016) obtained panicle length to have a direct effect and a high correlation to rice yield
Table 4
|
Table 4 The Direct (Bolt Letters) and Indirect Effects of
Some of the Yield Component Properties on the Yield of Local Upland Rice |
||||||||||||||||
|
Traits |
PH |
SD |
PL |
LL |
LW |
LA |
FA |
HA |
NP |
1000
S |
NSP |
SL |
SW |
ST |
NPT |
Y |
|
PH |
1.60 |
-4.64 |
-6.88 |
-7.78 |
-3.76 |
21.68 |
5.53 |
-7.14 |
-0.24 |
6.08 |
1.91 |
-0.06 |
1.24 |
7.36 |
2.91 |
0.13 |
|
SD |
0.77 |
0.17 |
-0.52 |
-0.32 |
-2.82 |
2.18 |
0.93 |
0.28 |
0.59 |
0.26 |
-0.32 |
0.41 |
-0.62 |
1.00 |
0.60 |
-0.13 |
|
PL |
-1.31 |
1.13 |
-0.25 |
1.67 |
1.74 |
-5.29 |
-0.90 |
1.19 |
-0.59 |
-0.93 |
-0.53 |
0.02 |
-0.60 |
-1.67 |
-0.02 |
0.43* |
|
LL |
-2.67 |
2.20 |
1.97 |
-0.56 |
0.87 |
-7.18 |
-0.67 |
0.96 |
0.23 |
-2.50 |
-1.70 |
-0.19 |
0.23 |
-2.00 |
-0.72 |
0.56* |
|
LW |
5.17 |
-3.08 |
-3.76 |
-2.36 |
0.51 |
8.31 |
3.72 |
-6.18 |
-0.05 |
1.68 |
1.54 |
-0.37 |
-0.27 |
4.00 |
-1.18 |
0.38* |
|
LA |
0.97 |
-2.50 |
-0.76 |
-3.08 |
-3.26 |
0.50 |
0.41 |
-0.40 |
0.21 |
2.28 |
0.29 |
-0.49 |
1.05 |
1.07 |
0.69 |
0.47* |
|
FA |
5.08 |
-2.32 |
-4.61 |
-3.62 |
-2.63 |
13.72 |
0.95 |
-5.03 |
0.92 |
3.97 |
0.87 |
0.46 |
1.09 |
4.55 |
0.71 |
0.04 |
|
HA |
-4.26 |
3.47 |
3.07 |
3.20 |
1.41 |
-11.67 |
-3.11 |
-0.96 |
0.20 |
-2.30 |
-0.86 |
0.54 |
-0.94 |
-4.08 |
-1.52 |
0.37* |
|
NP |
-3.29 |
0.00 |
5.04 |
2.25 |
-1.18 |
-5.60 |
-2.53 |
3.18 |
-0.48 |
-1.51 |
-3.23 |
-0.99 |
0.91 |
-2.33 |
-3.72 |
0.74* |
|
1000S |
4.24 |
-1.15 |
-4.48 |
-2.70 |
-0.48 |
8.45 |
3.95 |
-3.11 |
0.96 |
0.46 |
1.66 |
1.18 |
0.86 |
2.44 |
-0.59 |
-0.25 |
|
NSP |
-2.25 |
1.38 |
1.84 |
2.02 |
2.14 |
-6.29 |
-1.56 |
1.56 |
1.02 |
-1.84 |
-0.04 |
-0.10 |
-0.57 |
-2.13 |
-2.76 |
0.82* |
|
SL |
2.45 |
-1.92 |
-1.84 |
-2.86 |
-1.75 |
7.87 |
1.82 |
-2.10 |
1.13 |
2.11 |
0.43 |
0.64 |
0.01 |
2.74 |
-0.51 |
0.35* |
|
SW |
-5.07 |
4.58 |
3.41 |
7.24 |
4.28 |
-17.52 |
-2.39 |
3.82 |
1.01 |
-4.10 |
-1.28 |
0.56 |
-1.37 |
-6.20 |
-2.58 |
-0.18 |
|
ST |
6.35 |
-6.97 |
-4.83 |
-9.45 |
-7.16 |
23.80 |
3.07 |
-4.90 |
-1.34 |
5.91 |
1.42 |
-0.93 |
1.22 |
1.92 |
4.85 |
-0.17 |
|
NPT |
5.72 |
-1.24 |
-7.21 |
-5.66 |
-2.64 |
12.92 |
3.94 |
-4.37 |
-5.51 |
4.14 |
3.41 |
1.27 |
0.28 |
4.51 |
1.78 |
0.82* |
|
Description: plant height (PH), stem diameter
(SD), panicle length (PL), leaf length (LL), leaf width (LW), leaf area (LA),
flowering age (FA), harvest age (HA), number puppies (NP), weight 1000 seeds
(1000 S), Number of seeds per panicle (NSP), Seed length (SL), Seed width (SW),
Seed thickness (ST), Number of productive tillers (NPT) and yield (Y) |
||||||||||||||||
CONFLICT OF INTERESTS
None.
ACKNOWLEDGMENTS
None.
REFERENCES
Abreu, H. K. A. de, Teodoro, P. E., Pantaleão, A. D. A., & Correa, A. M. (2016). Genetic Parameters, Correlations and Path Analysis in Upland Rice Genotypes. Bioscience Journal, 354–360. https://doi.org/10.14393/bj-v32n2a2016-29308.
Aditya, J. P., & Bhartiya, A. (2017). Assessment of Genetic Variability in Spring Sown Upland Rice of Uttarakhand Hills. ORYZA-An International Journal of Rice, 53(2).
Akhtar, N., Nazir, M. F., Rabnawaz, A., Mahmood, T., Safdar, M. E., Asif, M., & Rehman, A. (2011). Estimation of Heritability, Correlation and Path Coefficient Analysis in Fine Grain Rice (Oryza sativa L.). Journal of Animal and Plant Sciences, 21(4).
Akter, S., Biswas, B. K., A.K. Azad, M. H., & Arifuzzaman, M. (2010). Variability, Heritability and Genetic Advance in Fine Rice (Oryza sativa L.) Available In Bangladesh. J. Sci. Technol, 8, 183–192.
Al-Jibouri, H. A., Miller, P. A., and Robinson, H. F. (1958). Genotypic and Environmental Variances and Covariances in an Upland Cotton Cross of Interspecific Origin. https://doi.org/10.2134/agronj1958.00021962005000100020x.
Anyaoha, C., Adegbehingbe, F., Uba, U., Popoola, B., Gracen, V., Mande, S., Onotugoma, E., & Fofana, M. (2018). Genetic Diversity of Selected Upland Rice Genotypes (Oryza sativa L.) for Grain Yield and Related Traits. International Journal of Plant & Soil Science, 22(5), 1–9. https://doi.org/10.9734/IJPSS/2018/40406.
Asante, M. D., Adjah, K. L., & Annan-afful, E. (2019). Assessment of Genetic Diversity for Grain Yield and Yield Component Traits in Some Genotypes of Rice (Oryza Sativa L.). (10), 123–130.
Asfaliza, R., Rafii, M. Y., Saleh, G., Omar, O., & Puteh, A. (2012). Combining Ability and Heritability of Selected Rice Varieties for Grain Quality Traits. 6(12), 1718–1723.
Babu, V. R., Shreya, K., Dangi, K. S., Usharani, G., & Nagesh, P. (2012). Genetic Variability Studies for Qualitative and Quantitative traits in Popular Rice (Oryza sativa L.) Hybrids of India. 2(6), 1–5.
Bakhtiar, Kesumawati, E., Hidayat, T., & Rahmawati, M. (2011). Characterization of Aceh Rice Germplasm for Developing Adapted Variety in Acid Soils. In Agrista, 15(3), 79–86.
Choudhary, G., Ranjitkumar, N., Surapaneni, M., Deborah, D. A., Vipparla, A., Anuradha, G., Siddiq, E. A., & Vemireddy, L. R. (2013). Molecular Genetic Diversity of Major Indian Rice Cultivars over Decadal Periods. PLoS ONE, 8(6). https://doi.org/10.1371/journal.pone.0066197.
Chouhan, S. K., Singh, A. K., Singh, A., Singh, N. K., Singh, Yadav, S. K., & P.K., S. (2014). No Title. Annals of Plant and Soil Research, 16(3), 219–223.
Chuchert, S., Nualsri, C., Junsawang, N., & Soonsuwon, W. (2018). Genetic Diversity, Genetic Variability, and Path Analysis for Yield and its Components in Indigenous Upland Rice (Oryza sativa L. var. glutinosa). Songklanakarin J. Sci. Technol., 40(3), 609–616.
Dewey, D.I. and Lu, K.H. (1959). A Correlation and Path-Coefficient Analysis of Components of Crested Wheatgrass Seed Production. Agronomy Journal, 51, 515-518. http://dx.doi.org/10.2134/agronj1959.00021962005100090002x.
Hossain, S., Haque, M., & Rahman, J. (2015). Rice Research : Open Access Genetic Variability, Correlation and Path Coefficient Analysis of Morphological Traits in Some Extinct Local Aman Rice (Oryza sativa L). J Rice Res, 4(1), 4–9. https://doi.org/10.4172/2375-4338.100015.
Htwe, N. M., Phyu, S. L., & Thu, C. N. (2019). Assessment of Genetic Variability and Character Association of Myanmar Local Rice (Oryza sativa L.) Germplasm. 40(3), 1–10. https://doi.org/10.9734/JEAI/2019/v40i330369.
Idris, A. E., Justin, F. J., Dagash, Y. M. I., & Abuali, A. I. (2012). Genetic Variability and Inter Relationship between Yield and Yield Components in Some Rice Genotypes. Journal of Experimental Agriculture International, 2(2), 233–239. https://doi.org/10.9734/AJEA/2012/961.
Johnson, H.W., Robinson, H.F. and Comstock, R.E. (1955). Estimates of Genetic and Environmental Variability in Soybeans. Agronomy Journal, 47, 314-318. http://dx.doi.org/10.2134/agronj1955.00021962004700070009x.
Kampe, A. K. (2018). Phenotypic and Genotypic Correlation and Path Coefficients in Rainfed Upland Rice (Oryza sativa L.) Genotypes at Guraferda, Southwest Ethiopia. 76, 41–46.
Kartahadimaja, J., Utomo, S. D., Yuliadi, E., Salam, A. K., Warsono, & Wahyudi, A. (2021). Agronomic Characters, Genetic and Phenotypic Diversity Coefficients, and Heritability of 12 Genotypes of Rice. Biodiversitas, 22(3), 1091–1097. https://doi.org/10.13057/biodiv/d220302.
Kiani, G., & Nematzadeh, G. (2012). Correlation and Path Coefficient Studies in F2 Populations of Rice. Notulae Scientia Biologicae, 4(2), 124–127. https://doi.org/10.15835/nsb427366.
Kozak (2008). Selection of Promising Genotypes Based on Path and Cluster Analyses. Journal of Agricultural Science, 146, 85–92. https://doi.org/10.1017/S002185960700754X.
Maftuchah, Febriana, L., Sulistyawati, Reswari, H. A., & Septia, E. D. (2021). Morphological Diversity and Heritability of Nine Local Sorghum (Sorghum bicolor) Genotypes in East Java, Indonesia. Biodiversitas, 22(3), 1310–1316. https://doi.org/10.13057/biodiv/d220330.
Nandeshwar, B. C., S. Pal, Senapati, B. K., & De, D. K. (2010). Genetic Variability and Character Association Among Biometrical Traits in F2 Generation of Some Rice Crosses. Electronic Journal of Plant Breeding, 1(4), 758 – 763.
Paikhomba, N., Kumar, A., Ak, C., & Rai, P. K. (2014). Rice Research : Open Access Assessment of Genetic Parameters for Yield and Yield Components in Hybrid Rice and Parents, 2(1), 2012–2014. https://doi.org/10.4172/jrr.1000117.
Rabbani, M. A., Pervaiz, Z. H., & Masood, M. S. (2008). Genetic Diversity Analysis of Traditional and Improved Cultivars of Pakistani Rice (Oryza sativa L.) using RAPD markers. Electronic Journal of Biotechnology, 11(3). https://doi.org/10.2225/vol11-issue3-fulltext-3.
Rahman, M. M., Akter, A., Alam, M. M., Syed, M. A., Akter, A., & Ahsan, M. M. (2014). Genetic Variability, Correlation and Path Coefficient Analysis of Morphological Traits in Transplanted Aman Rice (Oryza sativa L.). Weed Control View Project Establishment of Breeding Zone Trial in Bangladesh, Irrigated breeding program, IRRI View project. J. Agric. & Environ. Sci, 14(5), 387–391. https://doi.org/10.5829/idosi.aejaes.2014.14.05.12336.
Sadeghi, S. M. (2011). Heritability, Phenotypic Correlation and Path Coefficient Studies for Some Agronomic Characters in Landrace Rice Varieties.
Sadimantara, G. R., Nuraida, W., Suliartini, N. W. S., & Muhidin. (2018). Evaluation of Some New Plant Type of Upland Rice (Oryza Sativa L.) Lines Derived from Cross Breeding for the Growth and Yield Characteristics. IOP Conference Series: Earth and Environmental Science, 157(1). https://doi.org/10.1088/1755-1315/157/1/012048.
Sanghera, G. S., & Kashyap, S. C. (2012). Genetic Parameters and Selection Indices in F3 Progenies of Hill Rice Genotypes. Notulae Scientia Biologicae, 4(4), 110–114. https://doi.org/10.15835/nsb448275.
Selvaraj, I. C., & Nagarajan, P. (2011). Genetic Parameters of Variability, Correlation and Path- Coefficient Studies for Grain Yield and Other Yield Attributes Among Rice Blast Disease Resistant Genotypes of Rice (Oryza sativa L.). African Journal of Biotechnology, 10(17), 3322–3334. https://doi.org/10.5897/AJB10.2575.
Shahbaz, M., & Ashraf, M. (2013). Improving Salinity Tolerance in Cereals. Critical Reviews in Plant Sciences, 32(4), 237–249. https://doi.org/10.1080/07352689.2013.758544.
Singh, P. (2011). Genetic Variability Study of Different Morpho-Physiological and Quality Traits in Aromatic Rice (Oryza sativa L.).
Sohrabi, M., Rafii, M. Y., Hanafi, M. M., Siti Nor Akmar, A., & Latif, M. A. (2012). Genetic Diversity of Upland Rice Germplasm in Malaysia Based on Quantitative Traits. The Scientific World Journal. https://doi.org/10.1100/2012/416291.
Sokal, R. R. (1963). The Principles and Practice of Numerical Taxonomy Author, 12(5), 190–199. https://doi.org/10.2307/1217562.
Tejaswini, K. L. Y., Srinivas, M., Kumar, B. N. V. S. R. R., M, L. A., Krishnam, S., & Rao, P. V. R. (2016). Correation and Path Analysis Studies of Yield and its Component Traits in F 5 Families of Rice (Oryza sativa L.). Journal of Agriculture and Veterinary Science, 9(11), 80–85. https://doi.org/10.9790/2380-0911018085.
Ullah, M. Z., Bashar, M. K., Bhuiyan, M. S. R., Khalequzza, M., & Hasan, M. J. (2011). Interrelationship and Cause-effect Analysis among Morpho-Physiological Traits in Biroin Rice of Bangladesh. International Journal of Plant Breeding and Genetics, 5(3), 246–254. https://doi.org/10.3923/ijpbg.2011.246.254.
Wolie, A., Dessalegn, T., & Belete, K. (2013). Heritability, Variance Components and Genetic Advance of Some Yield and Yield Related Traits in Ethiopian Collections of Finger Millet (Eleusine coracana (L.) Gaertn.) genotypes, 12(36), 5529–5534. https://doi.org/10.5897/AJB11.3409.
 This work is licensed under a: Creative Commons Attribution 4.0 International License
© Granthaalayah 2014-2023. All Rights Reserved.