Effect of temperature, preservative and time on the afermentation of urine and blood
Ali A. Eltayeib
1![]() , Siddige A. N. T. Matter 2, Ahmed Awad El
Gamal 2
, Siddige A. N. T. Matter 2, Ahmed Awad El
Gamal 2
1 Department
of Chemistry, Faculty of Science, Kordofan University, Sudan
2 Forensic
Science Institute, Sudan
|
|
|
ABSTRACT |
|
|
This study was
designed to detect and determine the concentration of ethanol in biological
samples (blood and urine). samples were collected from anon drunken, diabetic
persons some of them used drugs and other not used and drunken person and
divided to four plain containers. Two of them with preservative (Sodium
fluoride) and others without preservative and kept at 4°C and at 40 °C for 10
days. Potassium dichromate test (Alco test) was used to detect the presence
of ethanol every 24 hours for 10 days. All samples from drunken and diabetic
people were negative for ethanol presence. Meanwhile, all samples from
drunken persons were positive result and the colour of potassium dichromate
changed to green colour indicated the presence of ethanol. In the other hand
all samples were positive of ethanol with GC (FID), but they were different
in their concentrations. Samples at 40 °C were showed higher concentration
than other samples with preservative or at 4°C; therefore, the GC method for
analysis ethanol is very important as confirmatory test and to identify the
type of alcohol. |
|||
|
Received 16 February 2023 Accepted 17 March 2023 Published 30 April 2023 Corresponding Author Ali. A. Eltayeib, alieltayeib@yahoo.com DOI 10.29121/granthaalayah.v11.i4.2023.5100 Funding: This research
received no specific grant from any funding agency in the public, commercial,
or not-for-profit sectors. Copyright: © 2023 The
Author(s). This work is licensed under a Creative Commons
Attribution 4.0 International License. With the
license CC-BY, authors retain the copyright, allowing anyone to download,
reuse, re-print, modify, distribute, and/or copy their contribution. The work
must be properly attributed to its author.
|
|||
|
Keywords: Urine, Blood, Ethanol, Alco Test |
|||
1. INTRODUCTION
Ethanol is one of the oldest intoxicants known to man, its use or misuse was known in India long before it was known in other countries and described in Indian literature at least two thousand years before the birth of Christ (BC) Sharma (2003). It was known or used in Jezera arb before the Islamic religion (Al Quran Bee verus, 67), and its presence in intoxicating beverages e.g., Brandy, Whisky, Gin, Rum, Beers, Wines, Band and Hanson (1990) and the Country liquors, Modd (1990), Parikh (2005). In U.S.A., roughly 50% of all the persons involved in case of assault are under the influence of alcohol, and every year 20,000 persons die, and another one million persons are injured in road accidents, Sharma (2003). Due to alcohol intoxication, various crimes are committed, criminal assaults and sexual offences are commonly committed, Modd (1990), Jahala and Raju (1997). In Sudan alcohol is associated with various crimes such as: murder, rape, burning, death, homeless, robbery, assaults, traffic accidents, insurance of companies and kidnap. Thus, in year 2004, the total number of alcohol cases were 136 (Forensic Lab, 2004). In the year 2005, the total number of alcohol crimes or cases approached 145 cases (Forensic Lab, 2005). And 2006, the total number of alcohol cases which registered in forensic laboratory were about 170, they were blood, urine, breath, stomach contents and beverages or liquors (Forensic Lab, 2006). Medically, ethanol is classified as hypnotic, Sharma (2003) and Moffat and Jaskson (1986), it is less toxic than other alcohols. Methanol, for example, it is quite poisonous drink, inhaling it for prolonged periods or allowing it to remain long on the skin can lead to blindness or death Morri and Boyd (2000).
2. Materials and Methods
All chemicals were obtained from Riedel –De Haem AG Germany
1) Instrument
Gas Chromatograph (GC) Flame Ionization Detector (FID).
Serial No. C 1132403700SA.P/N 2217702-34.
GC-2010 ATF.230 VLV.GC-2010.
Gas Chromatograph Shimadzu.
Water bath (Kotter man-Germany).
2) Samples
collection
Urine and blood samples were collected from a non-drunken, diabetic and a drunken person.
3) Blood
samples
The blood samples were collected from different parts of a human body (blood from ante-cubital vein is collected with citrate as anticoagulant). Sharma (2003), Moffat et al. (2004), Dogra and Abtijitrudra (2005).
4) Urine
samples
The urine samples may not give true indicators of blood alcohol at the time of arrest as the urine may be accumulating for a long time in the bladder. Therefore, a second sample was taken after half an hour. The urine was collected in disposable beakers. 0.2 percent Sodium fluoride was used as preservative Sharma (2003).
3. Preparation of samples
3.1. Urine Sample from Drunken Person
20 ml of urine was taken from drunken person and divided into four containers (5ml each). 0.5 ml of sodium fluoride was added to two of the containers while the other two containers are left without any addition of preservative. One sample with preservative (Sodium Fluoride) and other without preservative were kept in a refrigerator at 4°C for 10 days. The other two samples were kept at 40°C for 10 days. The presence of ethanol in the samples was examined by using dichromate test and gas chromatography every 24 and 48 hours for 10 days respectively Cox (2002), Moffat et al. (2004) and Sharma (2003).
3.2. Blood Sample from A Non-Drunken Person
10ml of blood was taken from a non-drunken person and divided into four containers (2.5ml each). 0.5ml of sodium fluoride was added to two of the above containers while the other two containers were left without any addition of preservative. One sample with sodium fluoride and another sample without sodium fluoride were kept in a refrigerator at 4°C for 10 days. The remaining two samples were kept at 40°C for 10 days. The presence of ethanol in the samples was examined by using dichromate test and gas chromatography every 24 and 48 hours for 10 days respectively Moffat et al. (2004).
3.3. Urine Samples from Anon Drunken Person
20ml of urine was taken from a non-drunken person and divided into four containers (5ml each). 0.5ml of sodium fluoride was added to two of the above samples, while the other two samples were left without any addition of preservative. One sample with preservative and another without any preservative were kept in a refrigerator at 4°C for 10 days. The remaining two samples were kept at40°C for 10 days. The presence of ethanol in the samples was examined by using dichromate test and GC every 24 and 48 hours for 10 days respectively.
3.4. Blood Sample from Drunken Person
10ml of blood was taken from drunken person and divided into four containers (2.5ml each). 0.5ml of sodium fluoride was added to two of the above samples, while the other two samples were left without any addition of preservative. One sample with preservative and the other without preservative were kept in a refrigerator at 4°C for 10 days. The remaining two samples were kept at 40°C for 10 days. The presence of ethanol in the samples was examined by using dichromate test and GC every 24 and 48 hours for 10 days respectively Moffat et al. (2004).
4. Methods
4.1. Identification of ethanol in human fluids (blood, urine)
1) Dichromate
Test
1ml of urine and serum were placed separately in a test tube. One drop of potassium dichromate (2.5% w/v in 50% V/V Sulfuric acid) was added to a strip of glass-fibber filter paper. The paper was inserted in the neck of the test tube. Then the test tube was placed in a boiling water bath for 20 min.
A colour change to green indicates positive result. Ethanol gives a positive reaction if present above 400 mg/L, Moffat et al. (2004).
2) Gas
chromatography (G C) method
A measured sample or reference sample containing alcohol was placed into the head of the column kept in a heated chamber where it is changed into vapours and carried by carrier gas through a column packed with a suitable material. Blood, urine, or other body fluids are diluted with isopropyl alcohol for example before analysis, Sharma (2003) and Moffat et al. (2004). Instrumental setup was:
Column: stain less steel, 2mm*3m. Coated with Carb Wax.
1) Temperature.
Injection Port 175°C
Oven 80 °C
Dilutor 225°C
2) Carrier gas Helium.
3) Detector FID/ TCD Sharma (2003) and (Adamovics, 1995).
5. Results
The results of detection of ethanol by potassium dichromate in urine and blood were shown in Table 1, Table 2, Table 5, Table 6 (with 1% NaF) and Table 3, Table 4, Table 7, Table 8 (without 1% NaF).
Table 1
|
Table 1 Urine of Anon Drunken Person (40°C) |
||
|
After every 24 hours |
Colour changes |
Result |
|
For Ten
Days |
None |
-Ve |
Table 2
|
Table 2 Urine of Anon Drunken Person (4°C) |
||
|
After Every 24 Hours |
Colour Changes |
Result |
|
For Ten Days |
None |
-Ve |
Table 3
|
Table 3 Urine of Anon Drunken Person (40°C) |
||
|
After Every 24 Hours |
Colour Changes |
Result |
|
For
Ten Days |
None |
-Ve |
Table 4
|
Table 4 Urine of Anon Drunken Person (4 °C) |
||
|
After Every 24 Hours |
Colour Changes |
Result |
|
For
Ten Days |
None |
-Ve |
Table 5
|
Table 5 Blood of Anon Drunken Person (40°C) |
||
|
After Every 24 Hours |
Colour Changes |
Result |
|
For
Ten Days |
None |
-Ve |
Table 6
|
Table 6 Blood of Anon Drunken Person (4°C) |
||
|
After Every 24 Hours |
Colour Changes |
Result |
|
For
Ten Days |
None |
-Ve |
Table 7
|
Table 7 Blood of Anon Drunken Person (40°C) |
||
|
After Every 24 Hours |
Colour Changes |
Result |
|
For Ten Days |
None |
-Ve |
Table 8
|
Table 8 Blood of Anon Drunken Person (4 °C) |
||
|
Result |
||
|
For Ten Days |
None |
-Ve |
The results of detection of ethanol by potassium dichromate in urine and blood from diabetic persons were shown in tables Table 9, Table 10, Table 13, Table 14 (with 1% NaF) and Table 11, Table 12, Table 15, Table 16 (without 1%NaF)
Table 9
|
Table 9 Urine of Diabetic Person (40°C) |
||
|
After Every 24 Hours |
Colour Changes |
Result |
|
For Ten Days |
None |
-Ve |
Table 10
|
Table 10 Urine of Diabetic Person (4 °C) |
||
|
After Every 24 Hours |
Colour Changes |
Result |
|
For Ten Days |
None |
-Ve |
Table 11
|
Table 11 Urine of Diabetic Person (40°C) |
||
|
After Every 24 Hours |
Colour Changes |
Result |
|
For Ten Days |
None |
-Ve |
Table 12
|
Table 12 Urine of Diabetic Person (4 °C) |
||
|
After Every 24 Hours |
Colour Changes |
Result |
|
For Ten Days |
None |
-Ve |
Table 13
|
Table 13 Blood of Diabetic Person (40 °C) |
||
|
After Every 24 Hours |
Colour Changes |
Result |
|
For Ten Days |
None |
-Ve |
Table 14
|
Table 14 Blood of Diabetic Person (4°C) |
||
|
After Every 24 Hours |
Colour Changes |
Result |
|
For Ten Days |
None |
-Ve |
Table 15
|
Table 15 Blood of Diabetic Person (40°C) |
||
|
After Every 24 Hours |
Colour Changes |
Result |
|
For Ten Days |
None |
-Ve |
Table 16
|
Table 16 Blood of Diabetic Person (4°C) |
||
|
After Every 24 Hours |
Colour Changes |
Result |
|
For Ten Days |
None |
-Ve |
Table 17
|
Table 17 Detection of Ethanol from Biological Fluids (Blood and Urine) Samples by Potassium Dichromate Test. Cases Admitted to Forensic Laboratory |
|||
|
No. |
Sample |
Colour |
Result |
|
1 |
Urine |
Green |
+Ve |
|
2 |
Blood |
Green |
+Ve |
|
3 |
Blood |
Green |
+Ve |
|
4 |
Urine |
Green |
+Ve |
All samples (urine and blood) showed positive test for alcohol by Potassium dichromate test.
Table 18
|
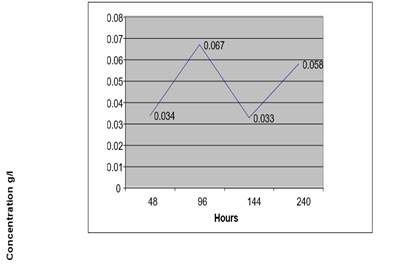
Table 18 Determination of Ethanol Concentration by GC in Urine Sample from Anon Drunken Person Treated with 1% Sodium Fluoride (40°C) |
|||
|
Standard Solutions of Ethanol |
Retention Time (Rt) |
Peak Area |
Concentration |
|
100µl |
1.775 |
123457 |
0.4 G/L |
|
250µl |
1.775 |
86737 |
1 G/L |
|
500µl |
1.722 |
334786 |
2 G/L |
|
750µl |
1.784 |
479666 |
3 G/L |
|
1000µl |
1.792 |
684906 |
4 G/L |
|
Urine Sample (1) |
Retention Time (Rt) |
Peak Area |
Concentration |
|
After 48 Hours |
1.806 |
5717 |
0.034 G/L |
|
After 96 Hours |
1.88 |
9453 |
0.067 G/L |
|
After 144 Hours |
1.798 |
5507 |
0.033 G/L |
|
After 240 Hours |
1.802 |
9727 |
0.058 g/L |
From this table we deduced that at high temperature the concentration of ethanol by auto fermentation of urine sample with a preservative is low even after 10 days.
Table 19
|
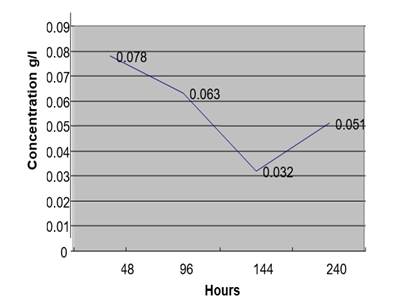
Table 19 Determination of Ethanol Concentration by GC in Urine Sample from Anon Drunken Person Treated with 1%Sodium Fluoride (4°C) |
|||
|
Standard Solutions of Ethanol |
Retention Time (RT) |
Peak Area |
Concentration |
|
100µl |
1.775 |
123457 |
0.4 G/L |
|
250µl |
1.775 |
86737 |
1 G/L |
|
500µl |
1.722 |
337786 |
2 G/L |
|
750µl |
1.784 |
479666 |
3 G/L |
|
1000µl |
1.792 |
684906 |
4 G/L |
|
Urine Sample (2) |
Retention Time (RT) |
Peak Area |
Concentration |
|
After 48 Hours |
1.8 |
13041 |
0.078 G/L |
|
After 96hours |
1.794 |
10615 |
0.063 G/L |
|
After 144 Hours |
1.803 |
5380 |
0.032 G/L |
|
After 240hours |
1.829 |
8463 |
0.051 G/L |
From this table we deduced that at low temperature the concentration of ethanol by auto fermentation of urine sample with a preservative is low even after 10 days.
Table 20
|
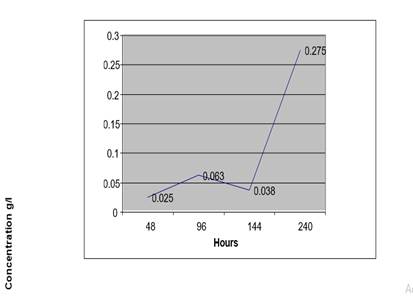
Table 20 Determination of Ethanol Concentration by GC in Urine Sample from a non-Drunken Person (40°C) |
|||
|
Standard Solutions of Ethanol |
Retention Time (RT) |
Peak Area |
Concentration |
|
100µl |
1.775 |
123457 |
0.4 G/L |
|
250µl |
1.775 |
86737 |
1 G/L |
|
500µl |
1.722 |
334786 |
2 G/L |
|
750µl |
1.784 |
479666 |
3 G/L |
|
1000µl |
1.792 |
684906 |
4 G/L |
|
Urine Sample (3) |
Retention Time (RT) |
Peak Area |
Concentration |
|
After 48 Hours |
1.798 |
4136 |
0.025 G/L |
|
After 96hours |
1.799 |
10559 |
0.063 G/L |
|
After 144 Hours |
1.812 |
6333 |
0.038 G/L |
|
After 240hours |
1.822 |
46063 |
0.275 G/L |
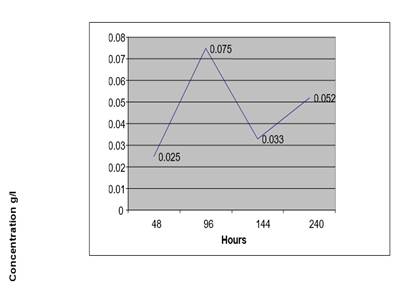
From this table we deduced that at high temperature, the concentration of ethanol by auto fermentation of urine sample without a preservative became very high after 10 days.
Table 21
|
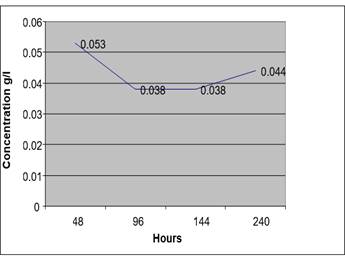
Table 21 Determination of Ethanol Concentration by GC in Urine Sample from a Non-Drunken Person (4°C) |
|||
|
Standard Solutions of Ethanol |
Retention Time (RT) |
Peak Area |
Concentration |
|
100µl |
1.775 |
123457 |
0.4 G/L |
|
250µl |
1.775 |
86737 |
1 G/L |
|
500µl |
1.722 |
334786 |
2 G/L |
|
750µl |
1.784 |
479666 |
3 G/L |
|
1000µl |
1.792 |
684906 |
4 G/L |
|
Urine Sample (4) |
Retention Time (RT) |
Peak Area |
Concentration |
|
After 48 Hours |
1.801 |
6011 |
0.034 G/L |
|
After 96hours |
1.794 |
6383 |
0.038g/L |
|
After 144 Hours |
1.789 |
6438 |
0.038 G/L |
|
After 240hours |
1.805 |
7372 |
0.044 G/L |
From this table we deduced that at low temperature the concentration of ethanol by auto fermentation of urine sample without a preservative is low even after 10 days.
Table 22
|
Table 22 Determination of Ethanol Concentration
by GC in Blood Sample from a Non-Drunken Person Treated with 1% Sodium
Fluoride (40 °C) |
|||
|
Standard Solutions of Ethanol |
Retention Time (RT) |
Peak Area |
Concentration |
|
100µl |
1.775 |
123457 |
0.4 G/L |
|
250µl |
1.775 |
86737 |
1 G/L |
|
500µl |
1.722 |
334786 |
2 G/L |
|
750µl |
1.784 |
479666 |
3 G/L |
|
1000µl |
1.792 |
684906 |
4 G/L |
|
Blood Sample (1) |
Retention Time (RT) |
Peak Area |
Concentration |
|
After 48 Hours |
1.794 |
3485 |
0.021 G/L |
|
After 96 Hours |
1.793 |
11394 |
0.068 G/L |
|
After 144 Hours |
1.801 |
6420 |
0.038 G/L |
|
After 240 Hours |
1.816 |
7420 |
0.045 G/L |
At high temperature the auto fermentation of blood sample from anon drunken person with a preservative gave low concentration of ethanol even after 10 days.
Table 23
|
Table 23 Determination of Ethanol Concentration by GC in Blood Sample from a Non-Drunken Person Treated with 1% Sodium Fluoride (4°C) |
|||
|
Standard Solutions of Ethanol |
Retention Time (RT) |
Pea K Area |
Concentration |
|
100µl |
1.775 |
123457 |
0.4 G/L |
|
250µl |
1.775 |
86737 |
1 G/L |
|
500µl |
1.722 |
334786 |
2 G/L |
|
750µl |
1.784 |
479666 |
3 G/L |
|
1000µl |
1.792 |
684906 |
4 G/L |
|
Blood Sample (2) |
Retention Time (RT) |
Peak Area |
Concentration |
|
After 48 Hours |
1.804 |
4161 |
0.025 G/L |
|
After 96 Hours |
1.787 |
6047 |
0.075g/L |
|
After 144 Hours |
1.806 |
1769 |
0.033 G/L |
|
After 240 Hours |
1.805 |
8695 |
0.05 G/L 2 |
At low temperature the concentration of ethanol by auto fermentation of blood sample from anon drunken person with a preservative is low even after 10 days.
Table 24
|
Table 24 Determination of Ethanol Concentration by GC in Blood Sample from Anon Drunken Person (40°C) |
|||
|
Standard Solutions of Ethanol |
Retention Time (RT) |
Peak Area |
Concentration |
|
100µl |
1.775 |
123457 |
0.4 G/L |
|
250µl |
1.775 |
86737 |
1 G/L |
|
500µl |
1.722 |
334786 |
2 G/L |
|
750µl |
1.784 |
479666 |
3 G/L |
|
1000µl |
1.792 |
684906 |
4 G/L |
|
Blood Sample (3) |
Retention Time (RT) |
Peak Area |
Concentration |
|
After 48 Hours |
1.791 |
2281 |
0.014 G/L |
|
After 96 Hours |
1.795 |
10573 |
0.063 G/L |
|
After 144 Hours |
1.812 |
19768 |
0.118 G/L |
|
After 240 Hours |
1.884 |
19388 |
0.116 G/L |
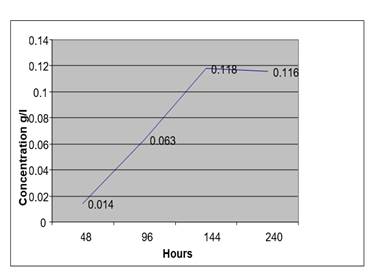
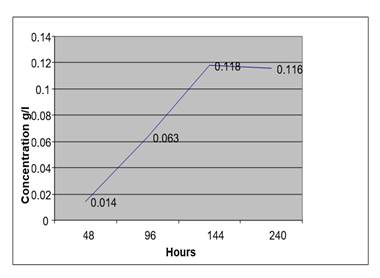
At high temperature the auto fermentation of blood sample from anon drunken person without a preservative gave high concentration of ethanol after 10 days.
Table 25
|
Table 25 Determination of Ethanol Concentration by GC in Blood Sample from Anon Drunken Person (4°C) |
|||
|
Standard Solutions
of Ethanol |
Retention Time
(RT) |
Peak Area |
Concentration |
|
100µl |
1.775 |
123457 |
0.4 G/L |
|
250µl |
1.775 |
86737 |
1 G/L |
|
500µl |
1.722 |
334786 |
2 G/L |
|
750µl |
1.784 |
479666 |
3 G/L |
|
1000µl |
1.792 |
684906 |
4 G/L |
|
Blood Sample (4) |
Retention Time
(RT) |
Peak Area |
Concentration |
|
After 48 Hours |
1.798 |
2925 |
0.017 G/L |
|
After 96 Hours |
1.795 |
5118 |
0.024 G/L |
|
After 144 Hours |
1.802 |
5262 |
0.016 G/L |
|
After 240 Hours |
1.834 |
6570 |
0.039 |
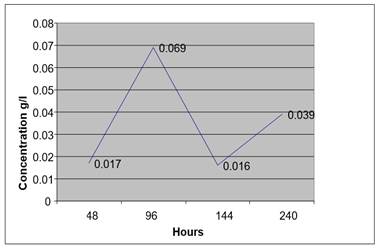
At low temperature the auto fermentation of blood sample from anon drunken person without a preservative lead to low concentration of ethanol even after 10 days.
Table 26
|
Table 26 Determination of Ethanol Concentration in Biological Fluids (Blood and Urine) Samples by Using GC FID. Cases Admitted to Forensic Laboratory |
|||||
|
No. |
Sample |
Retention Time |
Peak Height |
Peak Area |
Ethanol Concentration |
|
1 |
Urine |
1.783 |
3501 |
43926 |
0.263 G/L |
|
2 |
Blood |
1.769 |
32589 |
4902 |
0.195g/L |
|
3 |
Blood |
1.813 |
9619 |
44641 |
0.267 G/L |
|
4 |
Urine |
1.781 |
6770 |
66827 |
0.399 G/L |
Figure 1
|
Figure 1 Concentration of Ethanol in Urine Sample (At 4 °C +1% Na F) from a Non-Drunken Person for 10 Days |
Figure 2
|
Figure 2 Concentration of Ethanol in Urine Sample (At 4 °C) from a Non-Drunken Person for 10 Days |
Figure 3
|
Figure 3 Concentration of Ethanol in Urine Sample (At 40 °C +1% Na F) from a Non-Drunken Person for 10 Days |
Figure 4
|
Figure 4 Concentration of Ethanol in Urine Sample (At 40°C) from a Non-Drunken Person for 10 Days |
Figure 5
|
Figure 5 Concentration of Ethanol in Blood Sample (At 4 °C+ 1%Na F) from a Non-Drunken Person for 10 Days |
Figure 6
|
Figure 6 Concentration of Ethanol in Blood Sample (At 4 °C) from a Non-Drunken Person for 10 Days |
Figure 7
|
Figure 7 Concentration of Ethanol in Blood Sample (At 4°C + 1%Naf) from a Non-Drunken Person for 10 Days |
Figure 8
|
Figure 8 Concentration of Ethanol in Blood Sample (At 40°C) from a Non-Drunken Person for 10 Days |
6. Discussion
Potassium dichromate test (Alco test) for blood and urine samples from anon drunken and diabetic persons gave a negative result, so there was no color change. But at the same time the gas chromatography (GC) flame ionization detector (FID) test for these samples was positive result for ethanol that means GC is more sensitive than Alco test.
While blood and urine samples from a drunken person showed positive result for ethanol presence (the colour changed from yellow to green indicated the presence of ethanol). The GC FID showed high concentrations of ethanol in the samples (blood and urine), these results were similar to Moffat et al. (2004) and Sharma (2003). Urine samples at 40°C without preservative gave high concentration of ethanol because at this temperature microorganisms can act more; therefore, the auto fermentation occur in the samples. All samples from anon drunken or diabetics persons at 4°C with preservative (Na F) have shown low concentration of ethanol this reflex the important of preservative, time, and the temperature conditions. Samples are capable to remain for long period without impair or auto ferment due to their conditions (temperature, preservative, and the period). The blood samples at 4 °C with preservative showed low concentration than the urine samples at the same conditions, this because the preservative is most suitable for blood samples. This was similar to Vij (2005) results. Traces of ethanol are found in all persons (even a non-drunken person), this is corresponding to Readdy (2004) result.
7. Conclusion
All biological fluids (blood and urine) that need examination for ethanol must keep under good conditions such as preservative (NaF), temperature and limit of period. The temperature below 4°C is the most suitable to keep biological samples (blood and urine). The low concentration of ethanol which cannot appear or detect under the potassium dichromate test, can be detected by using the GC FID instrument.
CONFLICT OF INTERESTS
None.
ACKNOWLEDGMENTS
None.
REFERENCES
Band, J. T. and Hanson, P. (1990). Success in Chemistry (2nd Ed). Great Britain Richard Clay Ltd, 126, 274-276.
Cox, H. (2002). Medical Jurisprudence and Toxicology. Maulana Azad Medical College, lexis Nexis Butter Worths, 936 – 946.
Dogra, T., and Abtijitrudra, C. (2005). Lyon, Medical Jurisprudence and Toxicology. The First Indian Book of Forensic Medicine and Toxicology (11th Ed). Delhi Law House 77, OPPTIS Hazari Court, 615 – 633.
Jahala, and Raju, V. (1997). Medical Jurisprudence Illustrated (6th Ed). Eastern book Company Luck Now, 556-566.
Modd, D. G. (1990). Colours Atlas of Forensic Medicine (1st Ed). Medical Publisher (P) LTD New Delhi, 202-203.
Moffat, A. C. and Jaskson, J. V. (1986). Clarke 's Isolation and Identification of Drugs (2nd Ed.). The Pharmaceutical Society Great Britain, London, 34, 131-3, 213-217.
Moffat, A. C., Osselton, M. D., Widdop, B., and Galichet, L. (2004). Clarke's
Analysis of Drugs and
Poisons in Pharmaceuticals, Body Fluids and Postmortem Material (3rd Ed). K.
M. Varghese Compnay Pharmaceutical Press. I lambeth HighStreet, London SEI 7 JN, U.K, 4 ,7-9, 11, 13, 23, 53,
55-62, 65, 96, 102-3, 110-12, 174, 176, 178, 236, 315, 669, 991.
Morri, R. S., and Boyd, R. N. (2000). Hsoke K. Prentice, Hall of India
New Delhi 2000-110001, 36, 210, 219, 221-222, 247, 258, 298, 1101-1106.
Parikh, C. R. (2005). Parikh's Text Book
of Medical Jurisprudence, Forensic
Medicine and Toxicology for
Class Rooms and Court Rooms
(6th Ed)., Dary Aganj, New
Delhi, 1014-1018, 1032, 1117, 1128.
Readdy, N. (2004). Forensic
Medicine and Toxicology
(23rd Ed). Published by K. Suguna
Devi. Printed by Omsai
Graphics Narayanguda, 476-489.
Sharma, B. R. (2003). Forensic Science in Criminal Investigation
(4th Ed). Universal law Publishing.
PVt, Ld, Delhi, 866- 874.
Vij, K. (2005). Text Book of Forensic Medicine and Toxicology Principles and Practice Elsevier (3rd Ed.) Division of Red Elsevier India Private limited Saurabh printers pvt. Ltd. New Delhi, 687-702.
 This work is licensed under a: Creative Commons Attribution 4.0 International License
© Granthaalayah 2014-2023. All Rights Reserved.