Characterization of aquifer structures in the Northeast basement rock of Burkina Faso
Samuel Nakolendousse
1![]() , Christian Bonogo 1
, Christian Bonogo 1![]() , Sayoba Kafando 1
, Sayoba Kafando 1![]() , Michel Bembamba 1
, Michel Bembamba 1![]()
1 Geosciences
and Environment Laboratory, Department of Earth Sciences, Life and Earth
Sciences Training and Research Unit/ Joseph KI-ZERBO University, Ouagadougou,
Burkina Faso
|
|
|
ABSTRACT |
|
|
This characterization study of the aquifer horizons is based on the geostatistical analysis of the drilling data in order to map the intrinsic parameters of the aquifers, namely the size of the alterations and the size of the fissured fringe. The STRM data were also used to map the topographic levels. Cross-analysis of all these parameters with borehole flow rates allowed us to define a context pattern that is favorable to groundwater deposits, by identifying the influence of the size of these parameters on productivity. The application of the geophysical method (electric drag and geoelectric tomography) has made it possible to obtain a 2D vertical section of the subsoil structure based on the distribution of electrical resistivity. The alteration profile includes the alterite reservoir, the fissure reservoir located above the solid rock sometimes affected by fractures (fault). The size of these different horizons varies from one point to another, thus defining contexts that are more or less favorable for the existence of groundwater deposits. The alteration thickness (AT) mapping defined two map units: alteration thicknesses of 15m or less and those greater than 15m. Erosion would have played a large role in this distribution as there is a clear link between alteration thickness and topography. The alteration thickness (AT) unit of less than or equal to 15 m has great surface water potential. It is the area where the topography is fairly low, and the fractured edges are generally of considerable thickness. They frequently coincide with the large shallow areas drained by the major waterways. |
|||
|
Received 23 December 2022 Accepted 25 January 2023 Published 07 February 2023 Corresponding Author Nakolendousse Samuel, altesseroi1@yahoo.fr
DOI 10.29121/granthaalayah.v11.i1.2023.4995 Funding: This research
received no specific grant from any funding agency in the public, commercial,
or not-for-profit sectors. Copyright: © 2023 The
Author(s). This work is licensed under a Creative Commons
Attribution 4.0 International License. With the
license CC-BY, authors retain the copyright, allowing anyone to download,
reuse, re-print, modify, distribute, and/or copy their contribution. The work
must be properly attributed to its author.
|
|||
|
Keywords: Geostatistical Analysis, Drilling Data, Intrinsic
Parameters |
|||
1. INTRODUCTION
The need for water in arid areas
remains one of the major concerns of the populations. An inventory of the
various well sites in the study area revealed 351 wells, 127 of which are
declared negative. Negative wells are those that have not reached an optimum
flow rate of 0.7 m3/h at drilling (Source: DGRE). This finding raises many
questions in terms of hydrogeological research. In bedrock environments,
groundwater resources are conditioned by fracture networks Kafando (2020), Nakolendoussé (1991), Savadogo (1984), Sombo et al. (2019). These rocks are characterized by their compact nature and their low
capacity to retain water, and by the presence of permeable horizons that
sometimes develop through alteration processes and tectonic phenomena Boisvert et al. (2008), Savadogo (1984). The crystalline formations are sterile in a normal state, and the regions
they occupy have as aquifer reservoirs only the layers of alterites,
quartz veins and the fissured fringe of the substratum. The alteration profile
is summarized in three levels, which are the thickness of alteration, the
fissured edge, and the solid rock Savadogo (1984). However, the size of the alteration and the size of the fissured fringe
vary from one area to another and influences the productivity of hydraulic
structures Kafando (2020). This raises the problem of knowing which sections are favourable for
obtaining high flows. Therefore, Winrock
International in collaboration with the Office of Geosciences, Environment and
Applied Techniques for Development in West Africa and the Sahel (OGETAD-AOS)
has initiated a project on the evaluation of the groundwater potential in the north-eastern
part of Burkina Faso in which our study is embedded. The aim of this work is
therefore to characterize the aquifer horizons of the study area by determining
the distribution of flows according to the thickness of the alteration and the
fissured fringe. This will lead to the identification of the favourable
thicknesses for the productivity of the groundwater structures. It will be carried out through a statistical
analysis of the borehole data which will allow a mapping of the said
parameters. This mapping will be combined with geophysical work to confirm the
mapping results.
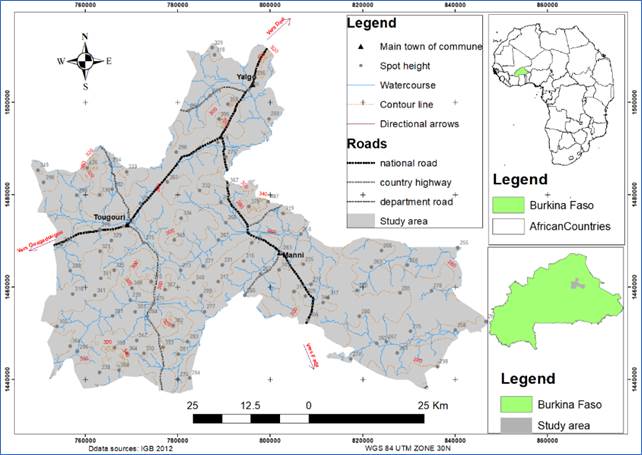
The study area is located in the north-eastern part of Burkina Faso, a country located at the heart of West Africa Figure 1. It has a total perimeter of 575,243 km and an actual surface area of 3,472,341 km2. It is occupied by three municipalities whose overall population was estimated at 295,948 inhabitants in 2019 (INSD, RGPH 2019). It is constituted of the rural municipalities of Tougouri, Yalgo and Manni. It is located between the meridians 00°42'29,153'' West longitude and 00°12'9,297'' East longitude and the parallels 13°40'15,286'' and 12°59'6,341'' North latitude. With a relatively flat relief, the average altitudes vary between 250 and 300 m. The climate is of the Sahelian type characterized by two alternating seasons: a rainy season of about four months (June to September) and a dry season of about eight months (October to May). It has an annual average rainfall of less than 600 mm (ANAM, 2010). From a hydrological point of view, the study area belongs entirely to the watershed of the Faga River, one of the main right banks affluents of the Niger River. Overall, the hydrographic network is dense with water courses that flow eastward to the Faga River. The vegetation is of the shrub savanna type and the soils are mostly underdeveloped. The lithologies of the study area are grouped into three formation groups. We first have the granitoid rocks composed mainly of granites, quartz diorites, tonalites and leucogranites. Then, the volcano-sedimentary belts composed of schists, volcanites, acid volcanites, basic volcanites, gabbro and diorite gabbro. Finally, the metamorphic rocks that are: gneiss, amphibolites and leptynites Castaing et al. (2003).
Moreover, we have vein formations consisting mainly of quartz veins, dyke veins and dolerites. The latter are oriented NW-SE and cross the Birimian basement over several dozen kilometers
From a structural point of view, the study area is characterized by the presence of two different ductile shear directions. On the one hand, we have the NNE-SSW and NW-SE directions, which are typical of the Y-structure of the area. On the other hand, we have the N-NE oriented shear that represents the intersection of the Tiébélé-Dori-Markoye shear zone Castaing et al. (2003). From a hydrogeological point of view and in the basement domain, two types of reservoirs can be distinguished. They are both differentiated by their physical and hydrodynamic characteristics. These are the upper reservoirs of alterites, and those of fissures and faults Ouedraogo (2016). The typology of these reservoirs is closely linked to the typical geomorphological profile, which is essentially marked by two compartments: the weathered fringe and the fissured or fractured part. Therefore, we have some upper reservoirs of alterites which consist of formations made up of alteration products of the crystalline basement and lower reservoirs of cracks and or fractures located under the alterites.
Figure 1
|
Figure 1 Location
Map of the Study Area |
3.1. METHODOLOGY
3.1.1. MAPPING OF ALTERATION THICKNESSES AND CROSS ANALYSIS WITH TOPOGRAPHY
The realization of the weathering model (alteration cover) for hydrogeological purposes requires an appropriate sequential methodological approach. Five steps are required to produce the alteration map Kafando et al. (2018): data collection, data processing, checking the influence of alterations on productivity, determining which alteration classes to represent, and finally, map design and validation. From the national database of the General Directorate of Water Resources of Burkina Faso (DGRE), the drilling logs were analyzed and then processed by geostatistical methods in order to map the alteration zone using GIS tools. Indeed, the purpose of hydrogeological drilling is to find groundwater, generally for drinking water supply. The drilling logs correspond to the geological section (nature and thickness of the intersected ground) recorded during the drilling. They provide valuable information on groundwater deposit conditions Bouchot et al. (2011). These data on alteration thicknesses were also cross analyzed with the topographic levels of the ground in order to identify possible relationships between these two parameters in the productivity of groundwater structures. The analyses were carried out taking into account not only the boundaries of the study area but also those of the entire square degree covering the said area which is the Pissila sheet.
3.1.2. SPATIAL ANALYSIS OF FISSURED THICKNESSES
The cracked fringe, depending on its size, influences the productivity of the boreholes Nakolendoussé (1991). This section constitutes the reservoir inside the formations Savadogo (1984). It is the storage place of the water collected by the alterites. The vector data of the cracked thicknesses were exploited with the GIS platform using the kriging tool for statistical and spatial analysis. All the cracked thickness values from the different drilling points were subjected to a spatial grading. The objective was to obtain a map of cracked thicknesses for the entire study area. The analyses take into account the limits of the study area and those of the Pissila sheet.
3.1.3. GROUND GEOPHYSICAL WORK
This phase of the work consists in verifying the characteristics of the aquifers. To this end, platforms were identified in the study area to assess and identify the characteristics of the aquifers through tomography. On each platform, the presence of fractures was checked by means of trails before the tomography was carried out.
·
Geoelectric drag (trail)
This operation involves moving a generally symmetrical quadripole of constant dimensions over the site to be studied according to a predefined measurement step. At each station, the reading of ∆𝑉 and I is used to calculate the value of the apparent resistivity at the center of the dipole MN=10m. The depth of investigation being a function of the spacing between electrodes A and B, with AB=200m. This method makes it possible to highlight anomalies that can be assimilated to fracture zones, geological contacts, vein formations... which are, among others, structures of hydrogeological interest.
·
Electrical tomography
Geoelectrical tomography is a very recent method that combines electrical trailing and electrical probing to characterize the soil and subsoil according to their apparent resistivity. The dipole-dipole device is the one which was used in the present study. To have a better connection, we dug a hole at each electrode node and watered the hole well. When the length of the profile to be measured is greater than the length of the cables, we performed the ROLL ALONG technique.
The methodology used to achieve the goals of this study included the use of multiple types of data. These are: the National Topographic Data Base (NTDB, 2012) from the Geographical Institute of Burkina (IGB, 2012); geological data from the National Bureau of Mines and Geology of Burkina (BUMIGEB, 2003); soil data from the National Soil Bureau (BUNASOL, 2012); climate data from the National Meteorological Agency (ANAM, 2019); demographic data from the National Institute of Statistics and Demography (INSD, 2006, 2019); satellite data "SRTM 30" (USGS, 2021); the database of boreholes of the General Directorate of Water Resources (DGRE, 2019) and electrical resistivity data of the trail and tomography obtained from the geophysical work of this study. The equipment consists of a computer, Arc Gis (version 10.3.1) and XLSTAT (version 2016) software for the production of maps and statistical analyses, and the "SYSCAL R1 Plus" and the Syscal Pro Switch 72 from IRIS Instruments and the software for the interpretation of its data. The "SYSCAL R1 Plus" is a compact and powerful instrument for electrical resistivity and chargeability (PP) measurements. It was used in this study to determine the lateral variation (electrical trail) of the terrain resistivity. The Syscal Pro Switch is an all-in-one multi-electrode system dedicated to the imaging of soil resistivity and electric polarization. The software used to process and interpret the data from this last device are: Electre Pro for creating measurement sequences, Prosys II for processing and exporting SYSCAL resistivity data to the computer and Res2dinv software for 2D interpretation.
Relationship of alteration thicknesses to topography and groundwater resources availability.
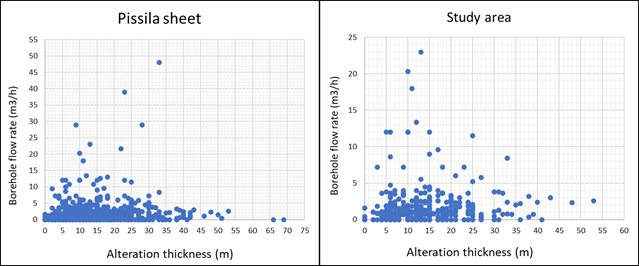
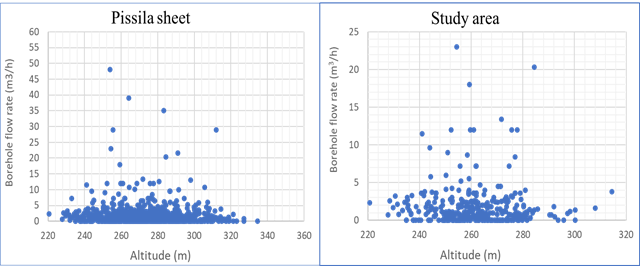
The alteration thicknesses (AT) within the Pissila sheet are usually less than 30m. However, they can reach or exceed 50m in some places. The same applies to the project area Figure 2. The average alteration thickness is 14.26 m in the study area.
Flow rates (Q) greater than 5m3/h are recorded in contexts with alteration thicknesses between 5m and 30m. For flows exceeding 10m3/h, the drillings are located in areas of alteration varying between 10m and 15m.
Based on the variations in alteration thicknesses at the Pissila sheet scale and more specifically in the study area, two alteration classes are considered eligible. These are alteration thicknesses that are less than or equal to 15m and those strictly greater than 15m.
Figure 2
|
Figure 2 Distribution
of Borehole Flow Rates Based on Alteration Thicknesses |
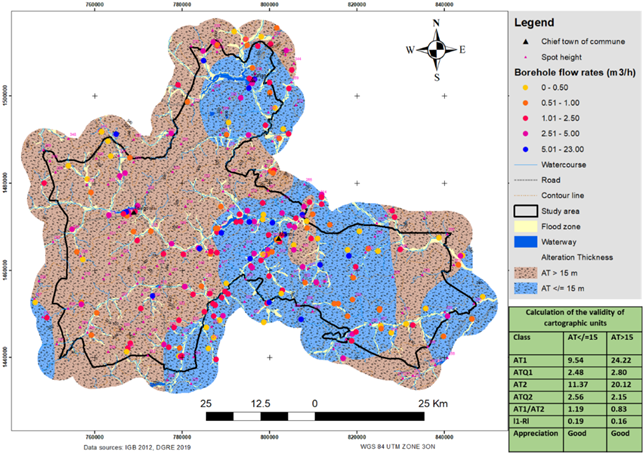
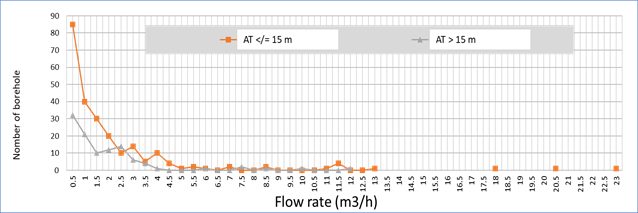
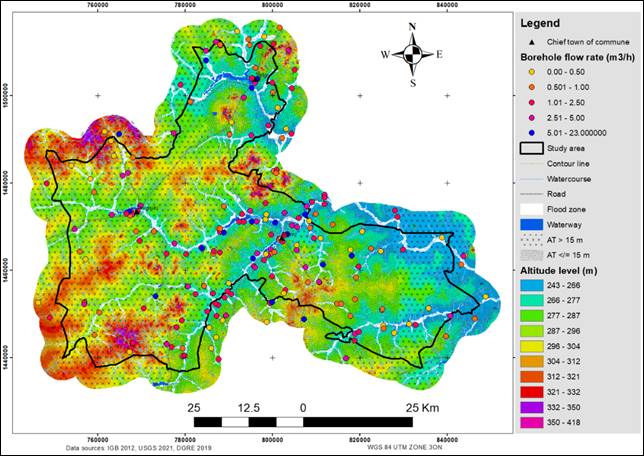
The mapping of alteration thicknesses yielded the resulting figure shown in Figure 3 below. The map units with alteration thicknesses less than or equal to 15m, with an average of 11.37m, are the ones that record the majority of large flow drillings Figure 4. It is also the unit with the highest rate of drillings with flow rates less than 0.5 m3/h. The average flow rates for the map units are 2.56 and 2.15 m3/h respectively for the unit with alteration thicknesses less than or equal to 15m and the unit with alteration thicknesses greater than 15m.
The validity coefficients are 1.19 and 1.16 for the unit of alterations less than or equal to 15m and the unit of alterations greater than 15m respectively. « AT1" represents the average of the alteration thicknesses determined through statistical analysis and "AT2" represents the result of the mapped units. "ATQ1" is the statistically obtained average alteration thickness flow and "ATQ2" is the one obtained after mapping. R is therefore the ratio AT1/AT2.
Figure 3
|
Figure 3 Alteration
Thicknesses Map |
Figure 4
|
Figure 4 Assessment
of Hydraulic Potential in the Two Mapped Units |
The study area is mostly characterized by alteration thicknesses greater than 15m in its western part and a small part in the east. The thicknesses of less than 15 m cover its eastern part and include the lowest elevations that correspond to the riverbeds Figure 6. The most productive boreholes are located in this context. In the study area, all boreholes with a capacity of more than 5m3/h are located below 290m. Zero flow boreholes are hardly ever recorded at elevations below 240m Figure 5.
Figure
5
|
Figure 5 Borehole Flow Rates According to Altitude |
Figure 6
|
Figure 6 Map of Alteration Thicknesses Superimposed on
Topography Analysis of Cracked Thicknesses |
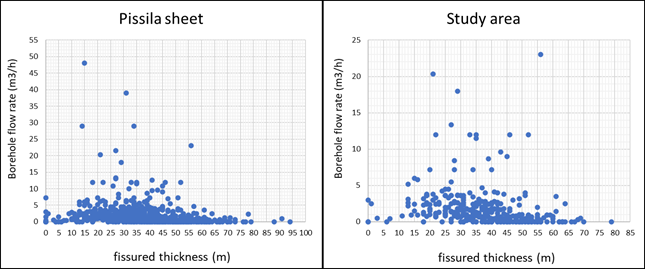
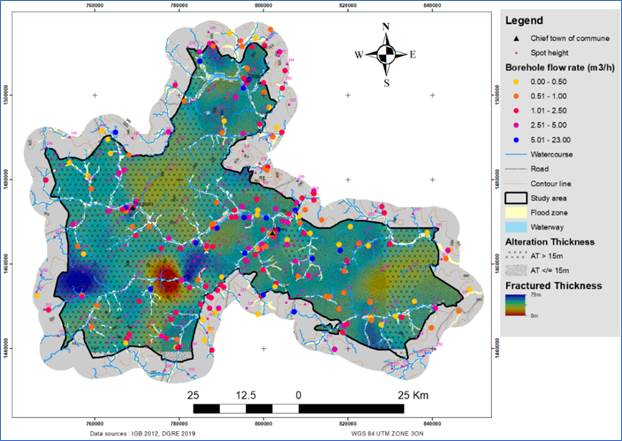
At the Pissila sheet, the fissured thicknesses (FT) are generally lower than 60m, but they reach 90 m in some places. In the study area, the fissured thicknesses vary from 0 to about 70 m. However, it should be noted that the best flow rates recorded come from boreholes where the thickness of the fissured fringe is less than 60m. Those reservoirs (fractured thicknesses) with groundwater productivity greater than 10m3/h are those with thicknesses between 20m and 56m, below and above this size, productivity generally decreases gradually Figure 7. Alteration thicknesses of less than or equal to 15m are those that seldom record very low cracked thicknesses. The category of alteration thicknesses that exceed 15 m is based on highly variable cracked thicknesses (low, medium, and high). The cracked thickness map Figure 8 illustrates this.
Figure 7
|
Figure 7 Distribution
of Drilling Rates as a Function of Fissured Thickness |
Figure 8
|
Figure 8 Map of Fractured Thicknesses
Coupled with Alteration Thicknesses |
5.1. GEOELECTRIC PROFILES OF AQUIFER HORIZONS
A platform was identified in each alteration thickness map unit in order to geophysically assess the results obtained by mapping. Thus, the Namassa site is located in the map unit of alteration thicknesses greater than 15m and the Malyoma site in the map unit of alteration thicknesses less than or equal to 15m. Therefore, in Malyoma, 03 drag profiles and 02 tomography profiles were realized and in Namassa, one drag profile and 02 tomography profiles.
5.1.1. ELECTRIC DRAG (TRAIL)
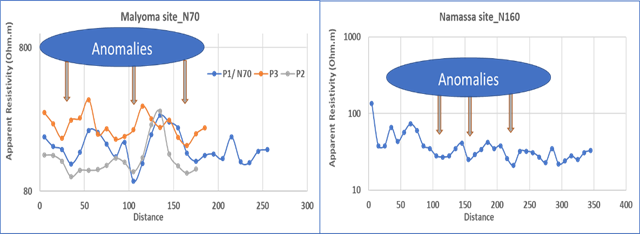
On the completed profiles Figure 9, the low resistivity (conductive) anomalies represent fractures. Thus, through the results obtained, several conductive anomalies are identified. The three Malyoma profiles are parallel with 100m spacing. Anomalies have been recorded in the vicinity of these structures which allow us to have their directions.
Figure 9
|
Figure 9 Electric Drag Profiles with the
Position of the Anomalies |
·
Namassa
profile
These surveys reach 74m depth with resistivity values ranging from 3.16 to 246 Ohm.m.
Globally, resistivities are not too high on this platform. The apparent resistivity values indicate the presence of several theoretical terrains Figure 10 and Figure 11.
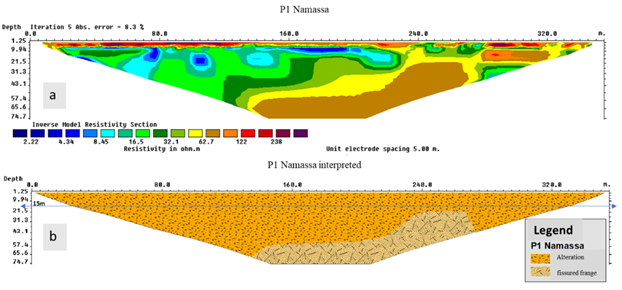
At the level of profile P1, the depth of the alteration is estimated to be more than 50m below ground level, this al teration fringe is covered by a thin layer of lateritic cuirass of about 5m Figure 10. The zones of apparent resistivities of intermediate values, could correspond to the cracked or crushed frank which comes after the alterites.
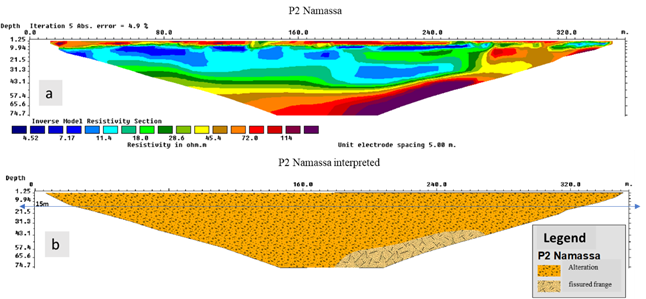
The results of profile P2, parallel to P1 at about 100m to the east, confirm the order of magnitude of the apparent resistivity values obtained at P1 Figure 11. The alteration thicknesses remain very high. It can be estimated up to 55m in places with the same lateritic cuirass cover. Like the first profile, this pseudo-section did not allow to see the surface of the rock because of the thickness of the alteration.
Figure 10
|
Figure 10 Cross-Section of Geoelectric
Imagery on the P1 Profile of the Namassa Site |
Figure 11
|
Figure 11 Cross-Section of Geoelectric Imagery on The P2 Profile of the Namassa Site |
·
Malyoma
profile
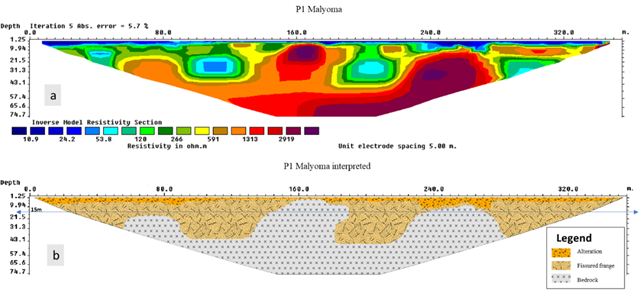
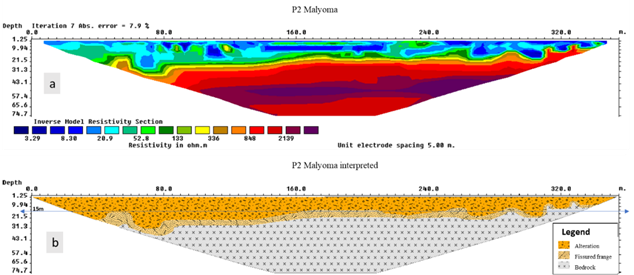
The pseudo-section of P1 at the Malyoma site Figure 12 shows a succession of resistivity values ranging from 10 to more than 2330Ohm.m and the estimated depth is about 74m.
The context is marked by low alteration thicknesses confirming the cartographic results. Indeed, these profiles are made in the map unit of alteration thicknesses less than or equal to 15m.
The alterations are less than 5m at the level of the P1 profile of Malyoma Figure 12. However, they can reach 10m at the level of profile P2 of the same site Figure 13. The two profiles highlight favourable zones for boreholes (station 100, 200 and 270) whose depths could be as much as 30m. The top of the basement could be estimated at 40m below the ground.
Figure 12
|
Figure 12 Cross-Section of Geoelectrical
Imagery on The P1 Profile of the Malyoma Site |
Figure 13
|
Figure 13 Cross-Section
of Geoelectrical Imagery on the P2 Profile of the Malyoma
Site |
The thickness of the alteration acts as a collector and/or reservoir. They often favor infiltration and thus the recharging of aquifers Nakolendoussé (1991). Two mapping units of alteration thicknesses can be distinguished: the AT greater than 15m and that less than or equal to 15m.
The AT unit less than or equal to 15m has great surface water potential. The majority of the most productive boreholes are located there Figure 3. In this context of low alteration thicknesses, the altitude levels are favourable to the retention of surface water and allow a good supply of the underlying reservoirs. This area would have been affected by erosion which stripped a good part of the alterites. The fissured fringe is generally important in this context. It receives the appropriate amount of collected water, hence its high hydrologic potential. These results are consistent with recent previous works Kafando (2020).
In the mapping unit of alteration thicknesses greater than 15m, the altitudes are relatively high, with generally low flow rates. As for the cracked thicknesses, they are quite variable in this context. Obtaining a better flow rate (higher than 5 m3/h) is generally conditioned by cracked thicknesses close to those of the alterations The results of the geophysical surveys are similar to those of the mapping. Indeed, there is a significant difference between the resistivities of solid eruptive rocks and those of clayey and porous materials Toé (2004). Tomography determines the levels of ground layers through their resistivities and consequently the aquifers present on the basis of the principle of distribution of resistivities according to the nature of the alterations. It is used to characterize the "basement - fissured fringe - superficial alterites".
The Namassa tomography profiles carried out in the unit of alteration thicknesses greater than 15m showed a thin, low-resistance layer of lateritic cuirass of about 5m.
The strength of the alterations in this unit, approximately several tens of meters Figure 10 and Figure 11, made it impossible to see the rockhead of the bedrock.
Regarding the tomographic profiles of Malyoma carried out at the level of the cartographic unit of alteration thicknesses lower than 15m, the " basement - fissured fringe - superficial alteration " complex is noticeable as a whole with alteration thicknesses of about 5m on profile P1 Figure 12 and about 10m on profile P2 Figure 13. The fissured fringe, the layer under the alterites, rich in fissures and which brings the best productivity is more developed at the level of profile P1 than at the level of P2. The superficial lateritic cuirass is not apparent on these profiles, and this confirms the strength of the erosion with regards to their proximity to the large watercourses drained by the runoff water.
This study, whose purpose is to characterize the aquifers, followed a methodology that could be divided into two steps. First, statistical analyses of the hydrogeological parameters of the boreholes in the study area. They have made it possible to map the different aquifer horizons and identify their influence on the productivity of hydraulic structures. Then geophysics was applied to monitor the aquifer system at the surface to support the mapping method. In the study area, the cracked thicknesses generally reach twice the thickness of the alterites ("alterations"). Alteration thicknesses of less than or equal to 15m imply relatively low elevations with medium to high cracked thicknesses. In this context, the hydraulic potential is important and hydraulic works have the best flows. For alteration thicknesses greater than 15m, the best flow rates are most often found where the fractured horizon appears to have the same strength as the alterations. In this environment, altitudes are relatively high. The thickness of the alteration and that of the fissured fringe are parameters that play an important role in the productivity of aquifers. The geophysical method is applied at this stage to assess and possibly guide hydraulic projects. During this study, imaging profiles were used to validate the mapping by determining information about the aquifer layers on the basis of the principle of resistivity distribution according to the geophysical nature of the horizons. All these methods lead to a relatively precise knowledge of the aquifer potential.
CONFLICT OF INTERESTS
None.
ACKNOWLEDGMENTS
None.
REFERENCES
Boisvert, É., Bourque, E., Cloutier, V., Kirkwood, D., Lauziere, K., Lefebvre, R., Martel, R., Michaud, Y., Nastev, M., and Ouellet, M. (2008). Methodological Guide for the Regional Characterization of Fractured Sedimentary Rock Aquifers. Ministry of Sustainable Development, Environment And Parks. INRS-ETE, Research Report R-981.
Bouchot, V., Kaboré, E. B., Itard, Y., Courtois, N., Somé, S., Sy, A. T., and Récoché, G. (2011). Burkina Faso, Georesource and Society : A South-North Scientific Project for a Rational Management of Georesources in Intertropical Africa. Vertigo-The Electronic Journal In Environmental Sciences.
Castaing, C., Billa, M., Milési, J., Thiéblemont, D., Le Metour, J., Egal, E., Donzeau, M., Guerrot, C., Cocherie, A., and Chevremont, P. (2003). Explanatory Note of the Geological and Mining Map of Burkina Faso at 1 :1,000,000. BRGM BUMIGEB, 147.
Kafando, S., Nakolendoussé, S., and Nikiéma, J. (2018). Modeling of the Alteration Wedge in a Crystalline Basement Environment: Case Study of Burkina Faso Central Region. Sustainability In Environment, 3. Https://Doi.Org/10.22158/Se.V3n1p83.
Kafando. (2020). Hydrogeological Characterization and Groundwater Potentialities in Crystalline Basement Environment : Case of the Ouagadougou Sheet [Phd Thesis]. Joseph KI-ZERBO University (Butkina Faso).
Nakolendoussé, S. (1991). Method for Evaluating The Productivity of Aquifer Sites in Burkina Faso. Geology-Geophysics-Remote Sensing. These From the University Joseph-Fourier Grenoble, I.
Ouedraogo, M. (2016). Characterization of Bedrock Aquifers for the Improvement of the Productivity of Village Hydraulic Boreholes in the Upstream White Bandama Watershed (Northern Côte d'Ivoire).
Savadogo, N. (1984). Geology and Hydrogeology of the Crystalline Basement of Upper Volta : Regional Study of the Sissili Watershed.
Sombo, A. P., Kouakou, K. É.-G., Eblin, S. G., and Sombo, B. C. (2019). Hydrogeological, Remote Sensing and Geophysical Characterization of Regional Bedrock Accidents: The Case of Sikensi-Tiassalé, Côte d'Ivoire. Afrique Science, 15, 313-327.
Toé, G. (2004). Contribution of New Geophysical Techniques to the Knowledge of Bedrock Aquifers : Electrical Tomography, Frequency Electromagnetism, Proton Magnetic Resonance: Applications in Burkina Faso.
 This work is licensed under a: Creative Commons Attribution 4.0 International License
© Granthaalayah 2014-2023. All Rights Reserved.