Impact of Social Media on Consumer Buying Pattern
Anupama Sundar D 1![]()
![]() ,
Kavyashree M B 2
,
Kavyashree M B 2![]()
![]()
1 Associate Professor, JSS Centre for
Management Studies, JSS Science and Technology University, Mysuru, India
2 Assistant Professor, JSS Centre for
Management Studies, JSS Science and Technology University, Mysuru, India
|
|
|
ABSTRACT |
|
|
Objectives: To investigate the impact of Consumer-Generated Advertising on the attitudes and behaviours of consumers for the purpose of interacting with social media features and sharing of electronic word-of-mouth. Methodology: Descriptive research methodology was adopted for the current study. A convenience sampling technique was adopted and a total of 65 responses were collected from students and working professionals. Based on the objectives of the research a structured questionnaire was designed with five points Likert scale. The data collected was analysed with the help of SPSS. Descriptive Statistics, KMO test for sampling adequacy, and Exploratory Factor Analysis were adopted for data analysis. Findings: As per the inferences gathered, it is evident that consumers perceived the video advertisements on YouTube and framed them as consumer-generated or firm-generated advertisements, for the purpose of determining the effects of the credibility of the source, with various levels of product involvement. The research results indicated, individual consumers as a source credibly enhanced the attitudes and behaviours of advertisements. Application: The study
provides insights for business leaders and managers, to take the initiatives
to influence consumers to develop significantly positive attitudes and behaviors
towards the firm’s advertisements. |
|||
|
Received 24 September 2022 Accepted 25 November 2022 Published 06 December 2022 Corresponding Author Anupama
Sundar D, anu11_99@yahoo.com DOI10.29121/granthaalayah.v10.i11.2022.4863 Funding: This research
received no specific grant from any funding agency in the public, commercial,
or not-for-profit sectors. Copyright: © 2022 The
Author(s). This work is licensed under a Creative Commons
Attribution 4.0 International License. With the
license CC-BY, authors retain the copyright, allowing anyone to download,
reuse, re-print, modify, distribute, and/or copy their contribution. The work
must be properly attributed to its author.
|
|||
|
Keywords: Social Media, Advertising, Consumers,
Buying Pattern |
|||
1. INTRODUCTION
The eventful boom in the use of social media has given space for individuals to develop, generate and disseminate online videos on the wide variety of brands available in the marketplace. In the previous era, only business enterprises were developing a video advertisement and disseminating them. In the present scenario, consumer-generated advertisements have been shared with millions in an ample of time. Consumer-generated Videos are conceptualized as” the advertisements shared in a public platform, generated by individuals, focusing on a particular recognized brand in the marketplace” Campbell et al. (2011). Research work Nielsen (2012), indicates when compared to traditional advertisements, consumers rely on online reviews and trust their peers while making a choice on their purchase intentions. A few of the brands, face the challenge of power shifts, through these kinds of user-generated content. Consumers tend to use Web 2.0 interactive features, like posting comments and providing recommendations or ratings, which spurs conversations, and opinion sharing on brands in social media. In turn, it is convenient for consumers to disseminate messages about the brands in the form of electronic word of mouth. Research works on electronic word of mouth, indicates individuals tend to give their perceptions about brands and seek reviews from other members on a particular brand/product. Electronic word-of-mouth communication is a prominent tool that integrates quickly, is easy to access, has quality in the information shared, and also provides credibility Cheung (2012). As noted by, Hung, and Li (2007), consumers shared interests in common, involvement, and familiarity with a particular intended category and its advertisements.
2. LITERATURE REVIEW
Prominent research works pertaining to Consumer Generated Advertising and their outcomes are considered in the study. The credibility of source related to user generated content provides significant insight on consumer generated advertisements in terms of persuasion. The degree of product involvement through Consumer generated advertisements depicts the interest in product categories, and their impact on consumers. The attitudes and behaviours of individuals towards the near filed communications and their impact on persuasion of messages received is broadly represented in Elaboration Likelihood model. As opined by, Ma and Agrawal (2007), Zhang (2006), source credibility is known to balance the asymmetry in information between the marketers and consumers. Source credibility is known to have two sub-dimensions: expertness and trustworthiness Tormala et al. (2007). The degree to which a consumer is capable of performing tasks relevant to that topic and is qualified to discuss it is referred to as their level of expertise Alba and Hutchinson (1987), Bettman and Park (1980). According to Mccole (2002),being trustworthy is the capacity to accept or endorse something without further research or supporting documentation.
In the viewpoint of researchers, trustworthiness has received more attention as it plays a significant role in encouraging active participation and thus revealing the consumer’s personal information Han and Windsor (2011). When it comes to the internet environment, where customers actively search for, share, and comment on product-related information, source credibility for CGA is based on attitudes and behaviours. As reported by Nielsen (2012), Consumers' faith in traditional advertising is declining, while their trust in internet media is rising as a result of the latter's capacity to include such user reviews and postings. Web 2.0 has turned consumers into participants rather than the conventional target audiences, especially with social media.
As opined by Han and Windsor (2011), the factor of trust supports consumers to reveal information for the purpose of enhancing their reputations and thus adds credibility to the advertisements viewed by them. While encountering the counter attitudinal messages, it is likely for the consumers to establish physiological and psychological screens to retain the pre-existing attitudes Ahluwalia (2000). When compared to the firm-generated advertisements, consumer generated advertisements appear to be more credible and trustworthy Lawrence and Fournier (2013), MacKinnon (2012), which is not the same in all cases. The credibility of the source from Consumer Generated Advertisements, outpaces the firm generated advertisements, to significantly influence the attitudes of consumers towards the brand and the advertisement Lawrence and Fournier (2013). The consumers represent high level of trust for videos that provide reviews on a particular brand and product, since the review is from another consumer and not from the product manufacturer Ismagilova et al. (2020)
Electronic word of mouth communications tends to get associated with the behaviours and is positively influenced with Consumer Generated Advertisements. As opined by Chatterjee (2011), consumers more likely recommend the brand messages received from other consumers compared to the firm-generated messages. In contrast Ertimur and Gilly (2012), reported that, consumers critiques the quality of Consumer Generated Advertisements, and considered the source to be authentic and knowledgeable even though it lacked in expertise, credibility in designing the advertisements and the messages.
Thompson and Malaviya (2013), reported that, while evaluating the consumer generated advertisements that won the brand-sponsored contests, it was found that consumer critique the competence level of consumer generated advertisements, even after identifying themselves with the source.
The present study examines the responses of consumers towards Consumer Generated Advertisements.
3. OBJECTIVES OF THE RESEARCH
The focus of the research is to examine the impact of social media on consumer buying pattern Specific objectives of the study are:
1) To investigate the perception of consumers towards online shopping.
2) To examine the factors that tend to motivate consumers to shop through social media.
3) To examine the degree of influence of social media towards buying behavior of consumers.
4. RESEARCH METHODOLOGY
The study was descriptive in nature. Self-administered questionnaire covering all the variables of the study was developed. Data was gathered from 65 respondents. The sample size was computed as indicated below. Substitution of value of p as 0.10, d as 0.05, and z as 1.96 is made. P is the probability of occurrence and q is probability of non-occurrence. E is standard error and z is confidence level. The sample size 139 thought to be adequate one. As there would be errors, 65 samples were considered.
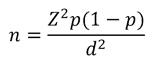
Where, P is the probability of occurrence, q is probability of non-occurrence. E is the standard error and Z is the confidence level.
5. STATISTICAL ANALYSIS
The data and information was processed by using statistical package for social sciences (SPSS) software. KMO test to check the adequacy of the data, exploratory factor analysis, confirmatory factor analysis was conducted to discover and verify the factor structure.
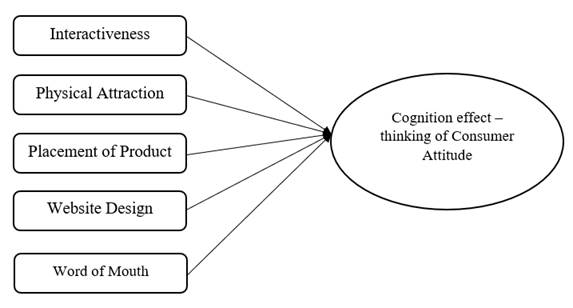
6. CONCEPTUAL MODEL OF THE STUDY
Figure 1
|
Figure 1 |
7. HYPOTHESIS OF THE STUDY
7.1. COGNITION EFFECT
H0: There is no significant relation between the cognition effect and social media.
H1: There is a significant relation between the cognition effect and social media
Interactiveness
H0: There is no significant relation between the interactiveness and Cognition effect.
H2: There is a significant relation between the interactiveness and Cognition effect.
Physical Attraction
H0: There is no significant relation between the Physical Attraction and Cognition effect.
H3: There is a significant relation between the Physical
Attraction and Cognition effect. Placement
of the Product
H0: There is no significant relation between the Placement of the Product and Cognition effect. H4: There is a significant relation between the Placement of the Product and Cognition effect.
Website Design
H0: There is no significant relation between the Website Design and Cognition effect.
H5: There is a significant relation between the Website Design and Cognition effect.
Word of Mouth
H0: There is no significant relation between the Word of Mouth and Cognition effect.
H6: There is a significant relation between the Word of Mouth and Cognition effect.
8. DEFINITION OF VARIABLES
Interactiveness: a two-way electronic communication system which includes the actions of the users.
Physical attraction: The attitude of consumers towards a brand, product.
Placement of product: A type of advertising through which the branded products and services are featured targeting large audience.
Website design: Design of websites covering product related information easily accessible to consumers through internet.
Word of Mouth: A form of communication and information sharing spread by prospective customers.
Cognition effect of thinking of consumer attitude: Affect is regarding as the feeling of responses; Cognition is the extent of mental thinking of individuals.
9. DATA ANALYSIS
9.1. DESCRIPTIVE STATISTICS
Table 1
|
Table 1 |
|||||||
|
|
N Statistic |
Range Statistic |
Minimum Statistic |
Maximum Statistic |
Sum Statistic |
Mean |
|
|
|
|
|
|
|
|
Statistic |
Std Error |
|
D2 |
64 |
2 |
3 |
5 |
287 |
4.48 |
0.70 |
|
@4 |
64 |
2 |
3 |
5 |
279 |
4.36 |
0.75 |
|
@4 |
64 |
2 |
3 |
5 |
280 |
4.38 |
0.79 |
|
@5 |
64 |
2 |
3 |
5 |
252 |
3.94 |
0.91 |
|
@4 |
64 |
3 |
2 |
5 |
253 |
3.95 |
0.96 |
|
@4 |
64 |
2 |
3 |
5 |
276 |
4.31 |
0.70 |
|
@5 |
64 |
3 |
2 |
5 |
276 |
4.31 |
0.109 |
|
@4 |
64 |
4 |
1 |
5 |
252 |
3.94 |
0.111 |
|
@4 |
64 |
4 |
1 |
5 |
237 |
3.70 |
0.120 |
|
@2 |
64 |
4 |
2 |
5 |
240 |
3.75 |
0.092 |
|
@5 |
64 |
3 |
1 |
5 |
277 |
4.33 |
0.106 |
|
@5 |
64 |
3 |
1 |
5 |
275 |
4.30 |
0.128 |
|
@5 |
64 |
3 |
1 |
5 |
256 |
4.00 |
0.109 |
|
@5 |
64 |
3 |
2 |
5 |
272 |
4.25 |
0.109 |
|
@4 |
64 |
4 |
2 |
5 |
252 |
3.94 |
0.074 |
|
@4 |
64 |
3 |
2 |
5 |
254 |
3.97 |
0.086 |
|
@5 |
64 |
4 |
2 |
5 |
256 |
4.00 |
0.120 |
|
@5 |
64 |
4 |
1 |
5 |
252 |
3.94 |
0.113 |
|
@3 |
64 |
4 |
2 |
5 |
236 |
3.69 |
0.129 |
|
@4 |
64 |
4 |
1 |
5 |
245 |
3.83 |
0.124 |
|
@4 |
64 |
4 |
1 |
5 |
246 |
3.84 |
0.129 |
Table 2
|
Table 2 |
||||||
|
|
Std. Deviation Statistic |
Variance Statistic |
Skewness |
Kurtosis |
||
|
|
|
|
Statistic |
Std. Error |
Statistic |
Std. Error |
|
D2 |
.563 |
.317 |
-.487 |
.299 |
-.782 |
.590 |
|
@4 |
.601 |
.361 |
-.339 |
.299 |
-.634 |
.590 |
|
@4 |
.630 |
.397 |
-.492 |
.299 |
-.610 |
.590 |
|
@5 |
.732 |
.536 |
.098 |
.299 |
-1.092 |
.590 |
|
@4 |
.765 |
.585 |
-.139 |
.299 |
-.710 |
.590 |
|
@4 |
.560 |
.313 |
-.044 |
.299 |
-.590 |
.590 |
|
@5 |
.871 |
.758 |
-.961 |
.299 |
-.176 |
.590 |
|
@4 |
.889 |
.790 |
-.716 |
.299 |
.692 |
.590 |
|
@4 |
.903 |
.815 |
-.569 |
.299 |
.292 |
.590 |
|
@2 |
.959 |
.921 |
-.250 |
.299 |
-.872 |
.590 |
|
@5 |
.736 |
.541 |
-1.844 |
.299 |
6.445 |
.590 |
|
@5 |
.849 |
.720 |
-1.745 |
.299 |
3.985 |
.590 |
|
@5 |
1.024 |
1.048 |
-.917 |
.299 |
.192 |
.590 |
|
@5 |
.873 |
.762 |
-1.109 |
.299 |
.664 |
.590 |
|
@4 |
.871 |
.758 |
-.771 |
.299 |
.229 |
.590 |
|
@4 |
.590 |
.348 |
-.474 |
.299 |
1.622 |
.590 |
|
@5 |
.690 |
.476 |
-.898 |
.299 |
1.933 |
.590 |
|
@5 |
.957 |
.917 |
-1.328 |
.299 |
1.898 |
.590 |
|
@3 |
.906 |
.821 |
-.386 |
.299 |
-.531 |
.590 |
|
@4 |
1.032 |
1.065 |
-1.164 |
.299 |
1.150 |
.590 |
|
@4 |
.996 |
.991 |
-.971 |
.299 |
.376 |
.590 |
|
@3 |
1.067 |
1.139 |
-.744 |
.299 |
-.330 |
.590 |
|
@3 |
1.246 |
1.552 |
-.699 |
.299 |
-.428 |
.590 |
|
@4 |
.984 |
.968 |
-.877 |
.299 |
.777 |
.590 |
|
@4 |
.957 |
.917 |
-.446 |
.299 |
-.163 |
.590 |
|
@4 |
1.009 |
1.018 |
-.537 |
.299 |
-.371 |
.590 |
|
@3 |
1.112 |
1.236 |
-.730 |
.299 |
-.114 |
.590 |
As a general rule of thumb, the values of skewness should be near to 1. Skewness measures the direction and the extent of asymmetry. The above analysis indicates, perception, purchase frequency, benefit sought were negatively skewed. The nearer the value of Kurtosis to zero, it indicates the distribution is normal.
10. FACTOR ANALYSIS
Factor Analysis is a technique used to reduce a large number of variables into fewer numbers of factors. It is used to simplify data. The technique also involves data reduction.
10.1. KAISER-MEYER-OLKIN (KMO) AND BARTLETT TEST
The KMO measures the sampling adequacy which should be greater than 0.5 for a satisfactory factor analysis to proceed.
10.2. FACTOR ANALYSIS OF INDEPENDENT VARIABLE
Table 3
|
Table 3 KMO and Bartlett's Test |
||
|
Kaiser-Meyer-Olkin Measure of Sampling Adequacy. |
.542 |
|
|
Bartlett's Test of Sphericity |
Approx. Chi-Square |
18.019 |
|
|
Df |
10 |
|
|
Sig. |
.000 |
The analysis revealed one factor solutions with a KMO statistics and Bartlett’s Test with 0.000 Significance. This reveals that the sample is adequate and factor analysis is significant. From the above table we can also see that KMO is 0.542 which is more than 0.5 hence the sample taken is adequate. Hence the sampling adequacy for items of Dependent variable is meritorious stating it is acceptable.
10.3. TOTAL VARIANCE EXPLAINED
Table 4
|
Table 4 |
||||||
|
Component |
Total |
Initial
Eigenvalues |
Extraction Sums of Squared Loadings |
|||
|
|
|
% of variance |
Cumulative % |
Total |
% of variance |
Cumulative |
|
1 |
1.597 |
31.940 |
31.940 |
1.597 |
31.940 |
31.940 |
|
2 |
1.096 |
21.915 |
53.854 |
1.096 |
21.915 |
53.854 |
|
3 |
1.003 |
20.063 |
73.918 |
|
|
|
|
4 |
0.699 |
13.988 |
87.906 |
|
|
|
|
5 |
1.294 |
25.886 |
25.886 |
|
|
|
|
6 |
1.205 |
24.098 |
49.984 |
|
|
|
|
7 |
1.197 |
23.934 |
73.918 |
|
|
|
As opined by Joseph and William (2010), for achieving the practical importance of the extracted factors cumulative percentage of total variance is extracted. Joseph, and William (2010), also reported that in social science research, where the information is less precise, a solution accounting to total variance of 60 percent is accepted and in a few cases below 60 percent is also considered to be satisfactory.
Seven items were extracted with a cumulative frequency amounting to 53.854. Based on the above inferences gathered, the above table reveals the total cumulative percentage of variance extracted was 69.701 which is considered to be acceptable as per the reports of Joseph and William (2010).
10.4. ROTATED COMPONENT MATRIX
Table 5
|
Table 5 |
|||
|
1 |
2 |
3 |
|
|
D1 |
.668 |
-.176 |
-.411 |
|
D2 |
.875 |
.032 |
.211 |
|
@4 |
.062 |
.909 |
-.114 |
|
@4 |
-.275 |
.589 |
.373 |
|
@5 |
.050 |
-.003 |
.911 |
The variables considered to have more significance were attractiveness of the website, availability of information, engagement of audience and ease of use.
10.5. FACTOR ANALYSIS FOR DEPENDENT VARIABLE
Table 6
|
Table 6 KMO and Bartlett's Test |
||
|
Kaiser-Meyer-Olkin Measure of Sampling Adequacy. |
.515 |
|
|
Bartlett's Test of Sphericity |
Approx. Chi-Square |
1080.07 |
|
|
Df |
465 |
|
|
Sig. |
.000 |
The analysis revealed one factor solutions with a KMO statistics and Bartlett’s Test with 0.000 Significance. This reveals that the sample is adequate and factor analysis is significant. From the above table we can also see that KMO is 0.515 which is more than 0.5 hence the sample taken is adequate. Hence the sampling adequacy for items of Dependent variable is meritorious stating it is acceptable.
10.6. TOTAL VARIANCE EXPLAINED
Table 7
|
Table 7 |
||||||
|
Component |
Total |
Initial
Eigenvalues |
Extraction Sums of Squared Loadings |
|||
|
|
|
% of variance |
Cumulative % |
Total |
% of Variance |
Cumulative % |
|
1 |
5.032 |
16.232 |
16.232 |
5.032 |
16.232 |
16.232 |
|
2 |
3.256 |
10.503 |
26.735 |
3.256 |
10.503 |
26.735 |
|
3 |
2.845 |
9.178 |
35.913 |
2.845 |
9.178 |
35.913 |
|
4 |
2.564 |
8.269 |
44.182 |
2.564 |
8.269 |
44.182 |
|
5 |
2.011 |
6.486 |
50.668 |
2.011 |
6.486 |
50.668 |
|
6 |
1.724 |
5.134 |
61.364 |
1.724 |
5.562 |
56.230 |
|
7 |
1.592 |
4.145 |
65.509 |
1.592 |
5.134 |
61.364 |
|
8 |
1.285 |
4.069 |
69.578 |
1.285 |
4.145 |
65.509 |
|
9 |
1.261 |
3.904 |
73.482 |
|
|
|
|
10 |
1.210 |
3.295 |
76.777 |
|
|
|
|
11 |
1.021 |
2.782 |
79.559 |
|
|
|
|
12 |
0.862 |
2.595 |
82.154 |
|
|
|
|
13 |
0.805 |
2.382 |
84.535 |
|
|
|
|
14 |
0.738 |
2.090 |
86.626 |
|
|
|
|
15 |
0.648 |
2.057 |
88.682 |
|
|
|
|
16 |
0.638 |
2.057 |
88.682 |
|
|
|
|
17 |
0.550 |
1.773 |
90.456 |
|
|
|
As opined by Joseph and William (2010), for achieving the practical importance of the extracted factors cumulative percentage of total variance is extracted. Joseph, and William (2010), also reported that in social science research, where the information is less precise, a solution accounting to total variance of 60 percent is accepted and in a few cases below 60 percent is also considered to be satisfactory.
Seven items were extracted with a cumulative frequency amounting to 65.508. Based on the above inferences gathered, the above table reveals the total cumulative percentage of variance extracted was 69.701 which is considered to be acceptable as per the reports of Joseph and William (2010).
11. FINDINGS
The study results make it evident that, in interactive environments, individual tend to search, rate, and comment regarding the videos and share opinions with others through online media. The lack of individual’s involvement towards a particular product category allows flexibility through brand messages, that appeals to broader consumer groups.
12. SUGGESTIONS
The examination can be done all over India with through websites. Various other factors having an influence on the consumer attitude can be examined.
13. SCOPE FOR THE FUTURE RESEARCH
A theoretical framework for examining the present state of brand promotions and extent of social media usage can be worked by further studies in the area of research.
14. CONCLUSION
Considering the perspectives of the academic practitioners, most of the social media platforms are used as place marketing and promotion tools, while specifically a few are clearly used for the purpose of creating brand awareness and enhancing brand identity like twitter, Facebook, and YouTube. An essential parameter is the capability to design appropriate messages and promote a brand with visuals, videos which is easy for the consumers to understand. Videos generated tend to be similar in nature, therefore an attempt to create brand awareness becomes generic, unable to catch the attention of the viewers.
Since, social media communications are developing, it is essential to be more serious on the content, the interactive approach of marketing. For the purpose of promoting interactive and conversations the content need to be more authentic.
CONFLICT OF INTERESTS
None.
ACKNOWLEDGMENTS
None.
REFERENCES
Ahluwalia, R. B. (2000). Consumer Response to Negative Publicity: The Moderating Role of Commitment. Journal of Marketing Research, 203-214. https://doi.org/10.1509/jmkr.37.2.203.18734.
Campbell, C., Pitt, L. F., Parent, M. and Berthon, P. R. (2011). Understanding Consumer Conversations Around Ads in a Web 2.0 World. Journal of Advertising, 87-102. https://doi.org/10.2753/JOA0091-3367400106
Chatterjee, S. (2011). A Study on Ambient Advertising : Marketing Novelty Going Bust. TIJ's Research Journal of Social Science and Management - RJSSM.
Cheung, C. M. (2012). The Impact of Electronic Word-of-Mouth
Communication : A Literature Analysis and Integrative Model. Decision Support
Syatems, 461-470.
https://doi.org/10.1016/j.dss.2012.06.008.
Ertimur,B. and Gilly, M. C. (2012). So What Do You Think? Consumers Create Ads and Other Consumers Critique Them. Journal of Interactive Marketing. https://doi.org/10.1016/j.intmar.2011.10.002.
Han, B. and Windsor, J. (2011). User's Willingness to Pay on Social Network Sites. Journal of Computer Information Systems, 31-40.
Hung, K. H. and Li, S. Y. (2007). The Influence of eWOM on Virtual Consumer Communities : Social Capital, Consumer Learning, and Behavioral Outcomes. Journal of Advertising Research. https://doi.org/10.2501/S002184990707050X.
Ismagilova, E., Slade, E., Rana, N. P., And Dwivedi, Y. (2020). The Effect of Characteristics of Source Credibility on Consumer Behaviour: A Meta-Analysis. Journal of Retailing and Consumer Services. https://doi.org/10.1016/j.jretconser.2019.01.005.
Joseph, F. H. Jr., and William, C. B. (2010). Multivariate Data Analysis. Pearson Prentice Hall.
Lawrence, B. and Fournier, S. (2013). When Companies Don't Make the Ad : A Multi--Method Inquiry into the Differential Effectiveness of Consumer-Generated Advertising. Journal of Advertising. https://doi.org/10.1080/00913367.2013.795120.
Ma, M. and Agrawal, R. (2007). Through a Glass Darkly: Information Technology Design, Identity Verification, and Knowledge Contribution in Online Communities. Information Systems Research, 42-67. https://doi.org/10.1287/isre.1070.0113.
MacKinnon, K. A. (2012). User Generated Content vs. Advertising : Do Consumers Trust the Word of Others Over Advertisers?
Mccole, P. (2002). The Role of Trust for Electronic Commerce in Services. International Journal of Contemporary Hospitality Management, 81-87. https://doi.org/10.1108/09596110210419264.
Nielsen. (2012). Smartphones Insight : Report.
Thompson, D.V., and Malaviya, M.(2013). Consumer-Generated Ads: Does Awareness of Advertising Co-Creation Help or Hurt Persuasion? Journal of Marketing, 33-47. https://doi.org/10.1509/jm.11.0403.
Tormala, Z. L., Brinol, P. and Petty, R. E. (2007). Multiple Roles for Source Credibility Under High Elaboration : It's all in the Timing. Social Cognition, 536-552. https://doi.org/10.1521/soco.2007.25.4.536.
Zhang, X. F. (2006). Information Uncertainty and Stock Returns. The Journal of Finance, 105-137. https://doi.org/10.1111/j.1540-6261.2006.00831.x.
 This work is licensed under a: Creative Commons Attribution 4.0 International License
© Granthaalayah 2014-2022. All Rights Reserved.