INTERMODAL CONNECTIVITY AT KAMPUNG RAMBUTAN BUS TERMINAL
Sylvira Ananda Azwar 1![]()
![]() , Siti
Sahara 1
, Siti
Sahara 1![]() , Moch Haqquttoriq
Ginting 1
, Moch Haqquttoriq
Ginting 1
1 Engineering
Faculty, Universitas Negeri Jakarta, Jakarta, Indonesia
|
|
|
ABSTRACT |
|
|
Transportation
as a means of development is an important and strategic factor in the running
of the economy. It can be seen from the high demand for transportation
services. Jakarta Capital City, which is a metropolitan area, has a high need
for transportation, especially public transportation. The high demand of
transportation is because the average population of DKI Jakarta is carry out
economic activities as a businessman or office worker, plus people commuting
from supporting areas such as Bogor, Depok, Tangerang, and Bekasi to work,
study or other activity in Jakarta. As a solution to transportation needs,
the Jakarta Provincial Government is currently building several mass
transportations, one of which is the Light Rail Transit or LRT from Bogor and
Cibubur to Central Jakarta. This LRT line is
passing through the Kampung Rambutan Terminal in East Jakarta and is planning
to have a station connected to the bus terminal. This development is expected
to be a solution to the need for integration of the LRT with the feeder mode
in the Terminal. Based on this, this study will discuss the LRT connectivity
with integrated modes at the Kampung Rambutan Terminal. The method used is
quantitative descriptive study with the support of primary and secondary
data. From the results of the analysis, it is known that the level of
connectivity in terms of the time required shows quite good results, while
the level of connectivity in terms of facilities also shows good results,
this can be seen from the acquisition of the highest graph with an adequate
value of 57%. In general, it can be concluded that the LRT connectivity with
existing modes at the Kampung Rambutan Terminal is quite good. |
|||
|
Received 18 October 2022 Accepted 18 November 2022 Published 02 December 2022 Corresponding Author Sylvira Ananda Azwar, sylvira_a@unj.ac.id DOI10.29121/granthaalayah.v10.i11.2022.4839 Funding: This research
received no specific grant from any funding agency in the public, commercial,
or not-for-profit sectors. Copyright: © 2022 The
Author(s). This work is licensed under a Creative Commons
Attribution 4.0 International License. With the
license CC-BY, authors retain the copyright, allowing anyone to download,
reuse, re-print, modify, distribute, and/or copy their contribution. The work
must be properly attributed to its author.
|
|||
|
Keywords: Connectivity, Public Transportation,
Inter-Modal, Terminal |
|||
1. INTRODUCTION
In the transportation system, connectivity has an important role in the process of organizing transportation, especially in the integration of transportation modes. Initially the concept of connectivity was first used to evaluate connectivity between airports, namely the extent to which airports are connected to other airports in a certain network Zhu et al. (2018). Furthermore, this concept was developed so that it can cover other modes such as trains, public transportation, and other public transportation. In short, connectivity can be interpreted as a unit in a transportation network. There are several theories about connectivity including: a. Connectivity is defined as the degree to which points or nodes in a transportation network are interconnected with one another Mishra et al. (2012). b. Connectivity is described as a measure of the availability of facilities at certain points on a transportation network Labi et al. (2019). c. Connectivity is the convenience in terms of time, cost, and travel between a different transportation route system or capital system Alstadt et al. (2012).
Metropolitan-scale transportation such as in DKI Jakarta needs to pay attention to one of the supporting aspects to support the mobility of public transportation users, namely the connectivity factor between each mode. With connectivity, a network of transportation systems can be formed that functions to connect every existing mode of transportation. Connectivity is also an indicator of success in integrated transportation development Kuswati and Herawati (2017). In addition, the existence of intermodal connectivity will create more efficient public transportation, especially in terms of time and cost. As time goes by, DKI Jakarta is now reforming transportation and building more efficient transportation, using the latest technology, and being able to connect with other modes. One type of transportation that is planned to meet these needs is Light Rail Transit or abbreviated as LRT. LRT is a system on the line an electric train with a metropolitan scale that has characteristics in the form of the ability to run train cars one by one and pick up and drop passengers along specially made tracks on terraced land, overhanging structures, subways, or on roads Muhammad and Triana (2017). The construction of the LRT is considered a solution to reduce congestion and air pollution which has been a problem in DKI Jakarta. On the other hand, currently the LRT construction has not effectively reached connectivity with feeder modes such as buses and other transportation because there are no LRT stations that are directly connected to the Terminal which is a gathering place for feeder modes.
2. MATERIALS AND METHODS
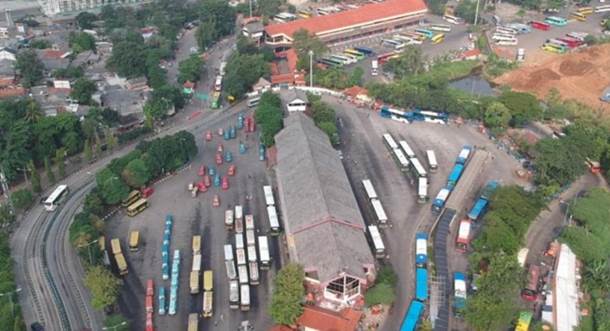
The place for this research is located at Kampung Rambutan Terminal which is a type A terminal. This terminal is located in Gg. Rambutan, No.11, Ciracas Exit, Cipayung District, East Jakarta City 13850. Kampung Rambutan Terminal has been actively used since October 1, 1992. This terminal was established on an area of 141,000 m2, which makes it one of the largest passenger transport terminals in Indonesia. Since its establishment, this terminal not only serves inter-city transportation between provinces but also serves transportation routes within the city. Kampung Rambutan Terminal is very crowded with passengers, because it functions as a liaison between cities and has fairly easy access because it is located right next to the toll entrance. Apart from being an inter-city and intra-city terminal, the Kampung Rambutan terminal is also used by the DKI Jakarta Provincial Government as a Transjakarta bus terminal. As an effort to organize a better terminal, the Kampung Rambutan terminal has a vision and mission to be achieved. Its vision is to create an integrated and quality transportation system parallel to big cities in developed countries.
This study is conducted a research approach using descriptive quantitative methods. There are several factors that support the integration can be run smoothly. One of the important factors that need to be considered is travel time. Travel time is one of the main factors that need to be considered in transportation, this is because travel time is the main attraction in considering the choice of mode to be used. In public transportation, travel time can be divided into several parts, namely the time when the transportation stops, the waiting time for transportation, the time to change modes of transportation, and the time in transit Sijabat et al. (2013). For some modes of transportation, there are other factors that determine the journey, namely the cost of travel. Travel costs are the costs of moving goods or passengers or can also be referred to as transit costs. Travel costs have an influence on the operational costs of a mode of transportation because these costs include costs that must be incurred in running this mode of transportation Ritonga et al. (2015).
Figure 1
|
Figure 1 Location Study: Kampung Rambutan Terminal |
In
addition, in the integration of modes, there is one main factor that needs to
be considered, namely public transportation that is interconnected or what can
be referred to as multimodal transportation. The existence of multimodal
transportation is considered to be able to increase
optimization both in terms of transportation of people and goods Wibowo and Chairuddin
(2017).
In
multimodal transportation, there are several concepts Chairi et al. (2017), including:
1)
Connect Mode
Connecting
mode is a mode that is used as a connector either before or after the main mode
is used. The previous mode is the mode used from home to transportation stops
such as bus stops. While the after mode is the mode used from the place of
transit to the destination.
2)
Main Mode
The main
mode is the mode used in a long journey. This mode usually has a schedule of
arrivals and departures.
3)
Multimodal Network
Multimodal
network can be said to be the most basic thing in the multimodal component.
This network is used as a link between several types of transportation modes.
4)
Mode Switch Facility
Mode
transfer facilities have a role to attract private transport passengers so that
they can be integrated into public transport modes. One form of this facility
is the availability of sufficient parking space.
5)
Mode Switch Facility with Different Network
This
facility is used as a connection point between two types of modes with
different networks, for example, between the road network and the rail network.
6)
Regulation
The
existence of regulations in multimodal transportation is intended so that the
performance of public transportation can be controlled properly.
Based on those
theory, because of limitation of time and budget, the indicator used are the
Intermodal Connectivity Level in terms of Time which consists of 3 variables,
including:
1)
Travel
time is the time it takes to travel using this mode of transportation.
2)
Queuing
time is the time required for passengers to enter the mode of transportation.
3)
Waiting
time is the time calculated when passengers wait for the mode of transportation
to arrive.
The bus trajectories then observed using the help of several applications, namely moovit, trafii, and google maps to obtain data related to travel time, queue time and waiting time required by passengers. Furthermore, the data that has been obtained is classified using the rating scale method to determine the level of time speed of each mode. This method is a method that divides the assessment into five categories, while the factors used must be measurable so that the assessment can run objectively Satria and Agustini (2018). The scale used for this assessment can be seen in the table below. Table 1
Table 1
|
Table 1 Time Speed Rating Scale |
||
|
Time Speed |
Time |
Rating |
|
Very Fast |
Travel time: 25 – 50 min Queuing time: 0 – 2,5 min Waiting time: 0 – 5 min |
5 |
|
Fast |
Travel time: 50 – 75 menit Queuing time: 2,5 – 5 menit Waiting time: 5 – 10 menit |
4 |
|
Moderate |
Travel time: 75 – 100 menit Queuing time: 5 – 7,5 menit Waiting time: 10 – 15 menit |
3 |
|
Slow |
Travel time: 100 – 125 menit Queuing time: 7,5 – 10 menit Waiting time: 15 – 20 menit |
2 |
|
Very Slow |
Travel time: > 125 menit Queuing time: > 10 menit Waiting time: >20 menit |
1 |
Intermodal Connectivity Level in terms of Facilities
The physical condition of the connecting facilities can describe the ease of movement for pedestrians. The ease of movement in order to reach the destination point can be referred to as accessibility for pedestrians. The accessibility for pedestrians can be assessed based on 6 types of variables Sisy Tiara et al. (2017), including the following:
1) Mileage is the distance from the place of origin to the transit point that is reached on foot.
2) Connectivity, namely whether or not pedestrian paths are available for pedestrians
3) Ease, judging by the availability of disabled facilities such as guiding blocks and ramps.
4) Convenience can be seen in terms of the presence or absence of functional disturbances on the pedestrian path. In addition, it can be seen from the availability of road shade along the path for pedestrians such as canopies, roofs, or it could be in the form of trees.
5) Friendliness, seen based on the smoothness for pedestrians in walking or what can be called seamless walking, which consists of 4 criteria, namely the availability of ramps on every incline or descent, available flat and consistent pedestrian paths, no disturbances in pedestrian paths, and there are signposts for pedestrians.
6) Visibility, namely the visibility of pedestrians when walking to the transit point, which consists of 4 criteria including the distance to the transit point <200 meters, there is a special building as a transit point can be a bus stop or terminal, there is a signage that directs to the direction of the transit point, and there is signage of the name of the transit point.
The research was conducted by direct observation and using supporting data from the Department of Transportation. The method used is still the same as before, namely using a rating scale where the assessment indicators are seen based on the 6 variables.
Table 2
|
Table 2 Facility Rating Scale |
||||||
|
Connectivity |
Ease |
Convenience |
Friendliness |
Visibility |
Weight |
|
|
Defined
as a sidewalk |
Facilities
for the disabled |
Malfunctions |
Road shading |
Seamless walking |
Transit
point visibility |
|
|
Excellent 100% of the path is defined as
sidewalk |
Excellent 100%
of the pathway’s available disability facilities |
Excellent no
malfunctions |
Excellent 100% of the lanes are shaded |
Excellent meets
4 criteria |
Highly
Visible meets 4 criteria |
5 |
|
Good 75 -
99% of lanes defined as sidewalks |
Good 75 -
99% of the lines available for disabled facilities |
Good slight malfunctions |
Good 75 - 99% lanes are shaded |
Good meets
3 out of 4 criteria |
Visible meets
3 out of 4 criteria |
4 |
|
Enough 50 - 74% of lanes defined as sidewalks |
Enough 50 -
74% of the lines available for disabled facilities |
Enough slight
malfunctions |
Enough
50 -
74% of the lanes there is shade |
Simply meet
2 out of 4 criteria |
Quite
Visible meets
2 out of 4 criteria |
3 |
|
Less 25 - 49% of lanes defined as sidewalksr |
Less 25 -
49% of pathways available for disabled facilities |
Less many malfunctions |
Kurang 25 -
49% lanes are shaded |
Less meets
1 of 4 criteria |
Less
Visible meets
1 of 4 criteria |
2 |
|
Bad 0 - 24% of lanes defined as sidewalks |
Bad 0 -
24% of pathways available for disabled facilities |
Bad very
much impaired functioning |
Bad 0 -
24% lanes there is shade |
Bad does not meet the criteria |
Invisible does
not meet the criteria |
1 |
3. RESULTS AND DISCUSSIONS
Public
transportation route data which the origin and/or destination from Kampung
Rambutan consists of several types of transportation, namely:
1)
Transjakarta Bus Rapid Transit: 9 routes
2)
Small
Bus: 12 routes
3)
Reguler Bus: 8 routes
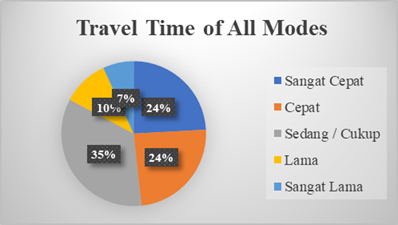
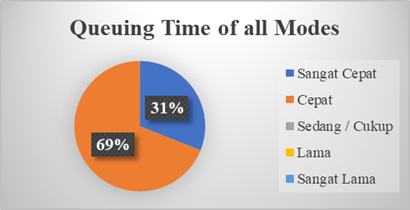
The results of the survey to measure travel time, queue time and waiting time of each routes are described in Figure 2, Figure 3 and Figure 4.
Figure 2
|
Figure 2 Travel Time of All Modes |
Figure 3
|
Figure 3 Passenger Queuing Time of all Modes |
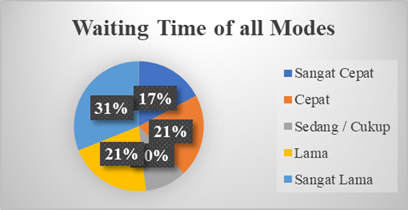
Figure 4
|
Figure 4 Passenger Queuing Time off all Modes |
Based on the overall graph acquisition, it can be seen that in terms of travel time and queuing time, the highest values obtained are fast and moderate or sufficient. Meanwhile, in terms of the waiting time for modes, the highest value is very long, but if it is more detailed, this is because the waiting time for buses is quite long, while for angkot and Transjakarta it is quite sufficient. If viewed as a whole, it can be said that the level of intermodal connectivity at the Kampung Rambutan Terminal can run well.
After an
assessment of the physical facilities of connectivity along the transit route,
the following results were obtained Table 3
Table 3
|
Table 3 Facility of Connectivity Assessment Results |
|||
|
Variable |
Observation |
Connectivity Level |
Findings |
|
Distance and Time |
Route from LRT
station to Kampung Rambutan Terminal |
3 |
Quite accessible
because the distance ranges from 500 meters with a walking time of about
10-15 minutes. |
|
Connectedness |
The lane is a
sidewalk |
3 |
It is enough to
connect with the sidewalk, but not all lanes use sidewalks because there are
still pedestrian paths that coincide with vehicle/or transportation entry
lanes. |
|
Ease |
Disability
facilities available |
3 |
There are already
disabled facilities such as wheelchairs, special toilets, and ramps, but
there is still no portable ramp. |
|
Comfort |
Road shading Malfunctions |
2 3 |
The shady
facilities are not perfect because there are still paths that are traversed
without any shade roofs or trees. In general, it is
good, but there are still points through which there are still street vendors. |
|
Hospitality |
3 criteria of
seamless walking |
3 |
a.
Along the
route, ramps are available. b.
On most
routes, pedestrian paths are flat and consistent. c.
There were
no street vendors blocking the lane at some point. |
|
Visibility |
2 visibility
criteria |
2 |
a.
There is a
special station building and a bus stop/terminal. b.
There is a
directional sign to the Terminal. |
All assessment results are then percentage according to the scale in Table 2. The results are depicted in Figure 5.
Figure 5
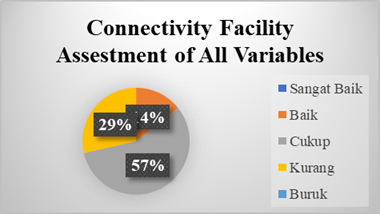
|
Figure 5 Connectivity Facility Assessment from all Variables. |
Based on the graph, it can be seen that the result of the highest score shows a sufficient score of 57%, followed by a less than 29% score and a good score of 14%. So, it can be said that in terms of the physical condition of the connecting facilities, it is quite good
4. CONCLUSIONS and RECOMMENDATIONS
Based on the results of data processing and analysis related to the level of connectivity in terms of time and facilities, it can be said that LRT connectivity with existing modes at the Kampung Rambutan Terminal in terms of the time required is quite good where the queue time and travel time are low and moderate results, meanwhile the waiting time is high, especially for the city bus.
On the other side, passenger connectivity from the LRT Station to the Kampung Rambutan Terminal also show quite good results where the facility assessment shows the highest score, which is sufficient with a percentage of 57%, followed by a less value with a percentage of 29%, and a good value with a percentage of 14%.
Based on the analysis that has been obtained, LRT passengers can easily continue their journey with the existing modes at the Kampung Rambutan Terminal to the Jabodetabek area. This is because there are many modes of transportation, buses, and Transjakarta that go to the Jabodetabek area, and the departure time is almost every time.
CONFLICT OF INTERESTS
None.
ACKNOWLEDGMENTS
None.
REFERENCES
Alstadt, B., Weisbrod, G., and Cutler, D. (2012). Relationship of Transportation Access and Connectivity to Local Economic Outcomes Statistical Analysis. Transportation Research Record, 2297, 154–162. https://doi.org/10.3141/2297-19.
Chairi, M., Yossyafra, Y., and Putri, E. E. (2017). Perencanaan Integrasi Layanan Operasional Antar Moda Railbus dan Angkutan Umum di Kota Padang. Jurnal Rekayasa Sipil (JRS-Unand), 13(1), 1. https://doi.org/10.25077/jrs.13.1.1-12.2017.
Kuswati, A. S., and Herawati, H. (2017). Konektivitas Transportasi Antarmoda Di Kabupaten Tulungagung. Jurnal Transportasi Multimoda, 15(1), 53. https://doi.org/10.25104/mtm.v15i1.413.
Labi, S., Faiz, A., Saeed, T. U., Alabi, B. N. T., and Woldemariam, W. (2019). Connectivity, Accessibility, and Mobility Relationships in the Context of Low-Volume Road Networks. Transportation Research Record, 2673(12), 717–727. https://doi.org/10.1177/0361198119854091.
Mishra, S., Welch, T. F., and Jha, M. K. (2012). Performance Indicators for Public Transit Connectivity in Multi-Modal Transportation Networks. Transportation Research Part A : Policy and Practice, 46(7), 1066–1085. https://doi.org/10.1016/j.tra.2012.04.006.
Muhammad, A. N., and Triana, S. (2017). Analisis Teknis Operasional Light Rail Transit Kota Bandung. Jurnal Teknik Sipil Itenas, 4(3), 36–45. https://doi.org/10.26760/rekaracana.v3i4.36.
Ritonga, D., Timboeleng, J. A., and Kaseke, O. H. (2015). Analisis Biaya Transportasi Angkutan Umum Dalam Kota Manado Akibat Kemacetan Lalu Lintas. Jurnal Sipil Statik, 3(1), 58–67.
Satria, and Agustini, A. S. (2018). Penerapan Metode Graphic Rating Scale (Grs) Dalam Penilaian Kinerja Karyawan. Kilat, 6(2), 139–144. https://doi.org/10.33322/kilat.v6i2.130.
Sijabat, R., and Ratnasari R, A. (2013). Model Pemilihan Moda Pergerakan Komuter Di Kecamatan Sayung. Teknik PWK (Perencanaan Wilayah Kota), 2(4), 988–997. https://doi.org/10.14710/tpwk.2013.3553.
Wibowo, W., and Chairuddin, I. (2017). Sistem Angkutan Multimoda dalam Mendukung Efisiensi Biaya Logistik di Indonesia Multimodal Transport System in Supporting. Jurnal Manajemen Transportasi & Logistik - Vol. 04 No. 01, 04(01), 1–14.
Zhu, Z., Zhang, A., and Zhang, Y. (2018). Connectivity of Intercity
Passenger Transportation in China : A Multi-Modal and Network Approach. Journal
of Transport Geography, 71(January), 263–276. https://doi.org/10.1016/j.jtrangeo.2017.05.009.
 This work is licensed under a: Creative Commons Attribution 4.0 International License
© Granthaalayah 2014-2022. All Rights Reserved.