THE RECENT PUBLIC DEFICITS AND THE ANALYTICAL DEFLECTIONS OF FISCAL SUSTAINABILITY COMPONENTS IN THE EU
Ahmet Niyazi Özker 1 ![]()
![]()
1 Bandirma
Onyedi Eylul University, Faculty of Economics and Administrative Sciences,
Public Finance Department 10200, Turkey
|
|
|
ABSTRACT |
|
|
This study is
aimed to deal with the equivalence through fiscal deviations of the effect
values of public deficits on fiscal sustainability as an
average value in European Union countries with other macro values. Achieving
fiscal sustainability as the macro component is also directly related to
public deficits and economic growth trends, and public borrowing trends that
directly affect public deficits in an economy focused on economic growth. The
real value of these components not only directly impacts the existing
economic growth but also creates an infrastructure that directly affects
economic-fiscal sustainability with different values of the
economy. The effect of public debt on economic growth in the European Union
(EU) countries, besides being an average value, is significant with the scale
effect of the values in EU countries as the dependent variable
value of public deficits. In this context, revealing the deviations based on
public values in public borrowings as a ratio of economic
growth and economic growth, but also with other rates such as exchange rates,
discounts, and inflation, has a meaningful place in the process
of the interpretation of the sustainability of public deficits. In this
respect, fiscal sustainability based on public borrowings in the EU
necessitated its handling as the EU in general terms and the Euro Zone after
2017. This situation seems to be the reason for the continuation of public
fiscal sustainability based on all countries, which is generally an average
value in the EU, and a new borrowing policy subject to further economic
growth and shaped by different strategies. |
|||
|
Received 15 August 2022 Accepted 16 September 2022 Published 11 October 2022 Corresponding Author Ahmet
Niyazi Özker, niyaziozker@yahoo.com DOI10.29121/granthaalayah.v10.i9.2022.4799 Funding: This research
received no specific grant from any funding agency in the public, commercial,
or not-for-profit sectors. Copyright: © 2022 The
Author(s). This work is licensed under a Creative Commons
Attribution 4.0 International License. With the
license CC-BY, authors retain the copyright, allowing anyone to download,
reuse, re-print, modify, distribute, and/or copy their contribution. The work
must be properly attributed to its author.
|
|||
|
Keywords: Economic Growth, Fiscal Drift, Fiscal
Sustainability, Macro Components, Public Deficits JEL Codes:
H11, H62, H81 |
|||
1. INTRODUCTION
In a structure where public deficits continue, the phenomenon of fiscal sustainability is shaped by some important macro values and structural variables related to EU countries. Undoubtedly, at the beginning of these macro values, it is seen that the variability of market prices is related to impact values such as inflation and the value deviations in all kinds of employment power and possible public goods stocks that may arise with market prices. In this process, where sectoral preferences are concerned, significant deviations in public revenues and expenditures related to the analytical analysis of public deficits and some structural values that may arise are also effective in the process Teresa et al. (2007).
The inherent variability differences in public expenditures and revenues also significantly affect the proportional position of public borrowings in the GNP regarding the financial structures of countries. This fact has an important place in fiscal sustainability analysis with its macro impact values for fiscal sustainability. In this respect, market prices within GNP ratios and the variability of market prices in real terms as a ratio of national income are also expressed by a critical structural financial position, and it is observed that each deviation in the emergence of government deficit makes a different average contribution, especially in EU member countries where the value of each deviation in real terms varies Soyres et al. (2022). In addition to all these, it should emphasise that the inclusion of public deficits and annual average exchange rate variability based on GNP into the equation, especially within the framework of the definitions in the revision of financial reports, is an important step. In other words, comparing the annual exchange rate variability at the end of each year based on GDP and public borrowings reveals an essential step toward the realisation of the issue. In this respect, the relationship between public deficits and fiscal sustainability in real terms shows some structural values and the definitions of more public expenditures and income methods Auerbach and Gorodnichenko (2013). This approach makes important statements among EU countries, especially in Germany, Estonia, Ireland, Slovenia, Slovakia and Finland. It is also essential to analyse fiscal sustainability in the EU that the monetary policies of these countries have a different effect than all the other twenty-seven EU countries when it comes to the current nineteen countries in the Euro Area.
In this context, it should be stated that the different contribution values in the total European Union countries, where each EU country is in question, significantly affect the government revenues and the growth efficiency in the national income level with a significant deviation effect Auerbach and Gorodnichenko (2012). However, today, it is understood that economic growth-oriented structuralist approaches are far from being periodic, especially within a planned method of public income balances and expenditures. This understanding also reveals that public balances and fiscal sustainability mean balances about one current year and an essential set of periodic balances extending to other years. In this respect, each macro change within the EU countries is also a vital problem for empirical studies, as the actual average contribution values in evaluating the differences in each country with the economic growth trends are different. In this respect, the direct relationship between the components of fiscal sustainability and public deficits across the EU reveals an essential mechanism of influence and financial infrastructure in putting the deviation values in public debts. It appears that the possible sustainability margin of the deviations in the public deficits and infrastructure shaped by the other components of the fiscal sustainability principles constitute the intermediate basis of the future budgetary sustainability projections of the EU countries Laubach (2009).
2. LITERATURE REVIEW
Many studies have made essential determinations based on fiscal sustainability and public deficits, especially regarding EU countries. However, considering that these studies were carried out with models that are not very up to date for today within the framework of the earlier approaches, it is noteworthy that the impact values of these studies are pretty controversial today. More recent studies, which consider many macro-effect values on an institutional basis at the global level, are of great importance in the literature. The analytical results of the studies conducted by the OECD and the EU based on institutional financial institutions in countries using monetary units in the Euro Area or outside the Euro Area reveal a very important structure for us. These structural impact values on fiscal sustainability are meaningful in terms of presenting the studies that are subject to different analyses between countries as a whole, although they also reveal different approaches.
Undoubtedly, many serious studies have been carried out on the EU basis to reveal the deviations in public deficits in recent years and the impact values of these deviations on the phenomenon of fiscal sustainability. There are many studies on the relationship between public deficits and fiscal sustainability. In addition to the topicality and the degree of impact of the studies, we also found it appropriate to discuss a short but meaningful literature framework that is directly related to our research. These studies on qualitative and quantitative determinations have a remarkable feature, with some unique approaches to the phenomenon of significant monetary change and inflation, especially in the last period, and the different effects of macro contribution value on fiscal sustainability in fiscal sustainability in macro values. This feature also reveals that the possible inflation values and stock goods variables in market prices can create increasingly different contribution levels on an EU basis. In Table 1 below, it is possible to see some of the literature reviews that we find essential currently in the table below:
Table 1
|
Table 1 The Literature Review on the Monetary Expansion |
|||
|
Person/Institution Doing the Study |
The Name of Study |
Location/Institution Where the Study Was Conducted |
Objective of The Evaluation and Findings |
|
Hamid R. Davoodi, Paul
Elger, Alexandra Fotiou, Daniel Garcia-Macia, Xuehui Han, Andresa Lagerborg,
W. Raphael Lam, and Paulo Medas (2022) Davoodi et al. (2022) |
Fiscal
Rules and Fiscal Councils Recent Trends and Performance during the COVID-19
Pandemic |
IMF Working Papers WP/22/11 |
The AB countries
discussed fiscal sustainability as related to economic growth. The new
financial change policies and obligations of these AB for public fiscal
deviations. |
|
Deutsche Bundesbank (2020) Deutsche Bundesbank (2020) |
The Informative Value of
National Fiscal Indicators in
Respect of Debt at the European Level |
Deutsche Bundesbank Monthly
Report December 2020 |
In this study,
significant current emphasis has been placed on the issue of fiscal
sustainability in the European Union countries regarding debt consolidation
and the sensitivity of financial indicators related to this consolidation to
their debts. |
|
European
Commission-Eurostat (2022) European Commission-Eurostat (2022) |
Euroindicators 46/2022 - 22 April 2022 |
Amendment by Eurostat to
Reported Data |
It is a study that
discusses the variability in terms of public revenues and public expenditures
in EU member states, especially in real terms. It emphasizes all the macro
indicators regarding the EU countries related to actual public deficits in
the recent period. An evaluation has been made on financial sustainability
and public debts, which presents a critical quantitative and data
infrastructure. |
|
Piotr MISZTAL (2021)
Misztal
(2021) |
Public Debt and Economic
Growth in The European Union. Empirical Investigation |
Wseas Transactions on Business and Economics Volume
18, 2021 |
It is an analytical study
aimed at analysis fiscal sustainability understanding the old order of public
borrowings and the practical values of the central government budget in
measuring the indebtedness of the countries in the European Union and all
general public deficits. |
|
and Sebastian Barnes (2020) Veldhuizen and Barnes (2020) |
European
Fiscal Monitor September 2020 |
The Network of EU
Independent Fiscal Institutions and Acting Chair at the Irish Fiscal Council (2020) |
It is an independent study that reveals the
institutional efficiency of the financial institutions in question and an
economic indicator of the measures taken for the sustainability of all kinds
of fiscal management related to institutional efficiency within the scope of
the EU. In the study, EU-oriented fiscal balances were put forward as a
financial monitor study. |
|
Nigel Chalk and Richard Hemming (2000) Chalk
(2000) |
Assessing Fiscal Sustainability in Theory and
Practice |
IMF Working Paper WP/00/81 (April 2000) |
This study also reveals the
projections of fiscal sustainability, one of the main problems for European
Union countries after 2000 and has emphasised the critical absolute criteria
and components of fiscal sustainability in theory and practice. |
|
(2008) Chapman et al (2008) |
State and Local Fiscal Sustainability: The
Challenges: The Quest for High-Performance Administration |
Public Administration Review December 2008 Special Issue |
In the study, it is a study
in which financial sustainability should be balanced not only with central
financial balances but also with some local and local financial institutions,
and the financial sustainability with local and regional structural dynamics
is qualitatively emphasized. |
|
East Carolina University- ECU (2021) East
Carolina University- ECU (2021) |
Fiscal Sustainability Initiative 2021 |
Campus Community: Academic Council, April 12,2022
Fiscal Sustainability Update |
As an institutional
academic study, financial sustainability is a current study addressed at the
university level. In particular, it is seen that the main features of
financial sustainability and the possible expected future-oriented template
are emphasized in the study. |
|
OECD (2010) OECD (2010) |
Restoring Fiscal
Sustainability: Lessons for the Public Sector. |
OECD Public Governance
Committee Working Party of Senior Budget Officials Paris 2010. |
As a study based
on fiscal sustainability in OECD countries, it emphasizes the standards taken
for harmonization as a quality in order to financial integration between OECD
countries. There are some structural predictions about ensuring financial
sustainability in the study. |
3. DYNAMICS AND NATURE OF THE PROCESS IN THE RELATIONSHIP BETWEEN PUBLIC DEFICIT AND FISCAL SUSTAINABILITY
Fiscal sustainability is an approach that can be explained by the sustainability approach with some critical internal and external financial components, especially in a process where public deficits are evaluated together with other macro values. The phenomenon of fiscal sustainability expresses a meaningful deficit procedure in its relationship with public obligations, especially when the interest values, considered primary deficits, are removed from the calculation, and the income and expenditure balance are compared European Parliament (2022). This public deficit procedure also reveals a narrow-sense approach to the expression of public deficits, in which essential deflator effects such as inflation take place in the process and are mostly handled as central government budget deficits.
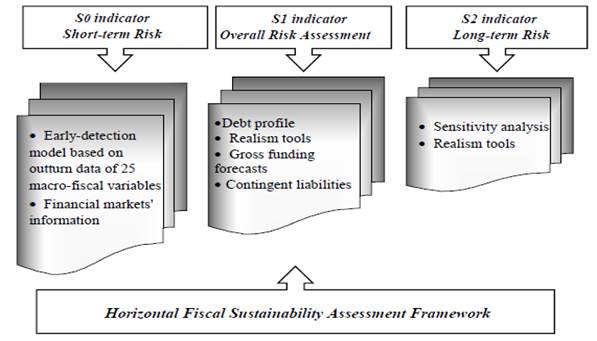
It should emphasize here that the public deficit approach is a broader concept than the central government budget deficits and includes all non-central government budgetary public economic income and expenditure balances belonging to the public economy and the public sector Meinen and Serafini (2021). In this respect, the expression as a value that changes not only with the central government budget but also with the public borrowing types and limits, which are other indicators of fiscal sustainability, is considered more meaningful, especially in terms of public borrowing. Changes in fiscal policy approach to balancing debt ratios in fiscal deficit and absolute deviations between the previous and next period directly reveal an essential stage of fiscal sustainability. From the point of view of the EU, it is necessary to deal with the issue under two main headings: One of them is the real comparison of the income-expenditure and debt balance, which can be put forward with a general approach to the Euro Area and the EU Haas and Rubio (2017). This comparison is also considered meaningful, especially with the recent emergence of some different margins on the EU-based deficits. Figure 1 below the structural framework of fiscal sustainability:
Figure 1
|
Figure 1 Structural
Framework of Fiscal Sustainability and Multifaceted Structural Impacts Source Andrey Zahariev, Anelia Radulova,
Aleksandrina Aleksandrova and Mariana Petrova (2021), “Fiscal Sustainability
and Fiscal Risk in the EU: Forecasts and Challenges in Terms of Covid-19”, Entrepreneurship and Sustainability Issues,
8(3), 622. Zahariev et al. (2021). |
As seen in Figure 1 above, the essential features in the structural framework of fiscal sustainability are the short-term risks, especially the financial policies to overcome these risks. These scenarios that examine the medium and long-term risk procedures for the future, especially the scenario and the indicators related to these scenarios, reveal as depend on this fiscal index. It should emphasize that short-term risk procedures arise from information communication and asymmetric information in financial markets. It is seen that the short-term determination of risk procedures based on 25 countries, created as a model in the EU, needs a piece of important information and mutual information sharing, especially in terms of financial sustainability. In particular, the position that the structural values of fiscal sustainability based on public deficits must be balanced with debt policies to overcome these risks also shapes the gross fiscal forecast values with debt policy scenarios in the later stages Darvas (2021). This situation also reveals important policy expectations in the presentation and realization of some applications and profiles of fiscal realism, together with other financial obligations. This process, which constitutes an important step in the balancing of fiscal sustainability and public deficits, seems to have brought debt policies to the fore in the last period more meaningfully, especially in the scenarios to be created for overcoming the process and overcoming the risks Sorensen and Yosha (1998). In shaping the following long-term strategies, the analysis and sensitivity of the actual effect values of financial instruments in overcoming possible financial risks in the long-term and the analytical scale have an important place in understanding the others. In this context, the structural framework of fiscal sustainability, which can be expressed based on the EU, requires an approach to prevent possible risks, especially with structural impact values, for public deficits and debt-based policies to act with an analytical balance index Auerbach and Gorodnichenko (2013).
When we look at the general average for the year rather than the calculations for each month after 2017, it is understood that the ratio of public expenditures, public revenues and public borrowings in GDP generally provides important information with a meaningful course. In this context, it is observed that EU countries, such as Bulgaria, Estonia and Slovakia, made more public expenditures regarding the increase in public borrowings in the post-2021 period and the increasing trends in public deficits IMF (2021). This situation has affected the EU average with other resource losses regarding fiscal sustainability. In the euro area, it appears that the total public expenditures in the EU constitute approximately 52.4% of the GDP and about 47.3 of the government revenues. Although the more stable and lower public deficits of 19 countries in the Euro Area among the EU countries create a stabilization effect throughout the EU, it can be mentioned that there is a stable course of public income and expenditure balances in all developing countries Mollet and Pilati (2021). In Table 2 below, it is possible to see the actual value of public expenditures, public revenues and public borrowing ratios as a ratio of GDP, which constitutes important dynamics in financial sustainability in recent years:
Table 2
|
Table 2
Changes in Recent Fiscal Sustainability Components and Public Fiscal
Deviations |
|||||
|
|
2018 |
2019 |
2020 |
2021 |
|
|
Euro area |
|
|
|
|
|
|
GDP market prices (mp) |
(Million euro) |
11600284 |
11984250 |
11413057 |
12262144 |
|
Government deficit (-) /
Surplus (+) |
(Million euro) |
-51875 |
-79609 |
-806943 |
-625709 |
|
% Of GDP |
-0.4 |
-0.7 |
-7.1 |
-5.1 |
|
|
Government expenditure |
% Of GDP |
46.9 |
46-.9 |
53.6 |
52.4 |
|
Government Revenue |
% Of GDP |
46.4 |
46.3 |
46.5 |
47.3 |
|
Government Debt |
(Million euro) |
9958230 |
10045506 |
11094716 |
11720340 |
|
% Of GDP |
85.8 |
83.8 |
97.2 |
95.6 |
|
|
EU |
|
|
|
|
|
|
GDP market prices (mp) |
(Million euro) |
13531540 |
14017169 |
13410757 |
14460655 |
|
Government deficit (-) /
Surplus (+) |
(Million euro) |
-52787 |
-78717 |
-906246 |
-675774 |
|
% Of GDP |
-0.4 |
-0.6 |
-6.8 |
-4.7 |
|
|
Government expenditure |
% Of GDP |
46.5 |
46.5 |
53 |
51.6 |
|
Government Revenue |
% Of GDP |
46.1 |
46 |
46.2 |
46.9 |
|
Government Debt |
(Million euro) |
10767561 |
10856499 |
12065668 |
12740563 |
|
% Of GDP |
79.6 |
77.5 |
90 |
88.1 |
|
|
Source European
Commission-Eurostat (2022), Euroindicators 46/2022 - 22 April 2022,
Amendment by Eurostat to Reported Data, Brussels: European Commission, 1. European Commission-Eurostat
(2022) |
|||||
As seen in Table 2 above, while there are different values , especially in the Euro Area and throughout the EU, it is possible to come across a standard equivalence as a ratio of GDP, especially in public expenditures and incomes. But this fiscal situation is not enough to explain the fiscal sustainability deviations due to growing public debt limits per cent of GDP, especially in recent years. Not only is this fiscal equivalence associated with government deficits at different values on average, but also at a higher rate of gross government borrowing in the Euro Area region of GDP. The primary situation here is 79.6 per cent, which is lower than the EU average in understanding financial sustainability. Still, in 2020 and 2021, it is observed that the Corona 19 process has entered a significant increasing trend with the pandemic effect. The rising trend after 2020 reveals that considerable deviation in fiscal sustainability is in a substantial deviation trend, with the GDP increasing around 90% in the Euro Area and the EU.
This deviation effect of the said increases in public
deficits on fiscal sustainability, which can also be explained by the index
increases of the debt studies, means an even higher level of financial
fragility at the EU level in recent years [24]. Besides, it should not ignore
being it reveals an incomplete public income balance, especially in balancing
the positive effect values with government revenues, which cause
fiscal sustainability deviations. This analysis also reveals that, as the average
risk values are around three per cent of GDP, a significant risk
increase arises mainly from the later member countries within the EU. This
deviation in the average index values also means that an even
higher negative effect value creates a negative index interaction due to public
deficits in terms of fiscal sustainability [25]. The negative reflection of the
financial fragility index in the EU on the process has created an indirect
analytical scale effect in public revenues, where the increasing borrowing requirement
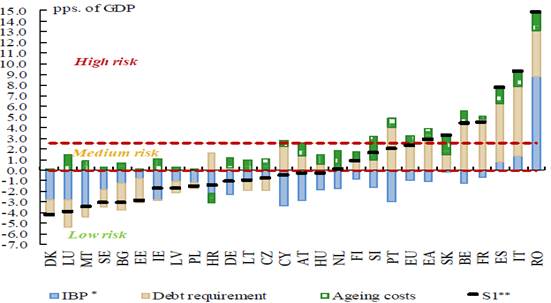
also includes actual losses in GDP ratios. In Graphic 1 below, it is possible
to see the real value of the rising average financial sustainability index in EU
countries and the position of average median distribution values
and high-risk values on a GDP basis:
Graphic 1
|
Graphic 1 Fiscal Sustainability and Its
Fiscal Components Changes (as average 2010 -2020) Source: European
Commission (2021), Debt Sustainability Monitor – 2020, European Economy:
Institutional Paper 143- February 2021, Luxembourg: Publications Office of
the European Union, 2021, p.55. [26] * Initial Budgetary
Position (IBP) **
Estimated Next Year ( as 2023 ) |
As seen in Graphic 1 above, the differences in the direct
ratio of high-risk ratios to GDP are an essential cause of financial fragility
and result in a negative index deviation on public deficits. The two main sub-dynamics
of the said financial fragility are the actual value of public deficits and the
absolute limit increases in borrowings related to these deficits. This
position, where the public fiscal balance index is negatively affected, means a
borrowing cost with a high financial value within the increasing high-risk
procedure, a phenomenon where the monetary and fiscal sustainability
coefficient is most affected Caselli and Philippe (2018).
It is inevitable that each increase in borrowing costs is an
essential source of risk, especially for the less developed countries in the EU
and causes deviations in the average EU financial risk procedure and fiscal
sustainability Angelis et al. (2022). From this point, the necessity of revealing
a national income relationship that can be explained with an analytical
analysis approach, especially fiscal sustainability, can be taken as the average
of different values, and a public deficit index emerges from this point.
4. EMPIRICAL APPROACH AND MODEL
In the analytical analysis of the fiscal sustainability approach, we approached the subject by considering the budget deficits as the dependent variable within the scope of the average budget values of the EU countries. At the same time, this approach aims to create a meaningful structure by including the classical budget deficits and possible inflation values, other public borrowing revenues, government expenditures and the effect level of interest rates and government data into the same analytical equation. In this context, it has emerged that some analytical approaches have to be put forward, especially in expressing, as a formulation, of the problem and in the expression of what values the standard budget deficits consist of. This justification also reveals a structure that integrates with actual values as a crucial analytical indicator in the understanding and emergence of the fundamental budget deficits for the expression of actual values as a ratio of GDP. Based on Misztal's (2021) approach, we present an approach framework as follows Misztal (2021):
In Equation 1 and Equation 2 above, SB: Standard Budget Deficits; PB: Basic Budget Deficits; PD: Public Debts; G: Government Expenditures; i: Interests on Public Borrowings; T: It refers to all public revenues, including taxes as well as non-tax revenues. The study is aimed to make the financial sustainability principles the subject of an empirical survey of the other mentioned components, primarily based on the fundamental budget deficits (PD). In this context, a meaningful analytical framework has been established for calculating the classical budget deficits, the actual value of the standard budget deficits and interest rates and their proportional changes in the national income (GDP). Traditional empirical scale values were determined in an environment based on these components in empirical studies. The fundamental budget deficits (PD) were defined according to these components as a dependent variable Misztal (2021):
In Equation 3 above, it is seen that the actual value of the fundamental budget deficits, which we base on, is expressed mainly based on interest rates and as a ratio of real national income. A structure in which the fundamental budget deficits will be expressed with their real value, which is the real national income, in understanding fiscal sustainability based on public deficits in real terms, as well as the real value of the difference of all tax revenues collected from public expenditures, and also the interest values that can be paid within the whole are meaningful. A heterogeneous panel data model was aimed to determine the scale effects of our study on the dependent variable. However, in the first stages of the panel data model, determinations on the examination and distribution of heterogeneous one- and two-way panel data models on the basis of more fixed parameters were aimed, starting from the classical model Cohen (1995). By expressing the classical approach in the primary basic panel data model below, we express other heterogeneous models:
![]() Equation
4
Equation
4
Fixed parameter
heterogeneous panel data Model:
The Heterogeneous
one- and two-way panel data model, which is based on the panel data model and
aimed at determining the slope values of the variables, has primarily been
considered in the study:
![]()
Equation 6
In addition, it has adopted an approach in which the Reduced Pattern Equation System approach is included in the data analysis in logarithmic values. Therefore, the findings were obtained within the framework of an equation in which the values of the scale effects of the Cross-Section and Periodic Subjective Independent Variables were analysed:
![]() Equation 7
Equation 7
Table 3
|
Table 3 Expresses of Dependent and Independent Model Components in The Model |
|
|
GvPD |
Government public deficits (as per cent of GDP) |
|
GvE |
Government Expenditures (as per cent of GDP) |
|
Government Revenues as per cent of GDP |
|
|
Variations in Government Debt (as per cent of GDP) |
|
|
MPrc |
Changes in Market Prices |
For the empirical analysis, quarterly data after 2012-2020 were taken as the basis, and real values were determined as a ratio of GDP as the actual value of each monthly change. In Panel Data analysis, a model was created with a Time Series model analysis. The model was constructed by considering the periodic logarithmic changes and periodical differences in the model.
In addition, the causality tests of the model's components are as follows in Table 4 as Granger Causality Tests:
Table 4
|
Table 4 Granger Causality Test Results |
||||
|
Null Hypothesis |
Obs |
t-statistic |
F-statistic |
Prob. |
|
GvPD has no causal relationship on MPrc |
109 |
-0.49359 |
2.54391 |
0.0428 |
|
GvD has no causal relationship on GvE |
109 |
-0.18354 |
6.21833 |
0.0594 |
|
MPrc has no causal relationship on GvD |
109 |
-0.37490 |
1.38393 |
0.1749 |
|
GvE has no causal relationship on GvR |
109 |
-0.45301 |
3.62819 |
0.03493 |
|
GvR has no causal relationship on GvPD |
109 |
-0.29462 |
6.29191 |
0.0518 |
According to the Philips-Perron unit root test results, it is seen
that the "C" coefficient values show a significant structure as
positive and negative values. In particular, the positive effect of public
revenues revealing values close to panel data analyses in the same position
with effect value and the periodic effect equivalence reveal that there is a
significant stagnation regarding the stagnation in the series. The
Phillips-Perron Test Statistic analysis was performed as a unit root test to
reveal the stationarity of all the sequences that were the subject of the
study, and it was found that the sequences were stationary in Table 5 below:
Table 5
|
Table 5 Unit Root Analysis Testing
Results |
||||
|
Variables |
Phillips-Perron
Test Statistic |
|||
|
|
Cofficient |
Std.
Error |
T-Statistic |
Prob. |
|
LnGvPD
|
-0.85438 |
0.53939 |
-2.44869 |
0.05269 |
|
LnGvE |
-0.06293 |
0.96362 |
-1.49828 |
0.02376 |
|
LnGvR |
2.53939 |
0.63053 |
-1.27631 |
0.00302 |
|
LnGvD |
-1.42830 |
0.29262 |
-2.38284 |
0.00163 |
|
LnMPrc |
-0.95263 |
0.40262 |
-1.38791 |
0.00617 |
As watched in Table 5 above, in our panel data analysis model, a
Philips-Perron Unit Root Test Analysis was performed to see the stability from
which we received data. Especially in the unit root tests, and by comparing the
probability values in the sequences, it appears that the stable ones in all the
sequences were provided with the probability values of the series whose
logarithms were taken less than “0.05” (0.05 > n). The determinations in our
model were made with the effect values in which public deficits, which are the
dependent variable, are accepted as the dependent variable, and within the
framework of the Equation
5 above,
and they were put forward under the assumptions (i=1,….N) (t=1,….T). It aimed
to reduce the assumption coefficients in the determinations by taking the
logarithm of all variables in the time series. Table 6 put forth below, model OLS (the
ordinary least squares) variations put forth meaningful results as a set of
cross-sectional data:
Table 6
|
Table 6
Estimates in Panel Cross-Section on the Ordinary Least Square Base |
|||||
|
Variable |
Coefficient |
t-
statistic |
f-
statistic |
Std.
Error |
Prob |
|
C |
2.769430 |
-7.365393 |
11.384045 |
7.532932 |
0.00000 |
|
LnGvPD |
0.628398 |
9.935321 |
18.393037 |
0.582922 |
0.00000 |
|
LnGvE |
-0.363832 |
-4.373932 |
41.539329 |
0.058302 |
0.00000 |
|
LnGvR |
0.537398 |
-3.252112 |
64.639327 |
0.583036 |
0.00000 |
|
LnGvD |
-0.532732 |
3.930318 |
52.538393 |
0.289404 |
0.00000 |
|
-0.283943 |
2.749409 |
36.528292 |
0.842839 |
0.00000 |
|
|
R-square |
0.639201 |
|
|||
As seen in Table 6 above, there is a situation supported by the
standard errors, which is close to the statistical values, together with the
existing values of the government's public deficits as the
dependent variable (LnGvPD). Significantly, the probability values
are zero. It is seen that the coefficient value of the public
deficits as the coefficient (C) value creates an effect value of
"0.6283" on the public deficits for each increasing unit, and this
effect value creates a positive effect on the public deficits. On the other
hand, apart from the government's public expenditures (LnGvE), it is seen that
public revenues create a negative effect as "-0.3638" value due to
the high public deficits at different values. The contribution value of public
revenues (LnGvR) in terms of public deficits and fiscal sustainability is
undoubtedly positive as "0.5373". On the other hand, it reveals that
public borrowing has a positive effect on different values of
public lending and has a positive value of around "0.5327". But in
the same way, it has a shrinking effect of "-0.2839" on public
deficits at the top of market prices. The fact that each unit increase in costs
creates a shrinking effect can be explained by the fact that increasing prices
are subject to more public revenue. The Hausman test results in Table 7 below are also expressed with probability
values that support the results in Table 7:
Table 7
|
Table 7
Hausman Test Results |
|||
|
Correlated Random Effects - HausmanTest |
|||
|
Method: Panel Cross-section random
effects test equation: |
|||
|
Equation Untitled |
|||
|
Test cross-section random effects |
|||
|
Test Summary |
Chi-Sq. Statistic |
Chi-Sq. d.f. |
Prob. |
|
Cross-section random |
3.6929361 |
3 |
0.483932 |
|
Cross-section random effects equation: |
|||
|
Variable |
Fixed |
Random Var (Diff) |
Prob. |
|
LnGvPD |
0.183393 |
0.438983 |
0.763983 |
|
LnGvE |
0.483826 |
0.743265 |
0.843683 |
|
LnGvR |
0.285433 |
0. 453739 |
0.953763 |
|
LnGvD |
0.164384 |
0.398352 |
0.483538 |
|
LnMPrc |
0.364940 |
0.530263 |
0.649463 |
|
Dependent Variable: LnGvPD |
|||
|
Sample: 2012-2020; Observations: 109 |
|||
|
Period Included: 96 |
|||
|
Cross-Section Included: 93 |
|||
As watched in Table 7 above, the probability values in Table 7 are more significant and more remarkable as greater than "0.05", which is a critical determination that shows the accuracy of the Hausman test results. On the other hand, the relative values of the test results' constant values, the Random Effect (Diff) values of the Random approach, and the positive coefficients continuing with the relative importance in the panel var are significant. In Table 8 below, the panel EGLS Cross-section Random impact test analysis was performed, and results were seen as below:
Table 8
|
Table 8 Panel EGLS (Cross-section
Random Effects Test) |
||||||
|
Method:
Panel Least Squares |
||||||
|
Sample:
2012-2020; Observations: 109 |
||||||
|
Period
Included: 96 |
||||||
|
Cross-Section
Included: 93 |
||||||
|
Variable |
Cofficient |
Std. Error |
T-Statistic |
Prob. |
||
|
LnGvPD |
1.03503 |
0.53739 |
12.5383 |
0.0000 |
||
|
LnGvE |
-2.63932 |
0.95363 |
22.9624 |
0.0000 |
||
|
LnGvR |
0.93538 |
0.43839 |
-21.1393 |
0.0000 |
||
|
LnGvD |
-0.68423 |
0.86353 |
-18.2732 |
0.0000 |
||
|
LnMPrc |
-0.00378 |
0.38739 |
-17.9353 |
0.0000 |
||
|
Effects Specification |
||||||
|
Period Fixed (dummy variables) |
||||||
|
R-squared |
0.735341 |
Mean Dependent var |
3.939032 |
|||
|
Adjusted R-squared |
0.749184 |
Akaike info criterion |
-0.382921 |
|||
|
Log likelihood |
63.738396 |
Shawarz criterion |
0.052839 |
|||
|
F-statistic |
94.373984 |
Hannan-Quin criterion |
-0.003539 |
|||
|
Prob(F-statistic) |
0.000000 |
Durbin-Watson stat |
0.825391 |
|||
In Table 8 above, to further clarify the determinations regarding our model and financial sustainability the role of the effect values on the dependent variable and the probability values were revealed. In The effect value of "1.03503" on the dependent variable (LnGvPD) for the panel EGLS test in Table 8 viewed above reveals that the structure of effect values in Table 6 is operationally the same in terms of negative and positive effects in effect values. In other words, any change in the effect values reveals the probability values based on the observations and the contribution values confirming the statistical deviations, especially converging the position that can be expressed with different values. The dependent variable exerts an influence directly on its own, with an additive value of "1.03503". In other words, revealing that each increase in public deficits has a one-to-one effect on public deficits is an important fiscal sustainability deviation. In this regard, it also reveals that each unit increase in increasing public expenditures creates a negative public deficit increase of approximately "-2.6393" units. The effect of public revenues affects public deficits positively, creating an effect of "0.9353". This positive effect brings the impact scale of public revenues, especially tax revenues, to the fore over the years. the negative interpretation of the issue of the government on public deficits is interpreted as an increase in the deficit effect on public deficits, as seen in the table. The effect values "-0.68423" and "-0.00378" are "LnGvD" and as "LnMPrc" effects, public borrowing has a significant negative impact on fiscal sustainability; however, market price variability -as an inflation value- reveals that the effect value on fiscal sustainability is smaller.
5. CONCLUSION
In the examination of the relationship between fiscal sustainability principles and public deficits within the scope of the EU, the effects of public revenues, public expenditures, and public borrowing, which play an important role in the increase in public deficits, as well as the degree of impact of price changes in the market have been investigated. It is seen that the increase in public deficits and significant public extreme expenditures and borrowings have a significant effect on fiscal sustainability. At the same time, this represents a set of fiscal policies that reveal the necessity of balancing public deficits with public expenditures in shaping the existing values and the fiscal policies to be formed. On the other hand, while these policies constitute an essential contribution value in revealing the fiscal deficits, it is understood that the effect of public expenditures on fiscal sustainability has a higher degree of negative effect since the excessive expenditures in direct public spending affect the current budgetary fragility level at a very high level. This effect also reveals that the borrowing limits that increase with the existing values and the medium and long-term borrowings have had a lower impact on fiscal sustainability. However, it is seen that the positive effect of public revenues creates a one-to-one positive contribution value with a very close positive scale effect on the growth of public deficits and positively affects fiscal sustainability by positively affecting public deficits. The increasing value of public borrowing limits as the EU average and the rising real deal of all cost functions related to annual cash debt requirements, primarily as the fiscal position in recent years, means a significant high financial risk for EU countries. This situation, which means an increasing risk process with the increase in public deficits and borrowing requirements, also necessitated the analysis of the fiscal sustainability values in the scenario formations, which can be estimated in the following years. This should be considered as a ratio of GDP within the scope of the sustainability of public borrowings as absolute fiscal values because of the other components related to GDP. In addition, as intended for this research, the relationship between real national income variability and interest rates and the relationship between basic public deficits, and the fact that the differences in national income variability create a direct effect scale from the multiplication of the basic budget deficits with the actual value is meaningful. Although the differences in public financial values between countries seem to hurt the developed EU countries as the average values of the contributions, the deviation values as average values should be evaluated with an expected fiscal sustainability concept in terms of fiscal sustainability for all EU countries, especially the nineteen countries in the Euro Area, it makes it indispensable to evaluate it in common standards based on joint financial projections.
CONFLICT OF INTERESTS
None.
ACKNOWLEDGMENTS
None.
REFERENCES
Angelis, F. De., Mollet, F. and Rayner, L. (2022). Rethinking EU Economic Governance: The Foundation for an İnclusive, Green and Digital Transition, Dıscussıon Paper Europe's Political Economy Programme Social Europe and Well-Beıng Programme, Brussels: European Policy Centre.
Auerbach, A.J. and Gorodnichenko, Y. (2013). "Fiscal Multipliers in Recession and Expansion", in A. Alesina and F. Giavazzi (Eds.), Fiscal Policy After the Financial Crisis, Chicago : University of Chicago Press, 63-93. https://doi.org/10.7208/chicago/9780226018584.003.0003.
Auerbach, A. J. and Gorodnichenko, Y. (2012). "Measuring the Output Responses to Fiscal Policy", American Economic Journal : Economic Policy, 4(2),1-27. https://doi.org/10.1257/pol.4.2.1.
Caselli,
F. and Philippe. W. (2018). Bunching at 3 Percent : The Maastricht
Fiscal Criterion and Government Deficits, Washington D.C: International
Monetary Fund (IMF).
https://doi.org/10.2139/ssrn.3236798.
Chalk, N. and Hemming, R. (2000). Assessing Fiscal Sustainability in Theory and Practice, IMF Working Paper WP/00/81, Washington D.C. : International Monetary Fund (IMF). https://doi.org/10.5089/9781451850352.001.
Chapman, J. I. (2008). "State and Local Fiscal Sustainability: the Challenges: the Quest for High-Performance Administration", Public Administration Review, Special Issue, 115-131. https://doi.org/10.1111/j.1540-6210.2008.00983.x.
Cohen, D. (1995). "Large External Debt and (Slow) Domestic Growth a Theoretical Analysis", Journal of Economic Dynamics and Control, 19(5-7), 1141-1163. https://doi.org/10.1016/0165-1889(94)00822-Y.
Darvas, Z. (2021). The Nonsense of Next Generation EU Net Balance Calculations, Policy Contribution. 03 (21).
Davoodi, H. R., Paul, E., Fotiou, A., Garcia-Macia, D., Han, X., Lagerborg, A., Lam, W., and Paulo, R. M. (2022). Fiscal Rules and Fiscal Councils Recent Trends and Performance During the COVID-19 Pandemic, IMF Working Papers WP/22/11, Washington D.C. : International Monetary Fund (IMF). https://doi.org/10.5089/9798400200472.001.
Deutsche Bundesbank (2020). The Informative Value of National Fiscal Indicators in Respect of Debt at the European Level, Deutsche Bundesbank Monthly Report December 2020, Berlin : Deutsche Bundesbank.
East Carolina University- ECU (2021). Fiscal Sustainability Initiative 2021, Campus Community : Academic Council, April 12, 2022 Fiscal Sustainability Update, East Carolina : East Carolina University Publishing.
European Commission (2021). Debt Sustainability Monitor - 2020, European Economy : Institutional Paper 143- February 2021, Luxembourg : Publications Office of the European Union.
European Commission (2022). European Financial Stability and Integration Review 2022, Banking and Finance, Brussels : European Commission.
European Commission-Eurostat (2022). Euroindicators 46/2022 - 22 April 2022, Amendment by Eurostat to Reported Data, Brussels : European Commission, 2022.
European Parliament (2022). Economic and Budgetary Outlook for the European Union 2022, Brussels : European Union, European Parliamentary Research Service (EPRS).
Haas, J. and Rubio, E. (2017). Brexit and the EU Budget : Threat Or Opportunity ? Notre Europe- Jacques Delors Institute, Policy Paper.
IMF (2020). Staff Report for The 2020 Article Iv Consultation and Request for Disbursement Under the Rapid Credit Facility-Debt Sustainability Analysis, December 18, 2020, Washington D.C. : International Monetary Fund (IMF).
IMF (2021). Regional Economic Outlook - Europe, October 2021. Washington D.C. : International Monetary Fund (IMF).
Laubach, T. (2009). "New Evidence on the Interest Rate Effects of Budget Deficits and Debt", Journal of the European Economic Association, 7(4), 858-885. https://doi.org/10.1162/JEEA.2009.7.4.858.
Meinen, P., and Serafini, R. (2021). The Economic İmpact of the Pandemic - Drivers Of Regional Differences, ECB Economic Bulletin, Issue 1/2021, Frankfurt Am Main : European Central Bank (ECB).
Misztal, P. (2021). "Public Debt and Economic Growth in the European Union. Empirical Investigation", WSEAS Transactions On Business And Economics, 18, 199-208. https://doi.org/10.37394/23207.2021.18.21.
Mollet, F. and Pilati, M. (2021). Updating The European İndustrial Strategy for the Post-Pandemic World, Brussels : European Policy Centre.
OECD (2010). Restoring Fiscal Sustainability: Lessons for the Public Sector, OECD Public Governance Committee Working Party of Senior Budget Officials, Paris: OECD Publishing.
Sorensen, B. and Yosha, O. (1998). "International Risk Sharing and European Monetary Unification", Journal of International Economics, 45, 211-238. https://doi.org/10.1016/S0022-1996(98)00033-6.
Soyres, C. De., Kawai, R., And Wang, M. (2022). Public Debt And Real GDP : Revisiting The Impact, IMF Working Paper WP/22/76, Washington D.C. : International Monetary Fund (IMF) Finance Department, 2022(076). https://doi.org/10.5089/9798400207082.001.
Teresa, C., Zsuzsanna, L. and Isabelle, I. (2007). Improving Public Sector Efficiency: Challenges and Opportunities, OECD Journal on Budgeting, 7(1). https://doi.org/10.1787/budget-v7-art6-en.
Veldhuizen, S. V. and Barnes, S. (2020). European Fiscal Monitor September 2020, The Network Of EU Independent Fiscal Institutions and Acting Chair at the Irish Fiscal Council-2020, Frankfurt Am Main : European Commission.
Zahariev, A., Radulova, A., Aleksandrova, A. and Petrova, M. (2021). "Fiscal Sustainability And Fiscal Risk in the EU : Forecasts And Challenges in Terms of Covid-19", Entrepreneurship and Sustainability Issues, 8(3), 618-632. https://doi.org/10.9770/jesi.2021.8.3(39).
 This work is licensed under a: Creative Commons Attribution 4.0 International License
© Granthaalayah 2014-2022. All Rights Reserved.