Effect of Abattoir Effluent on some Heavy Metals and Physico-chemical Parameters of Ta’jan water in Ogbagi Akoko, Ondo State
Adene I. C. 1![]()
![]() ,
Oloye, T.G. 2
,
Oloye, T.G. 2![]()
![]() , Akinsorotan, A.M 3
, Akinsorotan, A.M 3![]()
![]() ,
Afolabi, D. 4
,
Afolabi, D. 4![]() , Obilana, O.M. 4
, Obilana, O.M. 4![]()
1 Senior Lecturer, Department of Fisheries and Aquaculture, Adekunle Ajasin University, Akungba Akoko, Nigeria
2 Assiatant Lecturer, Department of
Fisheries and Aquaculture, Adekunle Ajasin
University, Akungba Akoko,
Nigeria
3 Reader, Department of Fisheries and Aquaculture, Federal University Oye-Ekiti, Nigeria
4 Department of Fisheries and Aquaculture, Adekunle Ajasin University, Akungba Akoko, Nigeria
|
|
|
ABSTRACT |
|
|
The study examined the effect of abattoir effluent on some physico-chemical parameters and heavy metal content of Ta’jan River in Ogbagi Akoko, Ondo State. Water samples were taken once in October and November at seven different locations along the receiving water body at sampling points:S1, S0, S2, S3, S4, S5 and S6; S1 (10meters upstream of the point at which effluents enter the stream),S0 (point at which effluents enter the stream) S2 (10 meters downstream of the point of effluent discharge), S3 (20meters downstream of the point of effluent discharge), S3 (30meters downstream of the point of effluent discharge), S4 (40meters downstream of the point of effluent discharge), S5 (50meters downstream of the point of effluent discharge) and S6 (60meters downstream of the point of effluent discharge) along Ta’jan stream. The time of taking the samples were in the morning during slaughter hours. The samples were collected, preserved, and analysed in the laboratory using standard methods. Wastewater parameters analysed were dissolved oxygen, Temperature (TEMPT), conductivity (COND), salinity, turbidity, nitrate, sulphate, phosphate, pH, total suspended solid (TSS), total dissolved solid (TDS), and heavy metals, such as iron, lead, copper, and zinc. The downstream levels of most of the parameters were significantly (p<0.05) better than the discharge point. This suggests river Ta’jan has good recovery capacity. The findings
can be useful in identifying the water quality problems and how to improve
the water body when been diverted into fishponds or used for all other
industrial or agricultural purposes in the community. |
|||
|
Received 22 November 2022 Accepted 23 December 2022 Published 06 January 2023 Corresponding Author Adene I. C., iadene2007@yahoo.com DOI10.29121/granthaalayah.v10.i12.2022.4750 Funding: This research
received no specific grant from any funding agency in the public, commercial,
or not-for-profit sectors. Copyright: © 2022 The
Author(s). This work is licensed under a Creative Commons
Attribution 4.0 International License. With the
license CC-BY, authors retain the copyright, allowing anyone to download,
reuse, re-print, modify, distribute, and/or copy their contribution. The work
must be properly attributed to its author.
|
|||
|
Keywords: Abattoir Effluent, Heavy Metals, Physico-Chemical Parameters, Ta’jan
Water |
|||
1. INTRODUCTION
The dependence of man on animal protein is huge. About 17 and 33% of the total kilocalorie and protein consumption by humans, respectively is contributed by livestock Rosegrant et al. (2009). The process of making this animal protein available on the table usually involves a slaughter house which in turn directly or indirectly puts availability of clean and unpolluted water in jeopardy when wastes of such slaughter houses are released untreated into waterways. The menace of unregulated discharge of abattoir effluent into waterways has become a huge problem in Nigeria. A lot of people consider aquatic freshwater systems to be dumping grounds.
A slaughter house also known as abattoir is a specialized facility approved and registered by the regulatory authority for inspection of animals, hygienic slaughtering, processing and effective preservation and storage of meat products for human consumption Bandaw and Herago (2017). The actions that take place in a slaughter house involves the use of a lot of water and therefore a corresponding amount of water is discharged as wastes Akanni et al. (2019). Waste water from slaughter houses usually contain organic substances made up of livestock carcass, blood and undigested food. Since 35% of the body weight of every animal slaughtered ends up in the wastewater Kosamu et al. (2011)., this contributes a very high amount of organic material in the receiving water body. The high organic material in the water body could increase the levels of nitrogen, phosphorus and total solids in the receiving water body Omole and Longe (2008). It also causes anaerobic conditions and increase the biological oxygen demand in the receiving water body Adesina et al. (2018). This inflow of effluents accumulatively upsets the balance of water quality parameters and puts a strain on the development of aquatic organisms Chukwu et al. (2008). In addition to increasing the organic content in a water body, wastes from abattoirs can be loaded with deadly pathogens Cadmus et al. (1999). The pathogens could eventually infect humans when such wastes are released into our waterways. A lot of rural communities rely on such waterways for drinking water and domestic use as well as for fish production. Organisms inhabiting such water bodies may suffer ill health and also become diseases vector. Incidence of diseases such as Bacillosis, Brucellosis and Salmonellosis could break out where wastes from slaughter houses have been improperly disposed Adesina et al. (2018). Bioaccumulation of heavy metals is also a cause for concern as heavy metals are not biodegradable. Aquatic organisms exposed to heavy metals bioaccumulate such metals and they eventually end up on the menu of humans. Heavy metals are desired in tiny quantities as nutrients but they become toxic when above permissible limits,thus, they pose a risk to fish health. Abalaka et al. (2020) found cellular damage in organs of C. gariepinus with heavy metal bioaccumulation.
Taj’an River is located in Ogbagi Area of Ondo State, Nigeria. It receives effluents directly from an abattoir. It is worthy of mention that effluents from abattoirs in Nigeria are hardly ever treated before being released into waterways. In addition to this, some abattoirs also wash the slaughter meat with the same water Durotoye et al. (2018). This practice increases the incidence of waterborne diseases amongst the populace using the water. Therefore, the aim of this research work is to examine the impact and consequences of the continuous discharge of abattoir wastes on surface water quality and to determine its effect on the physiochemical parameters and heavy metals of Taj’an river.
2. MATERIALS AND METHODS
2.1. Study area
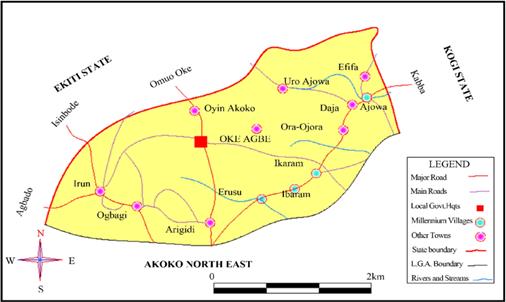
Ogbagi Akoko is situated in the western part of Ondo State, Nigeria. It is located at latitude 7° 35' 0" North, 5° 43' 0" East. An average of five cattle are slaughtered daily, from where vendors come to purchase the meat which are then sold across the town and its suburbs. The abattoir has an open slaughter slab, where the cows are slaughtered. De-haring is done either with hot water or fire. Close to the slaughter slab is a heap where paunch materials are dumped and have accumulated over the years.
Figure
1
|
Figure 1 Akoko Northwest in the Context of Ondo State (Source: Ondo State Ministry of Housing and Urban Development, 2015) |
2.2. Collection of Samples and Analysis
Water samples were collected very early in the morning during slaughter hour into labelled sterile containers at seven sampling points:S1, S0, S2, S3, S4, S5 and S6; S1 (10meters upstream of the point at which effluents enter the stream),S0 (point at which effluents enter the stream) S2 (10 meters downstream of the point of effluent discharge), S3 (20meters downstream of the point of effluent discharge), S3 (30meters downstream of the point of effluent discharge), S4 (40meters downstream of the point of effluent discharge), S5 (50meters downstream of the point of effluent discharge) and S6 (60meters downstream of the point of effluent discharge). Each sample bottle was rinsed three times with the river water at the point of collection before filling with samples. After filling the bottle, a drop of H2SO4 was added to the water for preservation. The Hydrogen ion concentrations (pH) and Temperature were taken on the field using an automatic digital pH meter and Thermometer. The sample bottles were subsequently wrapped in black polythene nylon and immediately taken to the laboratory for standard physicochemical and heavy metals analysis as described by APHA (1998). Samples were collected twice, once in October and also in November.
This water analysis was carried out using aqua regia. 5g of each water sample was transferred into a 250ml digestion tube and the mixture was added to it. The mixture was boiled gently for 15-30 minutes to oxidize all easily oxidizable matter until dense white fumes appeared. The solution was cooled and filtered through Whatman No.1 filter paper and transferred quantitatively to a 100ml volumetric flask by adding distilled water. The digested solution was transferred into a universal bottle and was analyzed on Atomic Absorption Spectrophotometer (AAS)
2.3. Data Analysis
The result obtained from the laboratory analysis were subjected to data analysis using SPSS, version 23. one-way Analysis of Variance (ANOVA) at 0.05 significance level was employed to test for homogeneity in mean variance of the parameters across the sampling points.
3. RESULTS AND DISCUSSION
The result of the Physiochemical analyses of Ta’jan river is summarized and presented in Table 1 below.
Table 1
|
Table 1 Physiochemical Parameters of Sampling Points Across River Ta’jan, Ogbagi Akoko, Ondo State |
|||||||
|
Parameter |
S0 |
S1 |
S2 |
S3 |
S4 |
S5 |
S6 |
|
TEMP(0c) |
28.93±0.06b |
28.93±0.06b |
28.73±0.06c |
28.93±0.06b |
28.83±0.12bc |
29.07±0.06a |
29.07±0.06a |
|
DO (mg/l) |
1.33±0.12f |
2.77±0.06e |
2.97±0.06d |
3.13±0.06c |
3.33±0.06b |
3.43±0.06ab |
3.53±0.06a |
|
COND |
440.83±0.06a |
415.70±0.17c |
434.13±0.06b |
411.27±0.03e |
409.52±0.02f |
413.04±0.12d |
400.22±0.02g |
|
pH |
7.10±0.01g |
7.94±0.00f |
8.02±0.00e |
8.33±0.00a |
8.22±0.00c |
8.06±0.00d |
8.26±0.00b |
|
SALI (%) |
0.90±0.00a |
0.80±0.00a |
0.90±0.00a |
0.80±0.00a |
0.80±0.00a |
0.80±0.00a |
0.80±0.00a |
|
TDS |
221.71±0.01a |
208.93±0.02c |
217.30±0.00b |
206.02±0.02e |
204.91±0.01f |
206.11±0.01d |
201.82±0.02g |
|
TS (mgl-1) |
242.11±0.01a |
214.16±0.01c |
223.20±0.01b |
209.21±0.00e |
206.82±0.01f |
209.30±0.01d |
203.23±0.01g |
|
TSS |
20.39±0.02a |
5.24±0.01c |
5.90±0.01b |
3.19±0.02d |
1.91±0.01e |
3.20±0.01d |
1.41±0.01f |
|
TURB |
746.23±0.01a |
433.21±0.01c |
525.16±0.03b |
217.47±0.01e |
208.20±0.01f |
221.22±0.01d |
185.80±0.06g |
|
NO (mgl-1 |
10.32±0.01a |
7.34±0.01c |
7.57±0.01b |
6.32±0.00e |
5.62±0.01f |
6.97±0.07d |
5.10±0.01g |
|
SO (mgl-1 |
31.32±0.01a |
19.81±0.01c |
23.54±0.03b |
18.34±0.01e |
14.12±0.01f |
19.31±0.01d |
10.32±0.01g |
|
PO (mgl-1 |
1.00±0.00a |
0.91±0.00c |
0.97±0.00b |
0.60±0.00e |
0.43±0.00f |
0.62±0.00d |
0.32±0.00g |
a-g =indicate that means on the same row but with different superscripts are statistically significant (P<0.05).
S0 which is the point at which the effluent entered the water consistently had the highest values for almost all the parameters except for the DO which was the lowest recorded. As shown in Table 1, the values of all the other sampling points varied progressively. The temperature across all sampling points ranged from 29.07 to 28.73oC. The conductivity, salinity, TDS, TS, TSS, turbidity, NO, SO, and PO all followed the same trend with S0 having the highest and S6 having the least. pH ranged between 7.10 and 8.33 across all sampling pointsi it was highest in S3 and the least was recorded in S0 as shown in Table 1.
The result of the heavy metals concentration of Ta’jan river is summarized and presented in Table 2 below.
Table 2
|
Table 2 Concentration of heavy metal across several sampling points in River Ta’jan Ogbagi Akoko, Ondo State |
|||||||
|
Parameter |
So |
S1 |
S2 |
S3 |
S4 |
S5 |
S6 |
|
Zn |
0.40±0.02f |
0.88±0.00d |
0.95±0.01c |
1.34±0.01b |
1.51±0.00a |
0.92±0.01c |
0.74±0.02e |
|
Fe |
0.42±0.01f |
5.23±0.07b |
2.73±0.00de |
3.16±0.01c |
2.70±0.02e |
6.49±0.03a |
2.81±0.02d |
|
Pb |
0.03±0.01g |
0.18±0.00d |
0.11±0.00f |
0.13±0.00e |
0.25±0.00b |
0.38±0.00a |
0.20±0.00c |
|
Cu |
0.28±0.00c |
0.24±0.00d |
0.14±0.00g |
0.52±0.01a |
0.38±0.01b |
0.23±0.01e |
0.19±0.01f |
|
a-g =Indicate That Means on The Same Row but With Different Superscripts Are Statistically Significant (P<0.05) |
|||||||
Zinc, Iron, Lead, and copper concentration are shown in the table above. Zn concentrations ranged from 0.4 to 1.54, the highest value was recorded in sampling point S4 while S0 had the least. As displayed above iron had a range between 0.42 to 6.49. Lead had the least concentration of all the metals, sampling point S0 had concentration of 0.03, while the highest was 0.38 recorded in S3. Least concentration of copper at 0.14 was recorded at S2 while the highest at 0.52 was recorded at S3.
Temperature recorded across the sampling points were slightly different from one another with some sampling points significantly different. Water temperature has been known to vary along the length of a river with latitude and elevation and can also vary between small sections that are mere meters apart (RAMP), hence, the slight variation may be unconnected to the release of abattoir wastes into the waterway but could be due to some covered portions of the water body. The temperature recorded across all sampling points were however within FEPA (1991) permissible range of 40oC for tropical aquaculture systems.
The Dissolved oxygen content was lowest at the point of entry, values ranged from 1.13mg/L-1 to 3.53mg/L-1, these values are consistently below those recommended by WHO (World Health Organization) (2011) and FEPA. (1991), 5mg/l is the stipulated standard for sustaining aquatic life while concentrations below 2mg/l may be fatal for most fishes Chapman (1997). The lowest dissolved oxygen value obtained for the discharge point (S0) could be attributed to the enormous amount of organic load it receives from the abattoir which requires high levels of oxygen for chemical oxidation and decomposition of nutrients thereby depleting the available oxygen as suggested by Chukwu et al. (2008). The generally low DO across all collection points could also be attributed to the dry season in which the samples were collected, this corroborates the work of Adeogun et al. (2011) where they reported lower DO levels during the dry season. High turbidity incidence as a result of the abattoir effluent especially the inflow of blood could also be responsible for the general low DO, high turbidity reduces photosynthesis by reducing the amount of light penetrating the water column. As shown on the table 1, the DO increased steadily away from the effluent entry point. This may be due to aeration of the water as it flowed downstream, and natural recovery capacity of the stream as suggested by Kosamu et al. (2011).
S0 which is the receiving point had the highest TDS. Effluents usually contain faecal wastes, and they could have been responsible for the high TDS as suggested by Njoku-Tony et al. (2018). The TDS recorded for river Ta’jan was acceptable and under the 1000mg/l level recommended by the WHO (World Health Organization) (2011), this proves river Ta’jan had acceptable levels of TDS.
Total Suspended Solids (TSS) ranged from 20.39mg⁻¹ and 1.41mg⁻¹. Point S0 also had the highest TSS, this may be due to the fact that point S0 gets the most TSS directly from the abattoir as it is the receiving point. As it flows down the river, it gets separated in the river current and this justifies why low TSS values were recorded downstream. This is similar to the work of Kosamu et al. (2011). carried out in Malawi, where the discharge point had the highest TSS.
The pH of the abattoir waste sample ranged from 7.1±0.01 - 8.3±0.00, this range is comparable to values reported by Adeogun et al. (2011). The discharge point S0 had the least pH. This drop in pH at the discharge point could be attributed to the formation of humic acid from decaying organic material as suggested by Rim-Rukeh et al. (2006). pH is the indicator of acidic, neutral, and alkaline conditions in the water. Although pH value varied across the collection points, the pH range is good for fish culture, this suggests river Ta’jan to be a good source of water for fish culture because of its recovery ability.
Conductivity which is a measure of the dissolved ionic component and total dissolved substitution in water ranged between 440.83Uscm⁻¹ - 400.22Uscm⁻¹. All the samples had conductivity within the permissible limits of 1000 Uscm⁻¹ recommended by the WHO (World Health Organization) (2011). The discharge point (S0) had the highest conductivity, and this may be due to salts from detergents used to wash the slaughtered and roasted cow. Although Kosamu et al. (2011). attributed the high conductivity to salts from detergents used to wash clothes upstream.
The salinity ranged between 0.80% - 0.90%, and there was no significant difference in the level of salinity across all the collection points, this shows that river Ta’jan is fresh water, it supports algae growth and several other freshwater organisms.
Turbidity ranged between 185.8- 746.23 (NTU) across the collection points, and they were all significantly (P < 0.05) different from each other. S6 had the lowest value and S0 had the highest value. The high turbidity recorded at the discharge point (S0) indicates that blood and faecal waste from the abattoir is undiluted at this point. The differences between the points could be ascribed to the distances between each collection point because the effluents would have had more time to settle out.
Nitrate NO3- ranged between 10.32mgl-1 - 5.10mgl-1, with the water samples from S0 having the highest value while S6 had the least value. The value recorded for S0 was above the WHO (World Health Organization) (2011) permissible limits of 10.0mgl⁻¹, all the other collection points were within the stipulated limits. This could be due to nitrogenous wastes including partially digested food from the gut of slaughtered animals being washed into the river. There were significant differences in the values of the nitrate between different points, this could have occurred due to the activities of bacteria on the nitrates as the water flowed downstream.
Sulphate (SO4-2) ranged between 31.32 mgl-1 and 10.32mgl-1. Water samples from S0 had the highest value while S6 had the lowest value. Although no guideline value has been postulated; however, the recommendation of WHO (World Health Organization) (2011) is that any concentration higher than the permissible limits of 100 mgl⁻¹ is termed unhygienic. All values recorded were under the permissible limit.
Phosphate (PO43-) ranged between from 0.32mgl-1 to 1.00mgl-1. Phosphate values recorded in River Ta’jan were generally low and are below the recommended values of 3.50-5.00 stipulated by the WHO (World Health Organization) (2011).
Zinc, Iron, Lead and Copper were found in River Ta’jan as shown in Table 2. All were at acceptable levels and under the limit set for freshwater bodies by WHO (World Health Organization) (2011). The heavy metal content at all sampling points varied by at least 120% from point S0 to point S6, this suggests the abattoir effluent contributed some heavy metals to the stream. This is in line with the work of Jukna et al. (2006) who stated that the blood, hair, and most organs of cattle have been found to contain toxic metals. Terrumun and Oliver (2015) suggested Lead found in the samples may be due to the presence of lead in the rumen contents of cows that grazed along the highways. Another study by Ogundele et al. (2015) also observed that heavy metals were present in high concentrations in grasses and shrubs that grew along the highways. The Zn content of the River Ta’jan at the sampling points could have been contributed by infiltrating rainwater from house roofs around the area as suggested by Elemile et al. (2019).
4. CONCLUSION
Unchecked and irresponsible discharge of abattoir effluents puts a huge strain on aquatic organisms. It disrupts the balance in the physicochemical parameters of the water as well as constitutes an unsightly waterway.
CONFLICT OF INTERESTS
None.
ACKNOWLEDGMENTS
None.
REFERENCES
Abalaka, S. E., Enem, S. I., Idoko, I. S., Sani, N. A., Tenuche, O. Z., Ejeh, S. A., and Sambo, W. K. (2020). Heavy Metals Bioaccumulation and Health Risks With Associated Histopathological Changes in Clarias Gariepinus from the Kado Fish Market, Abuja, Nigeria. Journal of Health and Pollution, 10(26), 200602. https://doi.org/10.5696/2156-9614-10.26.200602.
Adeogun, A. O., Chukwuka, A. V., and Ibor, O. R. (2011). Impact of Abattoir and Saw-Mill Effluents on Water Quality of Upper Ogun River (Abeokuta). American Journal of Environmental Sciences, 7(6), 525-530. https://doi.org/10.3844/ajessp.2011.525.530.
Adesina, A. O., Ogunyebi, A. L., Fingesi, T. S., and Oludoye, O. O. (2018). Assessment of Kara Abattoir Effluent on The Water Quality of Ogun River, Nigeria. Journal of Applied sciences and Environmental Management, 22(9), 1465-1470. https://doi.org/10.4314/jasem.v22i9.17.
American Public Health Association. (1998). American Public Health Association ; Standard Methods for The Examination of Water And Waste\Water (20th Ed). New York.
Ayotunde, A., Adebanji, O., and Olumuyiwa, O. (2019). The Impact Assessment of Abattoir Waste Facility Discharge on Water in Osogbo, Nigeria. Cogent Engineering, 6, 1, 1614317. https://doi.org/10.1080/23311916.2019.1614317.
Cadmus, S. I., Olugasa, B. O., and Ogundipe, G. A. (1999). The Prevalence of Zoonitic Importance of Bovine Tuberculosis in Ibadan, Nigeria. Proceedings of The 37th Annual Congress of the Nigeria Veterinary Medical Association, 65-71.
Chapman, D. (1997). Water Quality Assessment. A Guide To the Use of Biota Sediments and Water In Environmental Monitoring (2nd Ed). E and F N Spon. File : A//:/Hydrology and Water Quality of Lake Merced. Htm., 56-59.
Chukwu, O., Mustapha, H. I., and Gafar, H. B. (2008). The Effect of Minna Abattoir Waste Water on Surface Water Quality I. Environmental Research Journal, 3, 334-338.
Durotoye, T. O., Adeyemi, A. A., Omole, D. O., and Onakunle, O. (2018). Impact Assessment of Wastewater Discharge From A Textile Industry In Lagos, Nigeria. Cogent Engineering, 5(1), 1-11. https://doi.org/10.1080/23311916.2018.1531687.
Elemile, O. O., Raphael, D. O., Omole, D. O., Oloruntoba, E. O., Ajayi, E. O., and Ohwavborua, N. A. (2019). Assessment of The Impact of Abattoir Effluent on The Quality of Groundwater in a Residential Area of Omu-Aran, Nigeria. Environmental Sciences Europe, 31(1), 16. https://doi.org/10.1186/s12302-019-0201-5.
Fepa. (1991). National Interim Guidelines and Standard for Industrial Effluents, Gaseous Emission and Hazardous Waste in Nigeria. Federal Environmental Protection Agency, 52.
Jukna, C., Jukna, V., and Suigzdaite, J. (2006). Determination of Heavy Metals in Viscera and Muscles of Cattle. Bulgar J Veter. Medico, 9, 35-41.
Kenneth Kwadzah, T., and Terna Iorhemen, O. (2015). Assessment of The Impact of Abattoir Effluent on The Water Quality of River Kaduna, Nigeria. World Journal of Environmental Engineering, 3(3), 87-94. https://doi.org/10.12691/wjee-3-3-3.
Kosamu, I. B. M., Mawenda, J., and Mapoma, H. W. T. (2011). Water Quality Changes Due to Abattoir Effluent: A Case on Mchesa Stream in Blantyre, Malawi. African Journal of Environmental Science and Technology, 5(8), 589-594. https://doi.org/10.5897/AJEST11.042.
Njoku-Tony, F., Ogbuagu, D. H., Ihejirika, C. E., Nwoko, C. O., Amaku, G. E., Azoro, V. A., Ukaegbu, K., Ezikeudu, E. C., and Edafienene, E. O. (2018). Impact of Abattoir Waste on the Water Quality of Amilimocha River Asaba, Delta State. International Journal of Energy and Environmental Research, 6(1), 25-35.
Ogundele, D. T., Adio, A. A., and Oludele, O. E. (2015). Heavy Metal Concentrations in Plants and Soil Along Heavy Traffic Roads in North Central Nigeria. Journal of Environmental and Analytical Toxicology, 5, 334. https://doi.org/10.4172/2161-0525.1000334.
Omole, D. O., and Longe, E. O. (2008). An Assessment of the Impact of Abattoir Effluents on River Illo, Ota Nigeria. Journal of Environmental Science And Technology, 1(2), 56-64. https://doi.org/10.3923/jest.2008.56.64.
RAMP (Regional Aquatics Monitoring Program). Water Quality Indicators : Temperature and Dissolved Oxygen.
Rim-Rukeh, A., Ikhifa, O. G., and Okokoya, A. P. (2006). Effects of Agricultural Activities on the Water Quality of Orogodo River, Agbor Nigeria. Journal of Applied Sciences Research, 2, 256-259.
Rosegrant, M. W., Fernandez, M., Sinha, A., Alder, J., Ahammad, H., Defraiture, C., And Zhu, T. (2009). Looking Into the Future for Agriculture and AKST (Agricultural Knowledge Science and Technology). In B. D. Mcintyre, H. R. Herren, J. Wakhungu and R. T. Watson (Eds.), Agriculture at a Crossroads. Island Press. Google Scholar, 307-376.
Tamenech, B., and Tamirat, H. (2017). Review of Abattoir Waste Management. Global Veterinaria, 19, 517-524.
WHO (World Health Organization) (2011). Guidelines for Drinking Water Quality P. 4thedn. WHO.
 This work is licensed under a: Creative Commons Attribution 4.0 International License
© Granthaalayah 2014-2022. All Rights Reserved.